 2013, Vol. 28
The Chinese Meteorological Society
Article Information
- LI Jian, YU Rucong, SUN Wei. 2013.
- Duration and Seasonality of Hourly Extreme Rainfall in the Central Eastern China
- J. Meteor. Res., 28(6): 799-807
- http://dx.doi.org/10.1007/s13351-013-0604-y
Article History
- Received August 16, 2013
- in final form October 16, 2013


2 State Key Laboratory of Numerical Modeling for Atmospheric Sciences and Geophysical Fluid Dynamics, Institute of Atmospheric Physics, Chinese Academy of Sciences, Beijing 100029;
3 University of Chinese Academy of Sciences, Beijing 100049
Extreme precipitation usually refers to the rainfallinstances that are rare and with rainfall intensity farbeyond local climatology. Because of massive rainfallamount produced in a short time, extreme precipitation can lead to severe disasters such as flood, l and slide, and debris flow, and usually causes extensive lossof life and property. Therefore, the features and mechanisms of extreme precipitation have received specialattention from the fields of meteorology, climatology, and hydrology(Zhai et al., 1999; Easterling et al., 2000; Alexander et al., 2006).
Due to complicated weather conditions and climate backgrounds, and influenced by various factors, extreme precipitation in China exhibits significant regional differences. Zhai et al.(2005)selected the 95thpercentile of historical rainfall as the threshold of extreme precipitation, pointing out that extreme precipitation increased in western China and mid-lowerreaches of the Yangtze River while decreased in NorthChina and the Sichuan basin. Yu and Li(2012)fittedthe amount-intensity curve with exponential distribution and defined the double e-folding decay intensityas the threshold of extreme precipitation, finding thatthe extreme precipitation in southern China has significantly increased over the past 40 years. Using Gen-eralized Pareto Distribution to fit daily rainfall data, Dong et al.(2011)analyzed the distribution of formalpaRAMeter, and evaluated the trend of extreme precipitation over Huang-Huai and Jiang-Huai regions.
By synthesizing the above studies and the research progress in this field(Li et al., 2008; Jiang et al., 2009; Zhang and Wei, 2009), it can be knownthat there are three key questions in the study of extreme precipitation: the method for threshold determination, the temporal resolution of rainfall data, and the scientific issues about extreme precipitation. Thedetermination of threshold is the most important question, which directly concerns the sample selection and further affects the analysis results. Objectivity, quantification, and comprehensive consideration for localclimate background, especially for the feature of thetail of probability distribution, are highly essential inthreshold determination.
In the respect of scientific issues about extremeprecipitation, most studies concentrate on the varia-tion trend of extreme precipitation, while fewer studieshave emphasized the characteristics of rainfall eventitself. Calculating the crucial paRAMeters of extremeprecipitation processes and underst and ing the gener-ality of extreme precipitations are a foundation notonly important to mastering the characteristics of suchevents, but also key to making better forecasts and predictions in disaster prevention and mitigation.
Aiming at addressing the above questions, thispaper fits the long-term hourly rainfall data with theGeneralized Extreme Value(GEV)distribution, and analyzes the duration and seasonal characteristics ofextreme precipitation over China. The GEV distribution has a solid mathematical foundation, whichcould objectively extrapolate the extreme values and precisely identify the intensity thresholds for rainfallswith different return periods. Meanwhile, the resultsprovide instructions to the selection of extreme events, and offer valuable references at corresponding level(N-year return period)in hydrological engineering, infrastructure planning, and other relevant fields. Furthermore, long-term hourly precipitation data guarantee the precision of precipitation intensity, as well asprovide su°cient samples(50 annual extremes)to theGEV distribution. Based on hourly intensity thresholds and hourly precipitation data series, the characteristics of extreme precipitation events will be analyzed on hourly scale in this paper. 2. Data and methodology
The dataset of hourly raingauge records at 575stations over mainl and China from 1954 to 2010 hasbeen used in this study. This dataset was obtainedfrom the National Meteorological Information Center(NMIC)of the China Meteorological Administration(CMA) and has undergone strict quality control, including consistency test and extreme value test for cli-mate background and single station. Further quality control(Li et al., 2011)has also been applied asfollows: daily rainfall amount(Rh)is calculated bythe hourly data and is compared with the record ofdaily rainfall amount(Rd); if |Rh - Rd| > Rd/10, the records of hourly data for this particular day areregarded as missing values; if effective observation isless than 15% of the annual total, the hourly recordsin this year are marked as missing values. Finally, 321 stations without a missing year during 1961-2010were chosen to analyze the precipitation characteristics over mainl and China. Besides, at each station, arainfall event starts when measurable precipitation(≥0. 1 mm h-1)occurs after 2 or more dry hours. Following Yu et al.(2007), the duration of a rainfall eventis defined as the number of hours from the beginningto the end of the event, during which time there is nointermittence or at most a 1-h intermittence.
The first and foremost question in the study ofextreme weather or climate events is the definition and selection of extreme events. This paper adoptsGEV distribution(Coles, 2001)to identify the intensity thresholds of precipitation with different returnperiods. By taking Yueyang station as an example, the methodology is briefly illustrated here. Firstly, wefind out the annual maximum of hourly precipitationamount(RAM), and depict its empirical distributionfunction by circles and corresponding lines in Fig. 1a. The minimum, maximum, and mean values of RAMduring 1961-2010 are 12. 6, 90. 0, and 36. 11 mm h-1, respectively. According to the classical theory of extreme value, the distribution of RAM is calculated asfollows:
where σ > 0 and G is the distribution of the generalized extreme value. Based on RAM in the 50-yrperiod of 1961-2010, G can be obtained through maximum likelihood estimation; e. g., at Yueyang station, paRAMeters μ = 30. 701, σ = 10. 012, and ξ = -0. 025. Meanwhile, the classical model of RAM is calculated byusing Eq.(1) and shown by the curve in Fig. 1a. Comparion of the statistical distribution and the model result shows that the distribution calculated from Eq.(1)can reasonably reproduce the key features of theempirical distribution, and thus is a reliable estimation of the distribution of RAM. Based on this curve, it is convenient to identify the cumulative probability(vertical coordinates)corresponding to certain intensity(horizontal coordinates). Conversely, the intensitythreshold for a specific probability or certain returnperiod can be calculated from the inverse function ofEq.(1). Therefore, based on the empirical distribution and the GEV distribution, Fig. 1b shows the rainfall intensities on different return periods at Yueyangstation, and the return periods of 5, 10, 20, 50, and 100yr and their corresponding intensities(45. 44, 52. 62, 59. 38, 67. 94, and 74. 24 mm h-1)are indicated withdotted lines. In this way, the distribution of RAM and the intensity threshold for the crucial return period isrespectively estimated at 321 stations over China.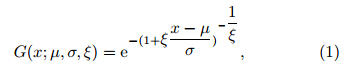
 |
| Fig. 1.(a)Cumulative distribution function of hourly precipitation during 1961-2010 at Yueyang station(hollowcircles and horizontal lines are observation results; curves are estimation results of cumulative distribution function);(b)rainfall intensities on different return periods at Yueyang station(hollow circles are observation results, solid lines denoteestimation results of cumulative distribution function, and dotted lines represent estimation results of 5-, 10-, 20-, 50-, and 100-yr return period from left to right). |
For the 50-yr period, the expected frequencies ofrainfall events with return periods of 5, 10, 20, 50, and 100 yr are 10, 5, 2. 5, 1, and 0. 5, respectively. Theremight be some biases between expected frequencies and actual frequencies, and whether these biases arein the reasonable scope is an important criterion totest the reasonability of intensity thresholds. Figure 2shows the statistical distribution of actual frequenciesof rainfall events at the 321 stations. Average frequencies for the above return period are 12. 59, 5. 82, 2. 76, 0. 99, and 0. 38, respectively. This result is close to theexpected frequencies. The box at each return periodcovers at most 3 occurrences of extreme rain hours. The dispersion is relatively high at 5-yr return period;the frequency at one station reaches 22 occurrencesthere, but it falls back to 8 at 10-yr return period. Itis worth noting that the dispersion is very low at 50-yrreturn period. There are 180 stations(accounting for56. 07% of the total)having 1 extreme rainfall event at50-yr return period. The good coherence between actual frequency and expected frequency further provesthe reasonability of the methodology.
 |
| Fig. 2. Distribution of rainfall frequency(rainfalls areclassified by threshold values for different return periods, abscissa represents rainfalls with 5-, 10-, 20-, 50-, and 100-yr return period, ordinate indicates statistical results ofrainfall frequency(with unit of h as frequency also equalsduration for consecutive hourly rainfalls)at 321 stations(h), thick lines are the medians of rainfall frequency at 321stations, solid circles are mean values, top(bottom)edgeof each box is rainfall frequency of the 75th(25th)percentile, hollow circles mark the frequency values 1.5 timeshigher than the height of each box). |
With the identified threshold, it is possible to select rainfall events at certain levels, and to analyzethe various features of rainfall events. Since the rain-fall events with 5-yr return period have the scarcityattribute of extreme events and contain more samplesthan the events with longer return periods, the following analysis on the features of extreme precipitationwill focus on rainfall events with 5-yr return period. The thresholds of hourly intensity for 5-yr returnperiod events present an inhomogeneous distributionover China. The maximum threshold among the 321stations is 84. 53 mm h-1, while the minimum is only4. 56 mm h-1. There are 8(5)stations with thresh-old higher(lower)than 70(10)mm h-1 and all ofthem are located in the southern coastal(Northwest)China. Figure 3 shows the distribution of intensitythresholds for extreme precipitation with 5-yr returnperiod. A line from northeast to southwest separatesChina into a southeastern high-value area and a northwestern low-value area. Four large centers in the highvalue area are located over North China, mid and lowerreaches of the Yangtze River, southern coastal China, and west of the Sichuan basin. There is a relativelylow-value belt in eastern China between 25° and 28°N.
 |
| Fig. 3. Distribution of threshold values of hourly rainfallintensity(mm h-1)of 5-yr return period. |
Underst and ing the characteristics of extreme precipitation processes can provide valuable references toweather forecast, disaster prevention, and damage alleviation. This section makes a comparison analysis onthe characteristics of rainfall process among the threestations located in North China, the mid and lowerreaches of Yangtze River, and southern coastal China, respectively. In Fig. 4, different colors are used topresent features of the precipitation process with 5-yr return period at Weichang, Yueyang, and Shanweistations. There are 12, 10, and 10 events reachingthe st and ard of 5-yr return period at the three stations. The most evident differences among the threestations lie in rainfall duration and amount during theprecipitation process. With relatively short durationin each event, Weichang station in Northeast Chinapresents an average rainfall duration of 5 h over 12events, and holds relatively weak intensities(exceptfor the peak hour)with an average process rainfallamount of 44. 78 mm only. Accompanied by longerrainfall duration, Yueyang station in central China hasa 12-h average duration and a 112. 44-mm process rainfall amount. Located in the southern coastal China, Shanwei station experiences rainfalls of more than 6h in each event, and has average rainfall duration aslong as 21. 4 h. Moreover, the proportion of intenseprecipitation in Shanwei station is much larger thanthe other two stations. Consequently, contributed byboth long duration and high intensity, Shanwei stationhas an average process rainfall amount of 250. 04 mm.
 |
| Fig. 4. Evolution of hourly precipitation intensity(mm h-1)of 5-yr return period at(a)Weichang, (b)Yueyang, and (c)Shanwei stations(abscissa is converted to the relative time(h)to precipitation peaks, and ordinate representsdifferent rainfall events). |
The remarkable differences among the three stations suggest that the characteristics of rainfall eventsare regionally dependent. As an important aspect ofthe regional climate feature, the rainfall duration hasattracted some concerns(Yu et al., 2007; Li et al., 2011). But the duration of extreme precipitation israrely discussed. As shown in Fig. 5a, there are 66stations having an average duration shorter than 6 h, which are located in Northeast China, northern and eastern North China, Northwest China, and westernSouthwest China. Meanwhile, 252 stations have anaverage duration longer than 6 h, among which 44stations are longer than 12 h. The high value areasare mainly distributed in coastal regions, the YangtzeRiver valley, and east of the Tibetan Plateau. Theabundant water vapor supply over the coastal regions and the unique altostratus and nimbostratus to theeast of the Tibetan Plateau provide favorable background for occurrences of long-duration extreme precipitation(Yu et al., 2004). Another important feature is the duration from precipitation occurrence toprecipitation peak(DOP). DOP reflects the speed ofprecipitation development and is directly connected tothe warning and response time of disasters. The geographical distribution of DOP is shown in Fig. 5b. There are 30 stations with a DOP longer than 6 h, and most of these stations are located in coastal regions. Meanwhile, 71 stations present a DOP shorter than2 h, and the low value centers can be connected bythe topographic height contour of 1200 m(the whitethick curve). Spreading along with the Great Khingan Mountains, Taihang Mountains, Wu Mountains, and Xuefeng Mountains, these low value stations arelocated on the boundary line between the second and the third terrain ladders, and other sporadic low valuestations mostly lie to the east of complex terrains. Thehigh value center of average duration in the Sichuanbasin in Fig. 5a disappears in Fig. 5b. At Yibinstation, which is located on a large terrain gradient, the average duration is as long as 15. 4 h, while theDOP is only 1. 7 h. These results suggest that therapid development of extreme precipitation is possibly related to topographic effects. Since geographicalregions with complex terrains always have a potentialdanger of geological disasters, the fast development ofextreme precipitation could cause l and slides or debrisflows in these regions. Therefore, it is necessary tomake a further analysis on the processes and mechanisms of precipitation in these regions.
 |
| Fig. 5.(a)Distribution of average rainfall duration(h)for precipitation events of 5-yr return period;(b)as in(a), butfor duration from precipitation occurrence to precipitation peak(h). White thick curve denotes the topographic heightcontour of 1200 m. |
In most regions of China, precipitation presentsremarkable seasonal variations, i. e., the amount and intensity of precipitation are often concentrated in certain period of a year. This notable seasonal changealso exists in extreme precipitation, making the occurrence date another important feature of extremeprecipitation. In order to represent the seasonal characteristics of extreme precipitation, we identified theoccurrence date of precipitation with 5-yr return period, and then found the date of the first and the lastoccurrence time.
The dashed line in Fig. 6a illustrates the probability density distribution of the first occurrence timeof 321 stations over China. Spreading from spring tosummer, the dispersion of the first occurrence dateamong stations is relatively large. At 52 stations, theannual first extreme precipitation occurs in April. It isalso found that 84 stations have the first occurrence ofextreme precipitation in May. June has the biggestnumber of stations(130 stations), and the peak ofprobability density appears in its later period. AfterJuly, the probability density curve drops fairly fast. Figure 6b presents the distribution of the first occurrence time of extreme precipitation. Spring dominatedstations are located in South China, corresponding tothe spring persistent rainfall there with long durations(Tian and Yasunari, 1998; Wan and Wu, 2007). Moststations in North China and Northeast China have itsfirst extreme precipitation around the end of June.
 |
| Fig. 6.(a)Probability density distribution of the firstoccurrence time(dashed line) and the last occurrence time(solid line)of extreme precipitation with 5-yr return period.(b)Distribution of the first occurrence time of precipitation with 5-yr return period(arrows point to the season of rainfall occurrence at 10-day intervals).(c)As in(b), but for the last occurrence time. |
Compared to the first occurrence time, the probability density distribution of the last occurrence timehas a higher peak and a more concentrated distribution. At 80% stations, the annual last extreme precipitation occurs from mid August to late September. Correspondingly, vector directions of the last occurrence time are highly consistent(Fig. 6c). Only a fewstations located in the coastal regions and SouthwestChina have extreme precipitation until after October. Since underst and ing of the general range of the occurrence date of extreme precipitation could provide better monitoring and warning of disastrous weather, itis especially necessary to conduct intensive case analyses and diagnoses on extreme precipitation events thathappen outside the traditional flood season. 4. Conclusions
Using hourly station raingauge data during thepast 50 years, the intensity thresholds of extreme precipitation are identified through Generalized ExtremeValue(GEV)distribution, and the characteristics ofextreme precipitation events are analyzed in this paper. The major conclusions are summarized as follows.
(1)Using the GEV method, the intensity thresholds of hourly precipitation can be reasonably and objectively identified.
(2)The distribution of thresholds of extreme precipitation with a 5-yr return period is complicated and regionally dependent. Generally, the thresholdsin Southeast China are much higher than that inNorthwest China.
(3)North China has a short average duration ofextreme precipitation, while the southern coastal regions, the Yangtze River valley, and the eastern edgeof the Tibetan Plateau present long average durationsof above 12 h. In areas with great altitude differences and complex geographic conditions, the extremeprecipitation events usually experience a rapid development from its occurrence to peak.
(4)The occurrence of extreme precipitation hassignificant seasonal variations. Some stations in southern China record extreme precipitation in as early asApril, while most parts of northern China have theannual first occurrence of extreme precipitation untilthe end of June. The annual last extreme precipitationevents are concentrated in August and September.
The intensity thresholds of extreme precipitationprovide an objective st and ard and reliable criterionto define hourly extreme precipitation over China. The analyses in this paper are based on station raingauge data, and the underst and ing of rainfall eventscan be further enriched with the combination of atmospheric circulation data, radar data, and satelliteremote sensing data. Circulation data could supplythree-dimensional structure and evolutionary featureof extreme precipitation, and offer information on thelarge-scale background and influencing system, such asthe typhoon in coastal regions, the vortex downstreamof the Tibetan Plateau, and the mesoscale advectionon the Meiyu front. The remote sensing data can provide information about rainfall structure and cloudmicrophysics, which makes it possible to investigatethe precipitation and cloud features at higher temporal and spatial resolutions. With a full combinationof both macroscopic and microscopic information, thecognition of extreme precipitation events would befurther enhanced.
| [1] | Alexander, L. V., X. Zhang, T. C. Peterson, et al., 2006: Global observed changes in daily climate extremes of temperature and precipitation. J. Geophys. Res., 111, D05109, doi: 10.1029/2005JD006290. |
| [2] | Coles, S., 2001: An Introduction to Statistical Modeling of Extreme Values. Springer, London, 45-57. |
| [3] | Dong, Q., X. Chen, and T. X. Chen, 2011: Characteristics and changes of extreme precipitation in the Yellow-Huaihe and Yangtze-Huaihe River basins, China. J. Climate, 24(14), 3781-3795. |
| [4] | Easterling, D. R., J. L. Evans, P. Ya Groisman, et al., 2000: Observed variability and trends in extreme climate events: A brief review. Bull. Amer. Meteor. Soc., 81(3), 417-426. |
| [5] | Jiang Zhihong, Ding Yuguo, and Cai Min, 2009: Monte Carlo experiments on the sensitivity of future extreme rainfall to climate warming. Acta Meteor. Sinica, 67(2), 272-279. (in Chinese) |
| [6] | Li Hongmei, Zhou Tianjun, and Yu Rucong, 2008: Analysis of July-August daily precipitation characteristics variation in eastern China during 1958-2000. J. Atmos. Sci., 32(2), 358-370. (in Chinese) |
| [7] | Li Jian, Yu Rucong, Yuan Weihua, et al., 2011: Changes in duration-related characteristics of late summer precipitation over eastern China in the past 40 years. J. Climate, 24(21), 5683-5690. |
| [8] | Tian, S. F., and T. Yasunari, 1998: Climatological aspects and mechanism of spring persistent rains over central China. J. Meteor. Soc. Japan, 76(1), 57-71. |
| [9] | Trenberth, K. E., A. G. Dai, R. M. Rasmussen, et al., 2003: The changing character of precipitation. Bull. Amer. Meteor. Soc., 84(9), 1205-1217. |
| [10] | Wan Rijin and Wu Guoxiong, 2007: Mechanism of the spring persistent rains over southeastern China. Sci. China (Ser. D), 50(1), 130-144. |
| [11] | Yu Rucong, Wang Bin, and Zhou Tianjun, 2004: Climate effects of the deep continental stratus clouds generated by the Tibetan Plateau. J. Climate, 17(13), 2702-2713. |
| [12] | —-, Xu Youping, Zhou Tianjun, et al., 2007: Relation between rainfall duration and diurnal variation in the warm season precipitation over central eastern China. Geophys. Res. Lett., 34, L13703, doi:10.1029/2007GL030315. |
| [13] | —-, Li Jian, Yuan Weihua, et al., 2010: Changes in characteristics of late-summer precipitation over eastern China in the past 40 years revealed by hourly precipitation data. J. Climate, 23(12), 3390-3396. |
| [14] | —and Li Jian, 2012: Hourly rainfall changes in response to surface air temperature over eastern contiguous China. J. Climate, 25(19), 6851-6861. |
| [15] | Zhai Panmao, Sun Anjian, Ren Fumin, et al., 1999: Changes of climate extremes in China. Climatic Change, 42(1), 203-218. |
| [16] | —-, Zhang Xuebin, Wan Hui, et al., 2005: Trends in total precipitation and frequency of daily precipitation extremes over China. J. Climate, 18(7), 1096-1108. |
| [17] | Zhang Huan and Zhai Panmao, 2011: Temporal and spatial characteristics of extreme hourly precipitation over eastern China in the warm season. Adv. Atmos. Sci., 28(5), 1177-1183. |
| [18] | Zhang Ting and Wei Fengying, 2009: Probability distribution of precipitation extremes during raining seasons in South China. Acta Meteor. Sinica, 67(3), 442-451. (in Chinese) |