 2014, Vol. 28
The Chinese Meteorological Society
Article Information
- ZOU Han, ZHU Jinhuan, ZHOU Libo, LI Peng, MA Shupo. 2014.
- Validation and Application of Reanalysis Temperature Data over the Tibetan Plateau
- J. Meteor. Res., 28(1): 139-149
- http://dx.doi.org/10.1007/s13351-014-3027-5
Article History
- Received May 13, 2013;
- in final form August 23, 2013


The Tibetan Plateau is an important geographicfeature over the Northern Hemisphere. The plateaucovers an area of about 2.3 × 10⁶ km2, with an average elevation of more than 4000 m above sea level.Strong absorption of solar radiation by the surface ofthe plateau elevates the surface air temperature relative to that at the same latitudes in the surrounding regions. This heating generates eddies, waves, and convective motions, which in turn impact weather and climate both over the plateau and throughout Asia and the Northern Hemisphere(Ye and Gao, 1979; Yanai et al., 1992; Tao et al., 1999; Zhou et al., 2009) . For example, Yanai et al. (1992) concluded that the onset ofthe Asian monsoon results from the thermal effects ofthe plateau. Wang et al. (2008) showed that increasesin surface temperature over the Tibetan Plateau couldenhance subtropical frontal rainfall in East Asia. Zhuet al.(2010)revealed a close relationship betweendecadal precipitation in East China and the temperature contrast between East China and the TibetanPlateau. Bao et al. (2010) found that a disastrouscold spell with heavy snowfall in central and southernChina in January 2008 was associated with anomalouswarming over the Tibetan Plateau. Zhao et al. (2013) established that surface temperature over the TibetanPlateau could be used as a predictor of summertimedust storm activity in the Tarim basin. Zhou and Luo(1994) and Zou(1996) identified a regional ozone minimum over the Tibetan Plateau, and attributedthis minimum to vertical motion in the atmospheredriven by high surface temperatures. The surface temperature related to the Tibetan thermal effect is therefore a key index of synoptic, climatologic, and environmental variability on regional and hemispheric scales.
Many studies of surface temperature over the Tibetan Plateau have been based on temperature observations at weather stations over the plateau(Liu and Chen, 2000; Du, 2001; Duan and Wu, 2006; You et al., 2008; Kang et al., 2010) . For example, Liu and Chen(2000) used data from 97 weather stationslocated at elevations above 2000 m to study trendsin surface temperature over the plateau from 1955 to1996. They obtained warming trends of 0.16℃ perdecade in annual mean temperature and 0.32℃ perdecade in winter mean temperature. These trends exceed the trends typical of the latitudinal zone containing the Tibetan Plateau, as well as the trendsfor the entire Northern Hemisphere. Du(2001)analyzed observations of surface temperature taken at36 weather stations over the Tibetan Plateau, and identified a warming trend of 0.26℃ per decade in annual mean temperature between 1961 and 2000. Healso pointed out that daily minimum temperature increased faster than daily maximum temperature overthat same period(i.e., the diurnal range in surfacetemperature decreased). Duan and Wu(2006) calculated a warming trend of 0.25℃ per decade in observations of surface temperature taken at 71 weatherstations over the Tibetan Plateau from 1961 to 2003.They also noted that the increase in daily mean temperature was mainly attributable to an increase in thenighttime minimum temperature. All of these studiesindicate sharp increases in surface temperature overthe Tibetan Plateau between the 1950s-1960s and theend of the 20th century.
Trend analyses using current surface observationsover the Tibetan Plateau are unsatisfactory in severalrespects. The Tibetan Plateau is covered by numerousmountain systems. Weather stations on the TibetanPlateau are generally located in residential areas, nearwater sources on the valley floors. Surface temperatures measured at these stations could be higher thanthe mean values of all the stations in the area becauseof differences in elevation among the stations. Forexample, the Sog County weather station(31.53°N, 93.47°E)is located 4023 m above sea level, but themean elevation of the 1.5° × 1.5° area centered at thisstation is 4837 m above sea level. Recent rapid urbanization in Tibetan residential areas has also "forced"relocation of observation stations from rural to urban areas. The effects of urbanization may thereforebias the area-averaged warming rate over the plateau(Kalnay and Cai, 2003; Zhou et al., 2004) . Furthermore, logistical difficulties associated with forbiddingconditions over much of the Tibetan Plateau meanthat the spatial distribution of weather stations on theplateau is essentially inhomogeneous. Most stationsare located in the more accessible central and easternparts of the plateau. Only a few stations are locatedin the western part. Almost no station is located inthe northwestern part(Fig. 1; see also the list and map of station locations given in the references citedabove). These problems in the location and distribution of weather stations introduce substantial uncertainties into assessments of surface temperature and its trend over the Tibetan Plateau.
 |
| Fig. 1. The topography of the Tibetan Plateau, with an elevation contour interval of 200 m. The plateau boundaryis defined as the 3000-m elevation contour, which is plotted as a thick black line. Radiosonde stations are denoted bysquares and weather stations by circles. |
Reanalysis products like NCEP-R1(Kalnay et al., 1996) and ERA-40(Uppala et al., 2005) providebroader spatial coverages than weather station dataover the Tibetan Plateau(see above references and station locations in Fig. 1). They are particularly relevant for climate studies(Wei and Li, 2003; Zhao et al., 2004; Frauenfeld et al., 2005; Duan and Wu, 2006; You et al., 2013) . The surface elevation in a reanalysis dataset depends strongly on the data resolutionapplied. For example, the spectral horizontal resolution of NCEP-R2 reanalysis is T62(Kanamitsu et al., 2002) , while that of ERA-Interim reanalysis is T255(Dee et al., 2011) . These differences in resolution couldintroduce differences in surface temperature betweenreanalysis datasets. Differences in the parameterizations used to represent various physical processes and the data(amount and quality)assimilated during theanalysis step may also lead to inconsistencies amongreanalysis surface temperature products(Ma et al., 2008; Wang and Zeng, 2012) . Evaluation of surface temperature and its trend over the Tibetan Plateaubased on these reanalysis products may therefore besignificantly different, depending on the reanalysisused. These differences can further confuse our underst and ing of climate change over the Tibetan Plateau.
Here, we evaluate three popular reanalysis temperature products(NCEP-R2, ERA-Interim, and JRA-25)with respect to topography, satellite observation, and radiosonde data over the Tibetan Plateau.The results are used to formulate a reliable picture ofthe climatology and changes of surface temperatureover the Tibetan Plateau, while reducing the impactof uncertainty associated with the choice of reanalysis datasets. We then use the most reliable reanalysisproduct to analyze the climatology and trend of surface temperature over the Tibetan Plateau. 2. Data
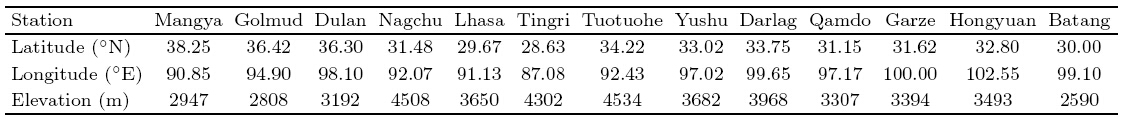
We use monthly mean surface air temperaturefrom the NCEP-R2(Kanamitsu et al., 2002) , ERAInterim(Dee et al., 2011) , and JRA-25(Onogi et al., 2007) reanalysis datasets over the period 1979-2010.The approximate horizontal resolutions of the datasetsare 1.875° × 1.904°(T62 Gaussian grid)for NCEP-R2, 1.5° × 1.5° for ERA-Interim, and 1.25° × 1.25° for JRA25. The topography of the Tibetan Plateau is obtainedusing a 1° × 1° topographic dataset obtained from theGlobal L and One-km Base Elevation Project digitalmap(GLOBE, 1999) . The observation data includenighttime l and surface temperature observed by TerraMODIS with a horizontal resolution of 0.05° × 0.05°from 2001 to 2010(Wan, 2008) . These data are averaged onto a 1° × 1° horizontal grid. MODIS nighttimetemperature observations are taken between 1530 and 1700 UTC(approximately 2130 to 2300 local time).We compare these observations with the reanalysis at1800 UTC.We also use monthly mean radiosonde temperature profiles taken at 13 stations from 1979 to 2010(described in Table 1 and indicated as squares in Fig. 1). These radiosonde data are observed at 17 st and ardaltitude levels, and obtained from the China Meteorological Data Sharing Service System(CMDS, 2005a, b) . We also applied general quality control st and ardsto these datasets, but without verifying their temporalhomogeneity. We therefore apply a statistical homogenization(Wang, 2008) to the radiosonde temperaturedata series.
We verify the reliability of the surface temperatures produced by NCEP-R2, ERA-Interim, and JRA-25 by first calculating the mean temperature distribution over the Tibetan Plateau from 1979 to 2010. Wethen compare these mean temperature distributionswith topographic data and the mean distribution ofl and surface temperature observed by Terra MODISbetween 2001 and 2010.
Within a given climate zone, higher elevations areassociated with lower temperatures due to the vertical lapse rate of temperature in the atmosphere. Thelong-term mean distribution of temperature shouldcorrelate negatively with the topography of the Tibetan Plateau, at least to the leading order. Relatively high temperatures should be observed at lowerelevations and vice versa. The topographic elevation ofthe Tibetan Plateau increases from east to west(Fig. 1). The northwestern part of the plateau contains alarge region of high elevation(over 5000 m), which isalso called the northern Tibetan Plateau(33°-36°N, 77°-92°E). The highest elevations within this area exceed 5200 m and are located within 34°-36°N, 77°-83°E. Another region of elevation over 5000 m is located in the southwestern plateau(the Himalaya and Gangdise regions)near 29°-32°N, 80°-90°E, with elevations above 5200 m near 31°N, 82°-85°E.
Figure 2 shows the mean distributions of surfacetemperature between 1979 and 2010 from NCEP-R2, ERA-Interim, and JRA-25. All the three datasets produce an area of cold surface temperature over the Tibetan Plateau with sharp gradients across the boundary of the plateau, but they differ in detailed spatialdistribution of surface temperature. NCEP-R2 produces a nearly symmetrical pattern of surface temperature over the plateau, with the lowest temperature(less than -12℃)located in central Tibet near 33°-34°N, 84°-88°E, which is not coincident with the location of the highest elevations. The distributions ofsurface temperature produced by ERA-Interim and JRA-25 both contain more detailed features than thatproduced by NCEP-R2. ERA-Interim shows two regions with low temperature(less than -8℃)in thenorthwestern plateau. One of these regions is locatednear 34°-36°N, 76°-83°E, and the other near 35°-36°N, 83°-88°E. The former region is larger in area and contains lower temperatures than the latter. TheERA-Interim temperature distribution is consistentwith the topography of the northern Tibetan Plateau.JRA-25 also shows two regions of low temperature, one near 33°-35°N, 77°-82°E with temperature below-6℃, and the other near 34°-36°N, 84°-90°E withtemperature below -8℃. The former region is smallerin area and contains higher temperatures than thelatter. This distribution is not consistent with thetopography of the northern Tibetan Plateau. In thesouthwestern plateau, ERA-Interim also shows a coldtongue, with temperatures below -2℃ extending to29°N, 87°E, and with a cold core of approximately-6℃ near 32°N, 81°E. This cold tongue approximatelycoincides with elevation in the Himalaya-Gangdise region. JRA-25 also produces a cold tongue in thisregion(with temperatures below -2℃ extending to30°N, 87°E), but with no obvious cold core over thehighest elevation.
 |
| Fig. 2. Climatological mean surface temperatures(℃; shading)averaged between 1979 and 2010 based on the(a)NCEP-R2, (b)ERA-Interim, and (c)JRA-25 reanalyses. Elevation is indicated by contour lines, with the plateauboundary(3000 m)indicated by a thick solid line. |
These results indicate that ERA-Interim providesa more realistic representation of the topographic effect on surface temperature than NCEP-R2 does. Furthermore, the distribution of surface temperature produced by ERA-Interim is more consistent with the detailed topography of the plateau than that producedby JRA-25.
Figure 3 shows nighttime surface air temperatureproduced by the reanalyses and l and surface temperature retrieved from Terra MODIS observationsaveraged over the period 2001-2010. The linear correlation between nighttime l and surface temperature(LST) and surface air temperature is significant and insensitive to l and surface type or season(Shen and Leptoukh, 2011; Zhu et al., 2013) . A stronger similarity between the distribution of reanalysis nighttimeair temperature and the Terra MODIS nighttime LSTtherefore indicates a more reliable reanalysis product.The reanalysis nighttime air temperatures shown inFig. 3 have been averaged over the same period as theTerra MODIS data. The nighttime LSTs are negatively correlated with elevation over the plateau, witha large area of low LSTs over the northern TibetanPlateau(near 34°-37°N, 76°-92°E). The lowest LSTs(less than -16℃)observed in this region are locatednear 35°N, 79°E. A second area of cold LSTs is located in the Himalaya-Gangdise region, with the lowest LSTs(less than -12℃)near 31°N, 82°E. The distribution of nighttime air temperature from NCEP-R2(Fig. 3a)again shows a nearly symmetrical pattern, with the coldest air temperatures located near the center of the plateau. This distribution differs substantially from the distribution of nighttime LSTs observedby Terra MODIS. The distribution of nighttime airtemperature from ERA-Interim(Fig. 3b)is similarto that observed by Terra MODIS. ERA-Interim produces a large region of low air temperatures over thenorthern Tibetan Plateau(though with no clear minimum) and a second region of low air temperatures overthe Himalaya-Gangdise region(with a minimum of lessthan -8℃ near 31°N, 81°E). The distribution of nighttime air temperatures from JRA-25(Fig. 3c)containsa large region of low temperatures over the northernTibetan Plateau, but the location of the temperatureminimum(less than -12℃ near 36°N, 89°E)differssubstantially from that observed by Terra MODIS.JRA-25 also produces a second region of low temperatures over the Himalaya-Gangdise region, but with noclear minimum. Overall, ERA-Interim nighttime airtemperatures provide the closest approximation to thedistribution of LST observed by Terra MODIS amongthe three reanalysis products.
 |
| Fig. 3. Climatological mean nighttime surface air temperatures(℃; shading)averaged from 2001 to 2010 based on the(a)NCEP-R2, (b)ERA-Interim, and (c)JRA-25 reanalyses. Climatological mean nighttime l and surface temperaturesobserved by Terra MODIS during the same time period are shown as contour lines. |
The distribution of surface air temperature overthe Tibetan Plateau produced by ERA-Interim is mostconsistent with both expectations from topography and observations of the Terra MODIS satellite. Thedistribution produced by JRA-25 correctly reflectsmost of the topographic features and the distributionof LST derived from satellite observations, but failsin some key respects. The distribution produced byNCEP-R2 does not reflect either the topography ofthe plateau or the satellite observations. The ERA-Interim temperature product is the most reliable basedon these validation criteria. 3.2 Validation against radiosonde data
We further assess the reliability of the NCEPR2, ERA-Interim, and JRA-25 reanalysis products bycomparing reanalysis temperatures with observed temperatures at 13 radiosonde stations. The radiosondetemperatures are vertically interpolated to the levelsof the reanalysis products, and the reanalysis temperatures are horizontally interpolated to the radiosondestation locations. This procedure reduces uncertainties related to differences in elevation and location.
Figure 4 shows a statistical comparison betweenthe surface air temperatures from the three reanalysisproducts and radiosonde observations at each of the13 stations. NCEP-R2 temperature has the largestbias at most of the radiosonde stations, especiallyat Nagchu, Lhasa, and Tingri, with a mean error of -1.4℃(Fig. 4a). Biases in ERA-Interim and JRA-25are smaller, with a mean bias of -0.6℃in ERA-Interim and a mean bias of -0.2℃ in JRA-25. The root-mean-square errors(RMSEs)are also largest for NCEP-R2(with a mean RMSE of 2.8℃)(Fig. 4b). ERA-Interim and JRA-25 have smaller RMSEs(1.3℃ and 1.2℃, respectively). The time series of NCEP-R2 temperature is weakly correlated with radiosonde observationat all the stations but Mangya, with a mean correlation coefficients of 0.36(Fig. 4c). These correlationsare much stronger for ERA-Interim and JRA-25, withmean correlation coefficientss of 0.87 for ERA-Interim and 0.92 for JRA-25. The temperature trend derivedfrom NCEP-R2 has relatively large errors at most ofthe radiosonde stations(again with the exception ofMangya), with a mean error of -0.48℃ per decade(Fig. 4d). Errors are smaller in trends derived fromERA-Interim and JRA-25, which have mean errors of -0.01℃ and 0.06℃ per decade, respectively. ERA-Interim and JRA-25 temperatures consistently perform better than NCEP-R2 with respect to radiosondeobservations over the Tibetan Plateau. JRA-25 performs slightly better than ERA-Interim with respectto errors and temporal correlations, but slightly worsewith respect to temperature trends. The ERA-Interim and JRA-25 reanalysis products provide more reliablerepresentations of the climatology and trends in surface temperature at these radiosonde stations than theNCEP-R2 reanalysis product.
 |
| Fig. 4. Statistical comparison between monthly mean reanalysis temperatures and radiosonde observations at 13stations:(a)absolute errors, (b)root-mean-square errors(RMSE), (c)correlation coefficients between the annual meantime series, and (d)absolute errors between temperature trends calculated from reanalyses and radiosonde data. Allmetrics are presented as means for the period 1979-2010. |
To summarize, surface temperatures from theERA-Interim and JRA-25 reanalyses are more reliablethan surface temperature from the NCEP-R2 reanalysis based on validations against topography, satellite observation, and radiosonde data. ERA-Interimperforms better than JRA-25 over the entire plateauwith respect to expectations based on topography and satellite observations. JRA-25 generally performsbetter than ERA-Interim with respect to radiosondeobservations at individual stations, although ERA-Interim provides slightly better estimates of long-termtrends. The radiosonde stations used in this validation are located exclusively in the eastern part of theplateau(Fig. 1). Our validation against radiosondedata therefore does not reflect the performance of thereanalysis products over the entire plateau. Overall, we judge the ERA-Interim surface temperature themost reliable reanalysis data for use in climate studiesover the Tibetan Plateau. 4. Surface temperature climatology and trends over the Tibetan Plateau
We derive the climatology and long-term trendsof surface air temperature over the entire Tibetan Plateau(altitudes greater than 3000 m)from 1979to 2010 using the ERA-Interim temperature product.The rationale for using this reanalysis product is detailed in Section 3.
According to ERA-Interim, the climatological annual mean surface temperature averaged over the entire Tibetan Plateau from 1979 to 2010 is -2.5℃, witha maximum of 8.0℃ in July and minimum of -13.4℃in January. The climatological mean surface temperature calculated using the ERA-Interim reanalysisproduct is lower than that calculated from weatherstation observations(Du, 2001) . This difference maybe explained by the higher mean elevation of the surface considered when using ERA-Interim relative tothe elevations of the individual weather stations.
Figure 5 shows interannual variations in the annual, summer, and winter mean surface air temperatures over the Tibetan Plateau, along with their lineartrends. The data shown in this figure are exclusivelyfrom the ERA-Interim surface air temperature product between 1979 and 2010. The interannual variations are consistent with the variations in surface airtemperature before 2000 reported by Du(2001), including the low annual mean temperatures in 1983 and 1997 and the large increase in annual mean temperature between 1997 and 1998. The linear trendin annual mean surface air temperature from 1979to 2010 is 0.33℃ per decade with a 95% confidenceinterval of ±0.14℃ per decade. This rate of temperature increase is larger than that calculated by Du(2001) from 1961 to 2000(0.26℃ per decade), indicating that warming over the Tibetan Plateaumay have accelerated in recent years. The trends insummer(June-July-August) and winter(December-January-February)mean surface air temperature are0.22±0.14 and 0.47±0.33℃ per decade, respectively.These trends are also higher than those reported by Du(2001)based on weather station data over the Tibet(0.16℃ per decade for summer and 0.29℃ per decadefor winter). Our results are also consistent with previous reports of larger warming during winter than during summer over the Tibetan Plateau(Liu and Chen, 2000; Du, 2001) . Relative to the trends reported by Du(2001), our analysis also suggests that the recent acceleration of warming is larger in winter(a difference of 0.18℃ per decade between the two trend estimates)than in summer(0.06℃ per decade). Theincrease in annual mean surface air temperature overTibet over the last 30 years has been much larger thanthe increase in annual mean surface air temperatureaveraged over China(0.22℃ per decade)(Ding et al., 2007) .
 |
| Fig. 5. Interannual variations(solid lines) and linear trends(dashed lines)in(a)annual mean, (b)summer(JJA)mean, and (c)winter(DJF)mean surface air temperature over the Tibetan Plateau from 1979 to 2010 based on theERA-Interim reanalysis product. |
Figure 6 shows spatial distributions of surface airtemperature trends over the Tibetan Plateau. Trendsin annual mean temperature(Fig. 6a)are distributedheterogeneously over the plateau. The maximumtrend(0.61℃ per decade; 95% confidence range excluding zero)is calculated at 34.5°N, 102°E, while theminimum trend(-0.18℃ per decade; 95% confidencerange including zero)is calculated at 37.5°N, 72°E.The largest warming trends(greater than 0.50℃ perdecade; 95% confidence range excluding zero)are located in high altitude regions, such as the Himalayas, the Kunlun and Chilien mountain ranges, and the HohXil region. Trends in summer mean surface air temperature(Fig. 6b)are generally weaker than trendsin annual mean surface air temperature. The oppositeholds for trends in winter mean surface air temperature(Fig. 6c), for which the trends in locations oflarge annual mean warming are greatly enhanced(95%confidence range excluding zero). The trend in wintermean temperature is larger than 0.9℃ per decade overthe Himalayas, larger than 0.6℃ per decade over thelarge area centered on the Kunlun Mountains, largerthan 0.8℃ per decade over the Chilien Mountains, and larger than 0.6℃ per decade over the Hoh Xil. Theheterogeneous distribution of the warming over the Tibetan Plateau therefore appears to be related to thetopography, particularly the giant mountain systems.
 |
| Fig. 6. Spatial distributions of trend(℃(10 yr)-1)in(a)annual mean, (b)summer(JJA)mean, and (c)winter(DJF)mean surface air temperature over the Tibetan Plateau from 1979 to 2010. Shading indicates that the 95% confidenceinterval does not include zero. The thick line(3000-m elevation)denotes the boundary of the plateau. |
We have presented a method for validating reanalysis temperature products over the Tibetan Plateauagainst topography, satellite observation of l and surface temperature, and radiosonde data. We then applied this method to three widely used reanalysis products: NCEP-R2, ERA-Interim, and JRA-25. The validation is performed for the period 1979-2010. Theresults are summarized as follows.
Surface air temperatures from ERA-Interim and JRA-25 are more reliable than that from NCEP-R2 based on all the validation metrics, including expectations based on topography and comparisons withsatellite and radiosonde observations. ERA-Interimperforms better than JRA-25 with respect to expectations based on topography and satellite observations(i.e., metrics that cover the entire plateau). JRA-25 performs slightly better than ERA-Interim withrespect to most of the validation metrics based on radiosonde observations(e.g., absolute errors, RMSEs, and temporal correlations), but slightly worse thanERA-Interim with respect to long-term trends. Thedata used for this validation are taken exclusively atradiosonde stations in the eastern part of the plateau.Accordingly, the validation against radiosonde datamay not accurately reflect the performance of eachreanalysis product over the entire plateau. Overall, we conclude that the ERA-Interim surface air temperature is the most reliable reanalysis data for studyingthe climatology and trends of surface air temperatureover the Tibetan Plateau.
We have analyzed the climatological distribution and trends of surface air temperature over the Tibetan Plateau during the past 30 years based on theERA-Interim reanalysis. The annual mean temperature averaged over the entire Tibetan Plateau(above3000-m elevation)from 1979 to 2010 is -2.5℃, with amaximum plateau-mean temperature of 8.0℃ in July and a minimum of -13.4℃ in January. The TibetanPlateau has experienced dramatic surface warmingover the last 30 years. The linear temperature trendin annual mean temperature from 1979 to 2010 is 0.33±0.14℃ per decade. The warming is much largerin winter(0.47±0.33℃ per decade)than in summer(0.22±0.14℃ per decade). Comparison with previousestimates indicates that the warming over the TibetanPlateau may have accelerated in recent years. Thisacceleration in the warming is much larger in winter than in summer. The spatial distribution of thewarming over the Tibetan Plateau is heterogeneous, possibly due to the influence of the giant mountainsystems.
Acknowledgments: The authors would like toacknowledge the data providers: NOAA/OAR/ESRLPSD for the NCEP-R2 data; ECMWF for the ERA-Interim data; JMA and CRIEPI for the JRA-25 data; China Meteorological Data Sharing Service System forthe radiosonde and surface data; and NOAA/GLOBEfor the topography data. The language editor for thismanuscript is Dr. Jonathon S. Wright.
| Bao, Q., J. Yang, Y. M. Liu, et al., 2010: Roles of anoma-lous Tibetan Plateau warming on the severe 2008 winter storm in central-southern China. Mon. Wea. Rev., 138, 2375-2384. |
| CMDS (China Meteorological Data Sharing Service Sys-tem), 2005a: Instruction of China monthly ra-diosonde dataset. (URL: http://cdc.cma.gov.cn/download/refdoc/UPAR-WEA-CHN-STL-MON-DOCU-C. DOC). (in Chinese) |
| CMDS, 2005b: Instruction of China monthly surface climate dataset. (URL: http://cdc.cma.gov.cn/download/refdoc/SURF-CLI-CHN-MUL-MON-DOCU-C.DOC). (in Chinese) |
| Dee, D. P., S. M. Uppala, A. J. Simmons, et al., 2011: The ERA-Interim reanalysis: Configuration and perfor-mance of the data assimilation system. Quart. J. Roy. Meteor. Soc., 137, 553-597. |
| Ding, Y. H., G. Y. Ren, Z. C. Zhao, et al., 2007: Detec-tion, causes, and projection of climate change over China: An overview of recent progress. Adv. Atmos. Sci., 24(6), 954-971. |
| Du, J., 2001: Change of temperature in Tibetan Plateaufrom 1961 to 2000. Acta Geograph. Sinica, 56, 682-690. (in Chinese) |
| Duan, A. M., and G. X. Wu, 2006: Change of cloud amount and the climate warming on the Tibetan Plateau. Geophys. Res. Lett., 33, L22704, doi:10.1029/2006GL027946. |
| Frauenfeld, O. W., T. J. Zhang, and M. C. Serreze, 2005: Climate change and variability using European Cen-tre for Medium-Range Weather Forecasts reanalysis (ERA-40) temperatures on the Tibetan Plateau. J. Geophys. Res., 110, D02101, doi: 10.1029/2004JD005230. |
| GLOBE Task Team and others, 1999: The Global Land One-kilometer Base Elevation (GLOBE) Dig-ital Elevation Model Version 1. 0. National Oceanic and Atmospheric Administration, National Geo-physical Data Center, 325 Broadway, Boulder, Colorado, USA. Digital database on the World Wide Web (URL: http://www.ngdc.noaa.gov/mgg/topo/globe.html) and CD-ROMs. |
| Kalnay, E., M. Kanamitsu, R. Kistler, et al., 1996: The NCEP/NCAR 40-year reanalysis project. Bull. Amer. Meteor. Soc., 77, 437-471. |
| —-, and M. Cai, 2003: Impact of urbanization and land-use change on climate. Nature, 423, 528-531. |
| Kanamitsu, M., W. Ebisuzaki, J. Woollen, et al., 2002: NCEP-DOE AMIP-II reanalysis (R-2). Bull. Amer. Meteor. Soc., 83, 1631-1643. |
| Kang, S. C., Y. W. Xu, Q. L. You, et al., 2010: Reviewof climate and cryospheric change in the TibetanPlateau. Environ. Res. Lett., 5, doi: 10.1088/1748-9326/5/1/015101. |
| Liu, X. D., and B. D. Chen, 2000: Climatic warming in the Tibetan Plateau during recent decades. Int. J. Climatol., 20, 1729-1742. |
| Ma, L. J., T. J. Zhang, Q. X. Li, et al., 2008: Evalua-tion of ERA-40, NCEP-1, and NCEP-2 reanalysis air temperatures with ground-based measurements in China. J. Geophys. Res., 113, D15115, doi: 10.1029/2007JD009549. |
| Onogi, K., J. Tsutsu, H. Koide, et al., 2007: The JRA-25 reanalysis. J. Meteor. Soc. Japan, 85, 369-432. |
| Shen, S. H., and G. G. Leptoukh, 2011: Estimationof surface air temperature over central and east-ern Eurasia from MODIS land surface temperature. Environ. Res. Lett., 6, 045206, doi: 10.1088/1748-9326/6/4/045206. |
| Tao Shiyan, Chen Lianshou, Xu Xiangde, et al., 1999: Progress of Theoretical Study in the Second Tibetan Plateau Atmosphere Scientific Experiment (Part I). China Meteorological Press, Beijing, 348 pp. (in Chinese) |
| Uppala, S. M., P. W. Kllberg, A. J. Simmons, et al., 2005: The ERA-40 reanalysis. Quart. J. Roy. Me-teor. Soc., 131, 2961-3012. |
| Wan, Z. M., 2008: New refinements and validation of theMODIS land-surface temperature/emissivity prod-ucts. Remote Sens. Environ., 112, 59-74. |
| Wang, A. H., and X. B. Zeng, 2012: Evaluation of multi-reanalysis products with in situ observations over the Tibetan Plateau. J. Geophys. Res., 117, D05102, doi: 10.1029/2011JD016553. |
| Wang, B., Q. Bao, B. Hoskins, et al., 2008: TibetanPlateau warming and precipitation changes in EastAsia. Geophys. Res. Lett., 35, L14702, doi: 10.1029/2008GL034330. |
| Wang, X. L., 2008: Accounting for autocorrelation in de-tecting mean shifts in climate data series using the penalized maximaltor F Test. J. Appl. Meteor. Climatol., 47, 2423-2444. |
| Wei Li and Li Dongliang, 2003: Reliability of NCEP/NCAR reanalysis data in climatic change along Qinghai-Xizang railway. Plateau Meteor., 22, 488-494. (in Chinese) |
| Yanai, M., C. Li, and Z. Song, 1992: Seasonal heating of the Tibetan Plateau and its effects on the evolution of the Asian summer monsoon. J. Meteor. Soc. Japan, 70, 319-351. |
| Ye Duzheng and Gao Youxi, 1979: Meteorology of the Qinghai-Xizang (Tibet) Plateau. Science Press, Bei-jing, 278 pp. (in Chinese) |
| You, Q. L., S. C. Kang, E. Aguilar, et al., 2008: Changes in daily climate extremes in the eastern and cen-tral Tibetan Plateau during 1961-2005. J. Geophys. Res., 113(D7), doi: 10.1029/2007JD009389. |
| —-, K. Fraedrich, G. Y. Ren, et al., 2013: Variability of temperature in the Tibetan Plateau based on ho-mogenized surface stations and reanalysis data. Int. J. Climatol., 33, 1337-1347. |
| Zhao Tianbao, Ai Likun, and Feng Jingming, 2004: An intercomparison between NCEP reanalysis and ob-served data over China. Climatic Environ. Res., 9, 278-294. (in Chinese) |
| Zhao, Y., H. J. Li, A. N. Huang, et al., 2013: Relation-ship between thermal anomalies in Tibetan Plateau and summer dust storm frequency over Tarim basin, China. J. Arid Land, 5(1), 25-31. |
| Zhou, L. M., R. E. Dickinson, Y. H. Tian, et al., 2004: Evidence for a significant urbanization effect on cli-mate in China. Proc. Natl. Acad. Sci. USA, 101, 9540-9544. |
| Zhou Xiuji and Luo Chao, 1994: Ozone valley over theTibetan Plateau. Acta Meteor. Sinica, 8, 505-506. |
| —-, Zhao Ping, Chen Junming, et al., 2009: Impacts of thermodynamic processes over the Tibetan Plateau on the Northern Hemispheric climate. Sci. China (Ser. D), 52(11), 1679-1693. |
| Zhu Wenbin, Lu Aifeng, and Jia Shaofeng, 2013: Esti-mation of daily maximum and minimum air tem-perature using MODIS land surface temperature products. Remote Sens. Environ., 130, 62-73. |
| Zhu Yanfeng, Zhang Bo, and Chen Longxun, 2010: Ther-mal difference between the Tibetan Plateau and the plain east of plateau and its influence on rainfall over China in summer. Chinese Sci. Bull., 55, 1437-1444. |
| Zou Han, 1996: Seasonal variation and trends of TOMSozone over Tibet. Geophys. Res. Lett., 23, 1029-1032. |