 2013, Vol. 27
The Chinese Meteorological Society
Article Information
- WANG Yuan, SONG Jinjie, WU Rongsheng. 2013.
- A New Insight into the Contribution of Environmental Conditions to Tropical Cyclone Activities
- J. Meteor. Res., 27(3): 344-355
- http://dx.doi.org/10.1007/s13351-013-0302-9
-
Article History
- Received November 7, 2012
- in final form January 2, 2013


Tropical cyclones(TCs)are one of the most violentnatural disasters over the world, which often causesevere economic and human losses. It is of high priorityto underst and the mechanisms of their genesis and development, as well as the changes of their activities.As far as the latter is concerned, a number ofstudies have investigated TC activities on interannual and decadal timescales and their long-term trends.In recent years, the possible changes of TC activitiesdue to global warming are intensively discussed(e.g., Emanuel, 2005; Trenberth, 2005; Pielke et al., 2005;Anthes et al., 2006; Hoyos et al., 2006; Holland and Webster, 2007; Vecchi and Knutson, 2008), but thisremains a challenging problem.
Several environmental conditions have been recognizedas favorable for the formation and evolutionof TCs, which include a warm ocean layer of sufficientdepth, above-normal mid-tropospheric relativehumidity, greater than normal low-level relative vorticity, weaker vertical wind shear, etc.(e.g., Gray, 1968, 1988; Merrill, 1988; De Maria, 1996; Emanuel, 1999). In most publications on changes of TC activities, the effect of sea surface temperature(SST)receivesmore attention than other factors(e.g., Bengtsson et al., 1996; Knutson et al., 2001; Webster et al., 2005; Emanuel, 2005; Trenberth, 2005). Furthermore, Hoyos et al.(2006)discussed potential linkages betweenglobal TC intensity and four environmentalvariables, i.e., SST, specific humidity, wind shear, and stretching deformation. Their results indicated thatthe trend of increasing number of categories 4 and 5hurricanes for the period 1970–2004 is directly relatedto the SST trend, while the other three factors influencethe short-term variability of categories 4 and 5hurricanes.
However, three questions remain open after thepublication of Hoyos et al.(2006). Firstly, Hoyos etal.(2006)only linked the change of TC intensity toenvironmental conditions, but they did not considerthe variation of TC annual number(frequency). Frank(1988)indicated that the two phases of TC development, namely, its genesis and intensification, are dominatedby different dynamical and physical processes.Thus, how do these variables influence the genesis and frequency of TCs?
Secondly, TCs over some basins are considered asa whole in Hoyos et al.(2006). The atmospheric conditionsare not the same over different basins. Gray(1968)found that TC activities in different areas havedifferent characteristics. It is quite possible that thecontribution of any environmental variable to TC activitiesin one area is different from that in anotherarea. How is the change of TC activities linked to theenvironmental factors over individual basins?
Finally, the contributions of environmental variablesto the variation of TC frequency and intensityare considered separately in previous studies(e.g., Emanuel, 2005; Hoyos et al., 2006). The behaviors ofTCs are hardly determined by only one factor. Bothformation and evolution of TCs are influenced by twoor more external factors(Gray, 1975; Merrill, 1988).What is the combined effect on the change of TC activitiesof two or many environmental variables?
The above questions are investigated in this paperin order to increase the underst and ing of possiblelinkages between variation of TC activities and changeof environmental conditions. The data and methodologyare described briefly in Section 2. Section 3 discussesthe application of correlation coefficient as atraditional analysis tool. Some results obtained fromanalyses based on the information theory are providedin Section 4. Finally, the concluding remarks are givenin Section 5.2. Data and methodology2.1 Data
The 1970–2009 TC-related data used in this studyare from the best track datasets provided by the NationalHurricane Center(NHC) and the U.S. Joint TyphoonWarning Center(JTWC). The data include locationof storm center and 1-min averaged maximumsustained wind(Vmax)for each cyclone. The TC activitiesincorporate two distinct phases, i.e., frequency and intensity. The frequency refers to the annual numberof TCs with Vmax exceeding 34 kt once or more intheir lifetimes, while the threshold of Vmax for TC intensityis 114 kt.
The environmental variables are derived from themonthly HadISST sea surface temperature with a horizontalresolution of 1°×1°(Rayner et al., 2003) and monthly NCEP/NCAR reanalysis data with a horizontalresolution of 2.5°×2.5°(Kalnay et al., 1996).Referring to some former publications(Gray, 1968;Royer et al., 1998; De Maria et al., 2001; Emanuel and Nolan, 2004; Hoyos et al., 2006), the time seriesof such variables are analyzed as SST, specific humidityin the layer between 925 and 500 hPa, temperaturedifference or instability from the surface to 500 hPa, wind shear between 850 and 200 hPa, 850-hPa zonalstretching deformation, and 850-hPa relative vorticity.The first three variables are thermal variables, and the rest are dynamic variables. The 1970–2009annual values of these variables are computed over seasons and spatially averaged over three basins, i.e., thewestern North Pacific(WNP; 5°–20°N, 120°E–180°)during May–December, North Atlantic(NA; 5°–25°N, 90°–20°W)during June–October, and eastern Pacific(EPA; 5°–25°N, 120°–90°W)during June–October.2.2 Some measurements from the information theory
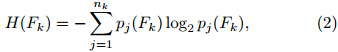
The information theory introduced by Shannon(1948, 1950)is employed to investigate relationshipsbetween TC activities(A) and environmental factors(F)in this work. This approach has already beenapplied in the atmospheric sciences(e.g., Leung and North, 1990; Roulston and Smith, 2002; DelSole, 2004, 2005; Abramov et al., 2005; Balling and Roy, 2004;Hoyos et al., 2006; Naumann and Vargas, 2009). LetA be a discrete variable that may take i = 1, . . ., mpossible values, while Fk may take possible values ofj = 1, . . ., nk(k represents the kth factor). Then, the entropy(H)of individual variables is calculatedas follows:
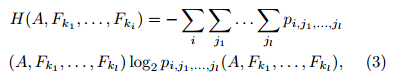
where pi(A)refers to the probability of A taking thevalue of i, and pj(Fk)represents the probability of Fktaking the value of j. The entropy is used to measurethe amount of uncertainty in A(Fk). A greatervalue of entropy means a more unpredictable A(Fk).Furthermore, the joint entropy, which measures theuncertainty associated with a set of variables, is formulated as:where, pi, j1, ..., jl(A, Fk1, . . ., Fkl)is the probability ofthese(l+1)variables taking values of i, k1, . . ., and kl, respectively.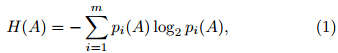
Besides the entropy, another important indexgiven in the information theory is called mutual information(MI), which serves as a quantity that measuresthe mutual dependence of two variables. Formally, theMI of A and Fk can be defined as:
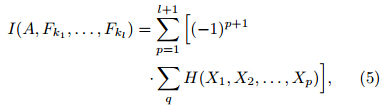
where the three terms at the right h and side are computedfrom Eqs.(1)–(3). The value of I(A, Fk)inunit of bit measures how much knowing Fk reducesthe uncertainty about A. If A and Fk are independent, knowing Fk does not provide any informationabout A, so I(A, Fk)is zero. By contrast, if A and Fkare identical, knowing Fk determines the value of A, and equals the uncertainty of A(H(A)). The greaterthe I(A, Fk), the closer the relationship between A and Fk. Furthermore, serving as a broader generation ofMI, the interaction information is proposed by McGill(1954)to represent the dependence of a set of variablesmore than two. The interaction information iscomputed as:where X1, X2, . . ., Xp refer to any p variables of A, Fk1, . . ., and Fkl, and q equals the number of thewhole possible combinations while selecting p variablesfrom a set of(l+1)variables. Finally, some quantitiessuch as entropy, MI, and interaction information areillustrated in Fig. 1 for cases of two as well as threevariables.
 |
| Fig. 1. Information diagrams for(a)two variables A and Fk and (b)three variables A, Fk1, and Fk2 |
As mentioned above, the quantity of entropy, jointentropy, MI, and interaction information is computedfor discrete variables. On the one h and , althoughthe annual TC frequency and intensity over individualbasins are discrete, some of them include too manycategories if one number is considered as a group.Thus, an optimal number of groups, i.e., 6(≈ 401/2), ischosen based on the law of square-root choice. Then, these 40-yr samples are categorized into 6 equidistantgroups.
On the other h and , time series of the six environmentalfactors are all continuous variables. Theseenvironmental variables should be discretized individuallybefore the computations. It is customary to usethe histogram for this goal. Neighboring values of onevariable are often grouped together in a so-called binto reduce noise effects. The number of bins is also chosenas 6 and each variable is categorized into a rounderlinear fashion to the bins of the histogram.2.4 Significance test of information
When the information is estimated, it is still unclearwhether there exists a significant relationshipamong the set of variables. Therefore, a significancetest needs to be done in order to determine if the calculatedinformation is statistically significant from zero.In this paper, a method applying Monte Carlo techniquesproposed by Pegion et al.(2008)is used toestimate the significance level. The information is recalculatedbetween the annual frequency(intensity)of TC and time series of environmental variables bytaking a different and r and om year for the TC index.Then, this computation is applied ten-thous and times and the values are ordered. When the value for theoriginal information exceeds the 95th percentile, it isstatistically significant from zero, and a notable relationshipexists.3. Distribution of tropical cyclone activities
When the potential relationship between annualTC activities and time series of environmental variablesis investigated, the correlation coefficient is oftencalculated(e.g., Emanuel, 2005; Hoyos et al., 2006).However, the correlation coefficient only indicates thestrength of a linear relationship between two variables.Meanwhile, an important assumption made inthe framework of correlation coefficient is that the twovariables form a bivariate normal distribution population(Anscombe, 1948).
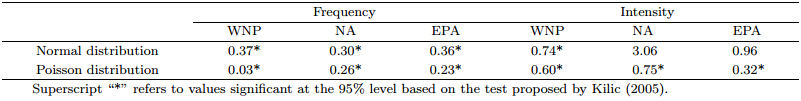
Figure 2 displays the probability distributions ofannual TC frequency and intensity over three basins, while probabilities estimated under the assumptions ofnormal distribution and Poisson distribution are alsogiven. A nonparametric distribution testing methodproposed by Kilic(2005)is used here to evaluate thequality of distribution estimate. Kilic(2005)indicatedthat testing the distribution of a variable could be consideredas a goodness-of-fit problem. Although the twocurves in each panel of Fig. 1 seem to be similar, thefitting errors are different. Generally speaking, the fittingerrors with Poisson distribution are smaller thanthose with normal distribution. This indicates thatthe annual frequency and intensity of TC are more appropriateto be depicted by Poisson distribution. Previousstudies also proposed that some activities of TCwere Poisson distributed(Solow and Nicholls, 1990;Elsner and Schmertmann, 1993; McDonnell and Holbrook, 2004). Note that the annual intensities of TCsover the NA and EPA are not normal distributed and the fitting errors(Table 1)are 3.06% and 0.96%, respectively.Since the assumption of normal distributionis not met, the application of correlation coefficientfails to describe the relationship between TCintensity over the NA or EPA and environmental conditions.
 |
| Fig. 2. Probability histogram of annual tropical cyclone activities in the period of 1970–2009 over the western NorthPacific(A, d), North Atlantic(b, e), and eastern Pacific(c, f). The upper and bottom panels refer to tropical cyclonefrequency and intensity, respectively. Red solid lines represent the estimated probabilities with normal distribution, while blue solid lines refer to the estimated probabilities with Poisson distribution. |
 |
Besides this, the correlation coefficient cannot beused to estimate the relationships in the set of threevariables or more. By contrast, the interaction informationhas the ability to measure the dependence ofany amount of variables. As a result, the MI and interactioninformation are employed to find potentialrelationships among any amount of variables insteadof correlation coefficient.4. Results4.1 Information provided by single environmental variable
The relationships between annual TC activities and individual environmental variables are discussedfirstly, and quantitatively estimated by the MI. Table 2 shows that only a few values of information are significantat the 95% level. Over the NA, either SSTor wind shear provides significant information on TCfrequency, while TC intensity is significantly dependenton wind shear as well as relative vorticity. Overthe EPA, both SST and wind shear give significantinformation on TC frequency. Other environmentalvariables fail to describe TC activities since they givemuch smaller values of information.
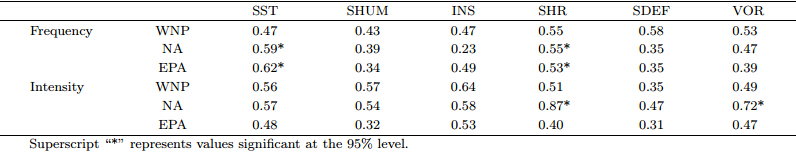 |
Both increasing of SST and decreasing of windshear are favorable for the genesis of TCs over the NA(Fig. 3) and EPA(Fig. 4), and the relationships betweenany of these two variables and TC frequency arenearly linear. The annual variations of TC frequencyover these two basins are primarily determined by SSTor wind shear. Furthermore, the information valueprovided by SST is a bit greater than that given bywind shear. Thus, the annual TC frequency is moredependent on SST than wind shear. This indicatesthat the influence of SST should be considered in thefirst place, and warm water is needed to fuel the heatengine of TCs. Because of the positive relation betweenTC frequency and SST, it is deduced that theTC frequency over the NA and EPA maybe increase ifSST increases. This deduction is consistent with theresult of Webster et al.(2005).
 |
| Fig. 3. Binned distributions of 1970–2009 annual tropical cyclone frequency over the North Atlantic versus time seriesof(a)SST and (b)wind shear between 850 and 200 hPa. Black dashed lines are fitted by the least-square method. |
 |
| Fig. 4. As in Fig. 3, but for the eastern Pacific. |
However, we find no environmental variable providingsignificant information on the occurrence ofTCs over the WNP(see also Table 1). This may suggest that the influence of a single factor is not sufficientenough to contribute to the annual variation of TC frequency.The atmospheric and oceanic conditions overthe WNP have distinctive characteristics. The WNPcontains a large area of water warmer than 26.5℃(threshold value for cyclogenesis), called the westernPacific warm pool. The large-scale atmospheric circulationover the WNP is often determined by the monsoonsystem. Therefore, there are still some argumentson which is the primary factor influencing the genesisof TCs over this area. Some researchers consideredthermal factors as the most important(Sugi et al., 2002; McDonald et al., 2005; Chauvin et al., 2006; Liu et al., 2010)while others thought dynamic variables orlarge-scale circulations played the greatest role(Chan, 2005; Yokoi et al., 2009). In this study, however, wefind that neither thermal nor dynamic variable aloneis notably related to the TC genesis over the WNP.
Webster et al.(2005)presented that the longtermupward trend of TC intensity is associated withincreasing SSTs. The result of this study does notsupport this statement. It can be seen from Table 2that the information provided by SST on TC intensityis not significant over all three basins. Even forthe WNP and EPA, no single environmental variablecontributes notably to TC intensity. Although somestudies pointed out that some favorable atmosphericconditions may lead to a larger number of intense TCsover the WNP(Chan, 2008) and EPA(Lupo et al., 2008), there is no environmental variable by itself thatguarantees an active season of intense TC.
Nonetheless, there do exist two atmospheric variablescontributing significantly to TC intensity overthe NA: wind shear and relative vorticity(Fig. 5 and Table 2). Their values of information(above 0.70 bit)are much larger than those of other factors(below 0.60bit). This suggests that the number of intense TCsover the NA is primarily controlled by the dynamicvariable but not the thermal variable. It is supposedthat when a storm is formed, the influences of thermalvariables become a bit smaller, while the effectsof dynamic variables are dominant during its intensification.When the atmospheric background providessmaller wind shear and /or larger relative vorticity, more intense TCs are expected over the NA.4.2 Information supplied by double environmental variables
Unlike the correlation coefficient, a method fromthe information theory can be used to evaluate thecombined effect of two or more variables on the objectvariable. For example, the joint information(I2)oftwo factors(Fk1 and Fk2)with A is defined by Eqs.(4)–(5) and illustrated in Fig. 1 as:
where I(A, Fk1) and I(A, Fk2)are the MI of two variablesdefined in Eq.(4), while I(A, Fk1, Fk2)is theinteraction information of three factors formulated inEq.(5). The larger the value of I2, the greater thecombined influence of Fk1 and Fk2 .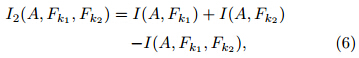
Tables 3, 4, and 5 give the joint information providedby any two environmental variables over differentbasins. It is interesting that there exists no relationshipbetween the value of information and its significancelevel. This is the result of employing MonteCarlo experiments to conduct the significance test, where the significance level is correlated with the distributionof tested variables.
 |
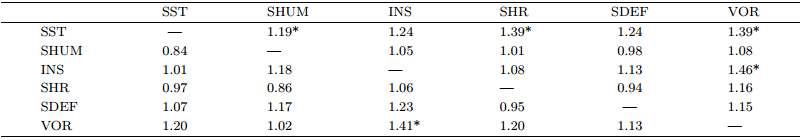
For the NA, since there are some single variablescontributing significantly to TC activities, the joint informationof these variables is thus significant. Thisis confirmed by the notable relations between TC frequency and SST plus wind shear, as well as betweenTC intensity and wind shear plus relative vorticity. Itis thus assumed that all the values of joint informationincluding any one of these factors are ought tobe notable. However, only a few of them are significantin Table 3. Concretely speaking, the TC frequencyis only significantly dependent on the jointinfluences of SST plus specific humidity, wind shearplus stretching deformation, and wind shear plus relativevorticity, while the TC intensity is only notablycorrelated with the joint effects of specific humidityplus wind shear, instability plus wind shear, and windshear plus stretching deformation. This means thatthe contribution of one indistinctively related factorplus one notably related factor is not often significant.This is possibly because of the former destroying theoriginal connection between the latter and TC activities, but not enhancing the relation. Note that theannual variation of TC intensity is remarkably relatedto the joint contribution of SST plus instability(Table 3), which indicates that although the contributions offactors themselves are small, the merged effect can besignificantly large.
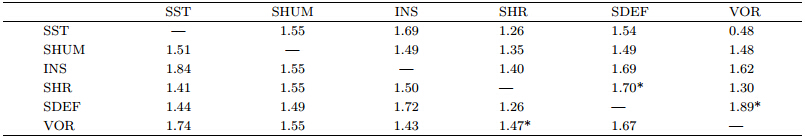
The above deduction is also applicable to the TC frequency over the EPA, which is significantly relatedto the joint influences of SST plus specific humidity, SST plus wind shear, SST plus relative vorticity, and instability plus relative vorticity(Table 4). By contrast, the TC intensity over the EPA is only dependenton the joint effect of instability plus relative vorticity, which gives a value of information of 1.41 bit, muchgreater than others. This implies that the intensificationof TC over the EPA is influenced by these twofactors. When the low-level troposphere is instable(large lapse rate) and associated with positive relativevorticity, a storm tends to intensify and the numberof intense TCs also increases.
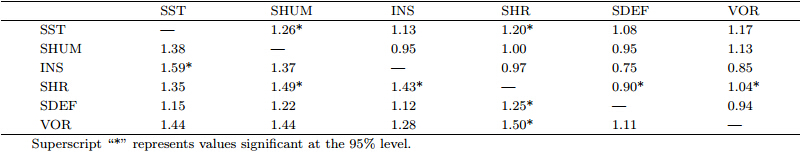
Finally, the TC frequency over the WNP is notablyinfluenced by wind shear plus stretching deformation, or wind shear plus relative vorticity(Table 5). It is inferred that the cyclogenesis over the WNPis primarily determined by dynamic variables but notthermal variables such as SST. This is different fromthe other two basins. Since a warmer atmosphere usually holds more moisture, the thermal conditions forthe genesis of TCs are often satisfied. Therefore, dynamicvariables play a more important role over thisbasin. Similar to TC frequency, the TC intensity isalso dominated by the joint contribution of dynamicvariables. They are wind shear and relative vorticity.The number of intense TCs increases in an atmospherewith lower wind shear and larger relative vorticity.4.3 Information offered by three or more environmental variables
To further discuss the influences of thermal and dynamic variables on TC activities over differentbasins, the joint information(I3)of three contributingvariables is formulated as:
where I(A, Fk1, Fk2, Fk3)is the interaction informationof four variables, and others are the same as in Eq.(6). Here, Fk1, Fk2, and Fk3 refer to the three thermalvariables or the three dynamic variables introduced inSection 2.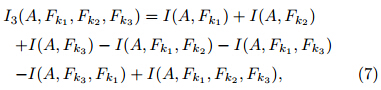
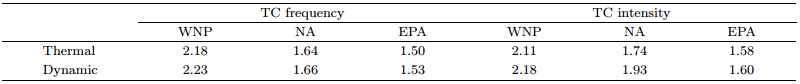
It is displayed in Table 6 that the contributions ofthermal and dynamic variables are generally the sameover the NA and EPA, except for TC intensity overthe NA where dynamic variables dominate. The valuesof joint information are similar. This suggests thatTC activities over these two basins are determined bynot only thermal conditions but also dynamic circumstances.By contrast, the joint information of dynamicvariables is larger than that of thermal variables overthe WNP, indicating that TC activities over the WNPare primarily determined by dynamic conditions.
 |
Furthermore, the joint information of all the sixvariables influencing TC activities is calculated overthe three basins(Table 7). The equation can be derivedfrom Eqs.(6) and (7) and is not given here.It can be seen that the joint information given by allthe variables is the same as the entropy of TC activity, except for TC intensity over the EPA. This seemsto indicate that annual TC activities can be fully describedif time series of all the environmental variablesare already known. However, this statement is questionable, and reasons are given below. The numberof conditions considering different combinations of sixvariables is 66, which far outweighs the number of samples(40). Samples are mapped in only a few of groups, so the information becomes large. Thus, six environmentalvariables are not enough to describe the uncertaintiesof TC activities.
 |
The topic of changed TC activities under globalwarming has drawn more and more attention. Notonly variations of TC activities themselves but alsopossible factors influencing them are explored in manypublications(e.g., Gray, 1968, 1988; Merrill, 1988; DeMaria, 1996; Emanuel, 1999, 2005; Trenberth, 2005;Pielke et al., 2005; Anthes et al., 2006; Hoyos et al., 2006; Holland and Webster, 2007; Vecchi and Knutson, 2008). This study aims at the latter aspect, and quantitatively estimates the contribution of environmentalvariables to TC frequency and intensity, whichare defined as the numbers of tropical storms and categories 4–5 TCs in Saffir-Simpson scale, over thewestern North Pacific, North Atlantic, and easternPacific basins. These environmental factors includethree thermal variables, i.e., SST, specific humiditybetween 925 and 500 hPa, and temperature differenceor instability from the surface to 500 hPa; and threedynamic variables, i.e., wind shear between 850 and 200 hPa, 850-hPa zonal stretching deformation, and 850-hPa relative vorticity.
Unlike other studies, since the annual variationsof TC activities are better fitted by Poisson distributionrather than normal distribution, the methodsfrom the information theory(Shannon, 1948, 1950)areused to investigate the potential relationships betweenTC activities and environmental conditions, instead ofcorrelation coefficient. Based on the information theory, not only the influence of single variable but alsothe joint effect of multivariate factors are considered and then quantitatively estimated in this paper.
The results show that the annual variations ofTC frequency are correlated with both thermal variables and dynamic factors over the NA and EPA.Single variables such as SST and wind shear providesignificant information to the genesis of TCs, so doescombination of the two. The contribution of thermalvariables is considered as large as that of dynamic variables.However, the effect of dynamic variables playsa more important role over the WNP. The combinedinfluence of wind shear and stretching deformationdetermines the change of cyclogenesis.
Furthermore, the TC intensity is influenced bythermal and dynamic variables together over the EP, which includes SST and wind shear. By contrast, the numbers of intense TCs are primarily determinedby dynamic variables over the WNP and NA. Thecontributions of single variables, e.g., wind shear and relative vorticity, as well as the combination of themare significant over the NA. The annual variation ofTC intensity over the WNP is primarily explained bythe joint effect of wind shear and relative vorticity.
In a word, the main factors influencing eitherTC frequency or TC intensity are indeed distinct overdifferent basins. It can be more possibly explainedby the differences of atmospheric conditions and theirchanges in different areas. The influence of dynamicvariables should be paid more attention to in the areassuch as the WNP, where the thermal conditions arealways satisfied. Although the quantitative estimatesof environmental contributions are given in this study, the physical mechanism of these variables affectingTC activities still needs to be further investigated infuture studies.
| [1] | Abramov, R., A. Majda, and R. Kleeman, 2005: Information theory and predictability for low-frequency variability. J. Atmos. Sci., 62(1), 65-87. |
| [2] | Anscombe, F. J., 1948: The validity of comparative experiments. J. Roy. Stat. Soc. (Ser. A), 111(3), 181-211. |
| [3] | Anthes, R. A., R. W. Corell, G. Holland, et al., 2006: Hurricanes and global warming-potential linkages and consequences. Bull. Amer. Meteor. Soc., 87(5), 623-628. |
| [4] | Balling, R. C. Jr., and S. S. Roy, 2004: A spatial entropy analysis of temperature trends in the United States. Geophys. Res. Lett., 31, L09201, doi: 10.1029/2004GL019630. |
| [5] | Bengtsson, L., M. Botzet, and M. Esch, 1996: Will greenhouse-induced warming over the next 50 years lead to higher frequency and greater intensity of hurricanes? Tellus (Ser. A), 48, 57-73. |
| [6] | Chan, J. C. L., 2005: Interannual and interdecadal variations of tropical cyclone activity over the western North Pacific. Meteor. Atmos. Phys., 89(1-4), 143-152. |
| [7] | ——, 2008: Decadal variations of intense typhoon occurrence in the western North Pacific. Proc. Roy. Soc. A, 464(2089), 249-272. |
| [8] | Chauvin, F., J. F. Royer, and M. Déqué#233;, 2006: Response of hurricane-type vortices to global warming as simulated by ARPEGE-Climat at high resolution. Climate Dyn., 27(4), 377-399. |
| [9] | De Maria, M., 1996: The effect of vertical shear on tropical cyclone intensity change. J. Atmos. Sci., 53(14), 2076-2087. |
| [10] | ——, J. A. Knaff, and B. H. Connell, 2001: A tropical cyclone genesis parameter for the tropical Atlantic. Wea. Forecasting, 16(2), 219-233. |
| [11] | DelSole, T., 2004: Predictability and information theory. Part I: Measures of predictability. J. Atmos. Sci., 61(20), 2425-2440. |
| [12] | ——, 2005: Predictability and information theory. Part II: Imperfect forecasts. J. Atmos. Sci., 62(9), 3368-3381. |
| [13] | Elsner, J. B., and C. P. Schmertmann, 1993: Improving extended-range seasonal predictions of intense Atlantic hurricane activity. Wea. Forecasting, 8(3), 345-351. |
| [14] | Emanuel, K., 1999: Thermodynamic control of hurricane intensity. Nature, 401(6754), 665-669. |
| [15] | ——, 2005: Increasing destructiveness of tropical cyclones over the past 30 years. Nature, 436(7051), 686-688. |
| [16] | ——, and D. Nolan, 2004: Tropical cyclone activity and global climate. 26th Conference on Hurricanes and Tropical Meteorology, Amer. Meteor. Soc., Miami, FL, 240-241. |
| [17] | Frank, W., 1988: Tropical cyclone formation. A Global View of Tropical Cyclones. R. Elsberry, Ed., Office of Naval Research, 53-90. |
| [18] | Gray, W. M., 1968: Global view of the origin of tropical disturbances and storms. Mon. Wea. Rev., 96(10), 669-700. |
| [19] | ——, 1975: Tropical Cyclone Genesis. Dept. of Atmos. Sci. Pap. 232, Colorado State Univ., 121 pp. |
| [20] | ——, 1988: Environmental influences on tropical cyclones. Aust. Meteor. Mag., 36, 127-139. |
| [21] | Holland, G. J., and P. J. Webster, 2007: Heightened tropical cyclone activity in the North Atlantic: Natural variability or climate trend? Philos. Transact. A Math. Phys. Eng. Sci., 365(1860), 2695-2716. |
| [22] | Hoyos, C. D., P. A. Agudelo, P. J. Webster, et al., 2006: Deconvolution of the factors contributing to the increase in global hurricane intensity. Science, 312(5770), 94-97. |
| [23] | Kalnay, E., M. Kanamitsu, R. Kistler, et al., 1996: The NCEP/NCAR 40-year reanalysis project. Bull. Amer. Meteor. Soc., 77(3), 437-471. |
| [24] | Kilic, E., 2005: A nonparametric way of distribution testing. Econometrics, 0510006, EconWPA. |
| [25] | Knutson, T. R., R. E. Tuleya, W. X. Shen, et al., 2001: Impact of CO2-induced warming on hurricane intensities simulated in a hurricane model with ocean coupling. J. Climate, 14(11), 2458-2468. |
| [26] | Leung, L. Y., and G. R. North, 1990: Information theory and climate prediction. J. Climate, 3(1), 5-14. |
| [27] | Liu, C. J., L. P. Ma, Y. Liu, et al., 2010: Linking tropical cyclone number over the western North Pacific with sea surface temperatures. Hurricanes and Climate Change. J. Elsner, et al., Eds., Springer, 205-215. |
| [28] | Lupo, A. R., T. K. Latham, T. H. Magill, et al., 2008: The interannual variability of hurricane activity in the Atlantic and East Pacific regions. Natl. Wea. Dig., 32, 11-33. |
| [29] | McDonald, R. E., D. G. Bleaken, D. R. Creswell, et al., 2005: Tropical storms: Representation and diagnosis in climate models and the impacts of climate change. Climate Dyn., 25(1), 19-36. |
| [30] | McDonnell, K. A., and N. J. Holbrook, 2004: A Poisson regression model of tropical cyclogenesis for the Australian-Southwest Pacific ocean region. Wea. Forecasting, 19(2), 440-455. |
| [31] | McGill, W. J., 1954: Multivariate information transmission. Psychometrika, 19(2), 97-116. |
| [32] | Merrill, R. T., 1988: Environmental influences on hurricane intensification. J. Atmos. Sci., 45(11), 1678-1687. |
| [33] | Naumann, G., and W. M. Vargas, 2009: Changes in the predictability of the daily thermal structure in southern South America using information theory. Geophys. Res. Lett., 36, L09704, doi: 10.1029/2009GL037576. |
| [34] | Pegion, K., P. Pegion, T. Selsole, et al., 2008: Subseasonal variability of hurricane activity. Climate Test Bed Joint Seminar Series. NCEP, Camp Springs, Maryland, December 10, 2008. |
| [35] | Pielke, R. A. Jr., C. Landsea, M. Mayfield, et al., 2005: Hurricanes and global warming. Bull. Amer. Meteor. Soc., 86(11), 1571-1575, doi: 10.1175/BAMS-86-11-1571. |
| [36] | Rayner, N. A., D. E. Parker, E. B. Horton, et al., 2003: Global analyses of sea surface temperature, sea ice, and night marine air temperature since the late nineteenth century. J. Geophys. Res., 108(D14), 4407, doi: 10.1029/2002JD002670. |
| [37] | Roulston, M. S., and L. A. Smith, 2002: Evaluating probabilistic forecasts using information theory. Mon. Wea. Rev., 130(6), 1653-1660. |
| [38] | Royer, J. F., F. Chauvin, B. Timbal, et al., 1998: A GCM study of the impact of greenhouse gas increase on the frequency of occurrence of tropical cyclones. Climatic Change, 38(3), 307-343. |
| [39] | Shannon, C. E., 1948: A mathematical theory of communication. Bell Syst. Tech. J., 27, 379-423, 623-656. |
| [40] | ——, 1950: Prediction and entropy of printed English. Bell Syst. Tech. J., 30, 50-64. |
| [41] | Solow, A., and N. Nicholls, 1990: The relationship between the southern oscillation and tropical cyclone frequency in the Australian region. J. Climate, 3(10), 1097-1101. |
| [42] | Sugi, M., A. Noda, and N. Sato, 2002: Influence of the global warming on tropical cyclone climatology: An experiment with the JMA global model. J. Meteor. Soc. Japan, 80(2), 249-272. |
| [43] | Trenberth, K., 2005: Uncertainty in hurricanes and global warming. Science, 308(5729), 1753-1754. |
| [44] | Vecchi, G. A., and T. R. Knutson, 2008: On estimates of historical North Atlantic tropical cyclone activity. J. Climate, 21(14), 3580-3600. |
| [45] | Webster, P. J., G. J. Holland, J. A. Curry, et al., 2005: Changes in tropical cyclone number, duration, and intensity in a warming environment. Science, 309(5742), 1844-1846. |
| [46] | Yokoi, S., Y. N. Takayabu, and J. C. L. Chan, 2009: Tropical cyclone genesis frequency over the western North Pacific simulated in medium-resolution coupled general circulation models. Climate Dyn., 33(5), 665-683. |