 2013, Vol. 27
The Chinese Meteorological Society
Article Information
- FEI Jianfang, DING Juli, HUANG Xiaogang, CHENG Xiaoping, HU Xiaohua. 2013.
- Numerical Study on the Impacts of the Bogus Data Assimilation and Sea Spray Parameterization on Typhoon Ducts
- J. Meteor. Res., 27(3): 308-321
- http://dx.doi.org/10.1007/s13351-013-0303-8
-
Article History
- Received September 24, 2012
- in final form March 4, 2013


2 Mailbox 5111, Beijing 100081
The results show that typhoon ducts are likely to form in every direction around the typhoon center, with the main type of ducts being elevated duct. With the BDA scheme included in the model initialization, the model has a better performance in predicting the existence, distribution, and strength of typhoon ducts. This improvement is attributed to the positive effect of the BDA scheme on the typhoon’s ambient boundary layer structure.
Sea spray affects typhoon ducts mainly by changing the latent heat (LH) flux at the air-sea interface beyond 270 km from the typhoon center. The strength of the typhoon duct is enhanced when the boundary layer under this duct is cooled and moistened by the sea spray; otherwise, the typhoon duct is weakened. The sea spray induced changes in the air-sea sensible heat (SH) flux and LH flux are concentrated in the maximum wind speed area near the typhoon center, and the changes are significantly weakened with the increase of the radial range.
It has long been recognized that accurate predictionsof electromagnetic(EM)wave propagation in theatmosphere require a knowledge of modified refractivity(M; in unit of M)profiles(Dockery,1988), and themodified refractivity M is related to the atmospherictemperature(T; K),partial pressure of water vapor(e;hPa),atmospheric pressure(P; hPa), and the altitude(z; m)above surface(Bean and Dutton, 1968):
The four refraction regimes,i.e.,subrefraction,normalrefraction,superrefraction, and trapping,are eachcharacterized by a range ofM slope values. Ducting orEM trapping occurs when dM/dz < 0,which is oftenassociated with sharp decrease of moisture and temperatureinversion. Following the definition of Turtonet al.(1988),a trapping layer is located inside and at the top of a duct. The duct is defined as the layerin which M is higher than the minimum value at thetop of the trapping layer,thus the ducting layer canbe thicker than the trapping layer. Trapping layers and ducts are easily identified from the vertical profilesof M. Figure 1 shows the idealized M profiles forseveral main types of ducts: surface duct(includingsimple surface duct and S-shaped surface duct),elevatedduct, and evaporation duct. Surface duct refersto all ducts that extend down to the l and or sea surface, and evaporation duct is actually a subset of thesurface duct,which forms just above the sea surfacewith strong vertical humidity gradient(Cook,1991).Of course,real M profiles can be a combination ofthese main types,with multiple ducts coexisting atdifferent levels or several trapping layers inside a sameduct(Mesnard and Sauvageot, 2010).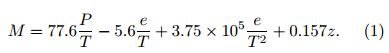
 |
| Fig. 1. Typical modified refractivity M profiles for(a)simple surface duct,(b)S-shaped surface duct,(c)elevated duct, and (d)evaporation duct(from Atkinson et al., 2001). |
Pan et al.(1996)pointed out that the western and northwestern fringes of a typhoon and the typhooneye are the favorable places for duct formation. Thisis because typhoons over the western North Pacific(WNP)usually move around the edge of the subtropicalhigh,where subsidence inversion often appears, and the flows at the western and northwestern fringesof typhoons transport sufficient water vapor under theinversion,while the existence of this inversion inhibitsthe upward transfer of water vapor,yielding a sharpgradient of moisture. They also indicated that elevatedduct layers are likely to form beyond a distanceof 1100 km from typhoon centers,whereas those generatedin the typhoon eye are usually at the altitudeof about 800 m. In October 1997,an experiment wascarried out by the China Research Institute of RadioWave Propagation(CRIRWP)for a month,to explorethe tropospheric duct structure on the southeasterncoast of China. Based on the observationsfrom this experiment,Liu et al.(2002)reported increasedduct frequency on the western periphery ofthe tropical cyclones(TCs). The associated ductsare usually referred to as TC-Ducts or typhoon ducts,which are likely to form on the periphery of a typhoon and its eye,instead of in the inner core area whereintense convection makes temperature and moisturefully mixed,which is disadvantageous to the formationof temperature inversion and ducts. Chang and Lin(2011)analyzed an unusual radar abnormal propagation(AP)phenomenon associated with foehn windsinduced by Typhoon Krosa(2007), and found thatsubsidence warming generated by downslope winds induceda temperature inversion above the surface and caused the ducting of radar beams.
Despite the above studies,the occurrence of typhoonducts is still not well documented,since theprevious studies are usually based on conventional radiosondedata over l and . The coarse vertical resolutionof the radiosonde data may smooth out some ductinglayers and broaden the thickness of ducts. Moreover,these data are usually obtained over l and . The surveyof typhoon ducts over oceanic areas is incompletebecause the information about ducts in or around typhoonsover the sea is unavailable. Owing to the implementationof the “Dropsonde Observation for TyphoonSurveillance near the Taiwan Region(DOTSTAR)”program,more refined structures of temperature and humidity profiles with vertical resolutionsof about 5–6 M are revealed through using the globalpositioning system(GPS)dropsondes in or around typhoons.The DOTSTAR program provides a strongdatabase for studies on the occurrence and structureof typhoon ducts over the sea. Ding et al.(2013)showthat typhoon ducts are likely to form in all directionsaround the typhoon center,with an average distanceof about 412.8 km from the center; they occur morefrequently and are much stronger in southwest and northwest directions than in the other directions; withthe increase of typhoon intensity,the associated ductsinside typhoons tend to be much stronger and thicker and to appear at higher altitudes. But the followingproblems remain: the GPS dropsonde data are gatheredfrom single point observations with a coarse spatialresolution, and their deployments are somewhatr and om relative to the typhoon center; besides,thetemporal continuity of the dropsonde observations islimited since one research flight can only last for 3 hor so.
Therefore,it is of great necessity to carry out numericalsimulations of typhoon ducts using mesoscalenumerical prediction models. Related numerical simulationscan also provide early warning for wide-range and long-term typhoon ducts, and help further analyzeduct formation causes. Similar studies wereconducted by Hu et al.(2007)using the AdvancedRegional Prediction System(ARPS)to simulate aducting process induced by Typhoon Rusa(2002), by Cheng(2009)using the fifth-generation PennsylvaniaState University/National Center for Atmospheric ResearchMesoscale Model MM5 to simulate a typhoonduct case induced by Typhoon Rammasun(2008), and by Liu et al.(2012)using the Weather Research and Forecasting(WRF)model to investigate the cause oftyphoon ducts induced by Typhoon Rusa(2002). It isworth noting that these studies focused on the ductson the west side of the related typhoons, and did notconsider the effect of typhoon intensity.
Our previous study(Ding et al., 2013)indicatesthat the distribution of typhoon ducts is linked withthe variation of typhoon intensity. Therefore,we speculatethat improving the simulation of typhoon intensityis conducive to the simulation of typhoon ducts.The bogus data assimilation(BDA)scheme(Xiao et al., 2000; Zou and Xiao, 2000)is recognized to be advantageousto simulation of typhoon intensity. In addition,under high wind conditions such as typhoon,sea spray generated by wave breaking and air bubblesmay release spray sensible and latent heat fluxes tothe environmental atmosphere,changing the ambienttemperature and humidity profiles,as well as the atmosphericrefraction field and ambient duct structure.The influences of the BDA and sea spray parameterization(SSP)on typhoon ducts remain a topic thatneeds a further numerical study.
This paper is arranged as follows. Overview ofthe selected typhoon duct case is provided in Section2. Model configuration and design of numerical experimentsare presented in Section 3. The impacts ofthe BDA and SSP on typhoon ducts are discussed inSection 4. A summary and conclusions are given inSection 5.2. Overview of typhoon ducts2.1 Typhoon Mindule
Mindule was formed as a tropical storm(TS)tothe east of the Philippines over the western North Pacific(WNP)at 0600 UTC 23 June 2004. It movedwestward and strengthened gradually to a severe tropicalstorm(STS)at 0600 UTC 24 June,then it keptmoving westward and strengthened as a typhoon(TY)at 1200 UTC 27 June with the moving direction changingto northwestward, and it quickly strengthened toa severe typhoon(STY)at 0000 UTC 28 June. Mindulereached its peak intensity at 0000 UTC 29 Junewith minimum central pressure of 940 hPa and maximumsustained wind speed of 49 M s−1 based on thebest track data provided by the Japan MeteorologicalAgency(JMA), and the peak intensity lasted for 12h. After that,Mindule gradually weakened and madea sudden reversal to northward when moving into theBass Strait(122°E). At 0230 UTC 1 July,it l and ed inHualian,Taiwan Region, and then moved to the southof the East China Sea with its intensity weakened toSTS after it traversed the Taiwan Isl and . At 0130UTC 3 July,it l and ed in Leqing,Zhejiang Province, and then moved northward along the coastlines. Aftertransferring to the Zhoushan sea area,it movednortheastward with accelerated speed and weakenedintensity. At 0000 UTC 4 July,it became a tropicaldepression and gradually dissipated. Details of theMindule’s track can be found in Fig. 2a.
 |
| Fig. 2.(a)The best track of Typhoon Mindule (2004) from the JMA data and the model domain configuration.(b)Thedropsonde deployment around Mindule as well as the observed duct locations. The typhoon symbol indicates positionof the typhoon center. Solid circles indicate dropsonde-derived duct positions with tops less than 1000 m; solid paneindicate duct positions with tops between 1000 and 2000 m; hollow circles with a vertical line in the center indicate ductpositions with tops above 2000 m. Black symbolizes strong duct(δM > 10 M; δM is duct strength); gray symbolizesmoderate duct(5 M <M ≤ 10 M); shallow gray symbolizes weak duct(δM ≤ 5 M). Plus signs indicate the positions ofdropsondes with no duct observed. |
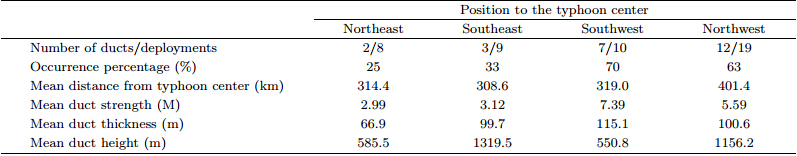
From 1036 UTC 27 to 1252 UTC 29 June(Fig. 2b),the DOTSTAR program carried out 3 researchflights(once a day at 1200 UTC or so) and deployed47 GPS dropsondes to investigate Typhoon Mindule (2004) ,of which one dropsonde records are invalid and discarded. Twenty-four cases in the total 46 dropsondesshow ducting conditions with its strength largerthan or equal to 2 M,among which 10 cases exhibitmultiple ducts. Details of the statistical results areshown in Table 1. Note that for profiles with multipleducting layers,only the strongest ducts are retained.
 |
The numerical model and data used in this studyare the Advanced Research WRF(ARW)version 3.2 and the 1°×1° NCEP global final analysis at 6-h intervals.The TC best track data provided by the JMAare also used. The WRF model uses fully compressible,Eulerian nonhydrostatic equations with a massvertical coordinate. The horizontal resolutions of thetwo domains are 27(D01) and 9 km(D02)with a twowaynesting, and the grid dimensions are 226×179 and 247×205,respectively(as shown in Fig. 2a). Thereare 49 vertical levels for each domain and the verticalspacing increases with height so as to ensure goodresolutions at low altitudes. Specifically,there are 23levels in the planetary boundary layer(PBL)with resolutionof about 15 M at the lowest levels for refinedcapture of the M profile. The MM5 surface layer(SL)scheme is used in conjunction with the Yonsei University(YSU)(Hong et al., 2006)PBL parameterization.The other physical parameterizations used inthis study include the Lin microphysics scheme(Lin et al., 1983; Rutledge and Hobbs, 1984),Noah l and surfacemodel(LSM)described by Chen and Dudhia(2001),Kain-Fritsch(KF)scheme(Kain,2004;Kain and Fritsch, 1990)for cumulus parameterization,Rapid Radiative TransferModel(RRTM)for longwaveradiative flux computations(Mlawer et al., 1997), and Dudhia scheme(Dudhia,1989)for shortwaveradiation.
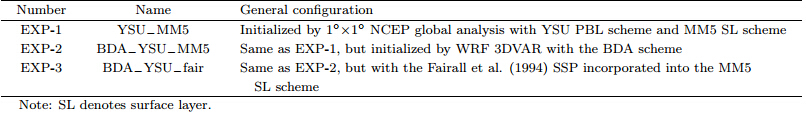
In this study,three numerical experiments(seeTable 2)were designed to evaluate impacts of the BDA and SSP on the ducting process induced by TyphoonMindule(2004). All the experiments were initializedat 1200 UTC 26 June 2004 and ended at 1200 UTC29 June 2004. During this period,the DOTSTARprogram carried out a three-day observation for TyphoonMindule(2004),providing valuable measurementsto verify the model results. EXP-1 was initializedwith 1°×1° NCEP global final analysis datawith the above physical parameterizations. The configurationof EXP-2 is the same as that of EXP-1,except that the EXP-2 initialization used the WRFthree-dimensional variational(3DVAR)data assimilationsystem with the BDA scheme(Xiao et al., 2008).The BDA scheme was only applied to the coarse gridD01. For D02,all the variables were interpolated fromthose of D01. The background error covariance wascalculated from 1-month statistics during 12 June–12 July 2004 using the NMC(National MeteorologicalCenter)method(Parrish and Derber, 1992). Toevaluate the impact of sea spray on typhoon ducts,EXP-3 was conducted,in which the surface interfacialfluxes were calculated from st and ard MM5 SL schemein WRF v3.2,whereas the sea spray fluxes were computedby the Fairall parameterization scheme(Fairall et al., 1994). More details were given in Zheng et al.(2008). Since the combination of WRF 3DVAR and the BDA scheme can potentially greatly improve thetyphoon intensity forecast,this combination was retainedin EXP-3.
According to the JMA best track data,TyphoonMindule (2004) was strengthening during 1200 UTC26–1200 UTC 29 June, and after 1200 UTC 29 June,it started to weaken. As shown in Fig. 3a,both thestrengthening process and the late weakening trendof Typhoon Mindule were successfully simulated byEXP-1 and EXP-2. In the first 42 h,EXP-1 failedto predict the minimum sea level pressure(MSLP)with its prediction much weaker than the observation,due to the lack of the bogus vortex assimilation in themodel initial field; but after 48 h,the predicted MSLPbecame much closer to the observation. In comparison,EXP-2 with the BDA scheme in the initializationsuccessfully improved the MSLP prediction in the first36 h, and the predicted MSLP became a little strongerthan the observation in the late period of integration,but the weakening trend of Typhoon Mindule was stillwell captured.
 |
| Fig. 3. Time series of(a)minimum sea level pressure(hPa) and (b)maximum 10-m wind speed(m s−1)for TyphoonMindule(2004)from EXP-1 and EXP-2. |
In addition to the MSLP,the maximum 10-mwind speed is also used to reflect the typhoon intensity.Figure 3b shows that both experiments are able tosimulate the strengthening,maintenance, and the lateweakening of Typhoon Mindule,but EXP-2 with theBDA scheme achieved an overall better performancein predicting the maximum 10-m wind speed.4.1.2 Distribution of typhoon ducts
To evaluate how the improved typhoon intensityaffects the prediction of typhoon ducts,we first comparethe simulated distributions of typhoon ducts withthe dropsonde measurements at 1200 UTC 27 June,when the predicted typhoon intensity from EXP-2 wasclosest to the observation(Fig. 3). Note that,sincethe duct with strength less than 2 M may have littleimpact on EM propagation,in this study,only thosewith strength larger than or equal to 2 M are considered.As shown in Figs. 4a and 4b,typhoon ductsare likely to form in every direction around the typhooncenter,with the main type of ducts being elevatedduct. In addition,improved typhoon intensitysimulation by use of the BDA in the initializationhas a great impact on the typhoon duct distributions.At 1200 UTC 27 June(24-h integration),thesimulated elevated ducts from both experiments werewidely distributed beyond a 300–500 km radius fromthe typhoon center,whereas the inner boundary ofducts from EXP-2 was more arc-shaped,with a widerduct coverage in the Bass Strait and the northeastside of the Philippines. The empty circles in Fig. 4indicate dropsonde-derived elevated ducts whereas thesolid ones indicate the simulated elevated ducts. Obviously,the simulated distribution of typhoon ductsfrom EXP-2 is much closer to the observation thanthat from EXP-1. This means that improved typhoonintensity forecast by the BDA scheme is favorable tothe prediction of typhoon duct distributions.
 |
| Fig. 4. Horizontal distributions of the simulated(a,b)duct type,(c,d)duct strength in M, and (e,f)duct height in m,from(a,c,e)EXP-1 and (b,d,f)EXP-2 at 1200 UTC 27 June. The typhoon symbol indicates position of the typhooncenter; empty circles indicate dropsonde-derived elevated duct positions while solid circles indicate the dropsonde-derivedmultiple elevated ducts. |
The simulated duct strength and duct height fromEXP-1 and EXP-2 are shown in Figs. 4c–4f. It is evidentthat the simulated ducts with strength largerthan 2 M have a wider coverage by introducing theBDA scheme,with their tops at lower altitudes. Butwith increased distance from the typhoon center,theimpacts of the BDA scheme on the simulated ductproperties tend to be less effective. It is importantto note that,the simulated surface ducts to the south and east of the typhoon center are actually evaporationducts,which seem not very reliable and are leftundiscussed,due to the still poor vertical resolution ofthe model in the surface layer.4.1.3 Duct structure
As shown in Fig. 5,improved typhoon intensitysimulation by the BDA scheme can also exert a positiveeffect on the typhoon duct structure. Especially,in Figs. 5a and 5e,EXP-1 failed to simulate the existenceof two ducts,but EXP-2 managed to successfullyproduce them. In Figs. 5b–5d,though both experimentssimulated the existence of three ducts,theduct strength simulated by EXP-2 was much closerto the observation. This implies that better typhoonintensity simulation by the BDA scheme is also importantfor correct simulation of typhoon duct structures.Thus,improving typhoon intensity forecast bythe BDA scheme is beneficial to not only distribution(see Section 4.1.2)but also structure forecasts of typhoonducts.
 |
| Fig. 5. Vertical profiles of modified refractivity from EXP-1 and EXP-2 versus the GPS dropsonde measurements. |
However,there are still some differences betweenthe model results and the observations,which maybe associated with the following reasons. First,thetemperature and humidity profiles of the PBL cannotbe properly resolved in the model initialization,especiallyover the sea. Second,the model results arerespectively after 23-,24-,26-,47-, and 71-h integrationwhen model errors have been introduced in theintegration process. Third,the observations are of amuch higher vertical resolution. Despite these disadvantages,the forecasting capability of the WRF v3.2model on typhoon ducts is encouraging.4.2 Impact of sea spray4.2.1 Typhoon intensity
Figure 6 gives comparison of Mindule’s simulatedintensity from EXP-2 and EXP-3 and the JMA besttrack data. It can be seen that in the first 36 h of thesimulation,the simulated MSLP and maximum 10-mwind speed are very close to the observations in differentexperiments,with and without sea spray. Thisis mainly because Mindule is still a little weak thoughit is gradually strengthening. After 36 h,the impactsof sea spray are significantly enhanced with the developmentof Mindule,resulting in increased air-sea fluxexchange and causing the typhoon system to furtherstrengthen with accelerated wind speed. In the final36 h of the simulation,the average reduction of MSLPis 3.8 hPa after taking into account the effect of seaspray,whereas the maximum 10-m wind speed is increasedby 2.5 M s−1 on average.
 |
| Fig. 6. As in Fig. 3,but for EXP-2 and EXP-3 versus the JMA best track data. |
 |
| Fig. 7. As in Fig. 4,but for EXP-2 and EXP-3 at 1200 UTC 28 June. Plus signs indicate multiple ducts composed ofsurface duct and elevated duct; other symbols are the same as in Fig. 4. |
To further investigate the effect of sea spray ontyphoon duct structure,the M profiles from EXP-2 and EXP-3 together with the GPS dropsonde measurementsare compared in Fig. 8. It is shown thatsea spray mainly affects the duct strength and thickness,but the effects are not significant. The sea sprayeffects may cause typhoon duct to strengthen and canalso cause it to weaken.
 |
| Fig. 8. As in Fig. 5,but for EXP-2 and EXP-3 versus the GPS dropsonde measurements. |
The above analyses lead to a preliminary conclusionthat sea spray exerts a certain impact on the distribution and structure of typhoon duct,but its impactis not significant,which turns out to be different fromour expectation and inspires us to further analyze theunderlying reason.
In a mesoscale numerical model,sea spray participatesin the air-sea interactions by the form of spraysensible and latent heat fluxes. To reveal the impactof sea spray on surface sensible and latent heatfluxes as well as its influence area,we analyze the distributionsof enthalpy flux and 10-m wind speed within360 km around the typhoon center,with and withoutsea spray,at 1200 UTC 28 June(Fig. 9),togetherwith the radial distribution of azimuthally averagedheat flux difference,including sensible heat(SH),latentheat(LH), and enthalpy(EH)fluxes(Fig. 10).As shown in Fig. 9,the differences of wind speed and enthalpy flux,with and without sea spray,are concentratedat the maximum wind speed area near thetyphoon center. After taking into account of seaspray’s contribution,the large heat flux area(greaterthan 1600 W m−2) and the maximum wind region(more than 45 M s−1)from EXP-3 are enlarged significantlyaround the typhoon center. The maximalenthalpy flux and 10-m wind speed are increased byabout 300Wm−2 and 5 M s−1 in EXP-3,respectively,compared to those in EXP-2 without sea spray.
 |
| Fig. 9. Distributions of enthalpy flux(shaded; W m−2) and 10-m wind speed(contour; m s−1)within 360 km aroundthe typhoon center from(a)EXP-2 and (b)EXP-3 at 1200 UTC 28 June. Note that the center of each panel indicatesthe typhoon center. |
 |
| Fig. 10. Radial distribution of the azimuthally averagedsensible heat(SH),latent heat(LH), and enthalpy(EH)flux differences(EXP-3 minus EXP-2)at 1200 UTC 28June. |
The influence range of sea spray is explicitlyshown in Fig. 10. We can see that the impacts of seaspray are significant at 1200 UTC 28 June,especiallyin the maximum wind speed area(about 90 km awayfrom the typhoon center)where surface heat fluxes aresignificantly enhanced by sea spray with the maximalincrease up to 300 W m−2 or so,in which latent heatflux has made a major contribution. It is also foundthat the impacts of sea spray are significantly weakenedwith the increase of radial distance. Specifically,the influence range of sea spray on sensible heat fluxis 270 km or so,but it is extended to about 630 kmfor latent heat flux.
Therefore,beyond 270 km from the TC center,sea spray affects the distribution and structure of typhoonducts mainly by changing the latent heat flux atthe air-sea interface,which changes the upward transportof heat and moisture,resulting the changes oftemperature and humidity structures in the boundarylayer. However,the impacts of sea spray on airseaheat flux are concentrated at the maximum windspeed area near the typhoon center; with the increaseof radial range,the effects are significantly weakened.This is the main reason why the impacts of sea sprayon typhoon ducts are not very obvious.
Here,a case study is carried out to further investigatehow sea spray impacts the characteristics of typhoonducts. Taking the duct event located at 18.6°N,120.3°E about 285 km southwest of the typhoon centerat 1049 UTC 29 June(see Fig. 8e)for instance,thesimulated elevated duct is enhanced from 7.5(withoutsea spray)to 12.7 M(with sea spray), and the latteris much closer to the observation. Note,for this case,the impacts of sea spray on duct thickness and heightare insignificant.
To investigate how sea spray enhances the ductstrength,we analyze the azimuthally averaged heatflux differences and the boundary layer water vapor and potential temperature differences(EXP-3 minusEXP-2),with(EXP-3) and without(EXP-2)sea sprayduring 66–72-h integration,since 1049 UTC 29 Juneis just within this period and the feedbacks of sensible and latent heat fluxes to the ambient environment mayneed a response time. Here,we emphasize the area beyond270 km from the typhoon center,because in thiscase the duct is located at 285 km away southwest ofthe TC center. As shown in Fig. 11,the average contributionof sea spray to latent heat flux is only 20.4Wm−2 in the range 270–360 km from the typhoon center,whereas the average contribution to sensible heatflux within this range is nearly zero. Therefore,theimpacts of sea spray on the boundary layer temperature and humidity are very weak with the maximumdifference of only ±0.1. It is noteworthy that the atmosphereabove the altitude of 700–1000 M about 270km away from the typhoon center is warm and dry,considering the spray effects; whereas the atmosphereunder this level is cool and moist,resulting in an intensificationof temperature inversion and a sharperdecrease of moisture with height there. This is the directreason for sea spray to enhance the duct strength.The simulated water vapor mixing ratio and potentialtemperature profiles for this duct case with(EXP-3) and without(EXP-2)sea spray are compared in Fig. 12,which also verifies the above analysis.
 |
| Fig. 11.(a)Radial distribution of the azimuthally averaged heat flux difference; and radial-vertical cross-sections ofthe azimuthally averaged differences(EXP-3 minus EXP-2)of(b)water vapor mixing ratio(g kg−1) and (c)potentialtemperature(K)during 66–72 h. |
 |
| Fig. 12. Profiles of(a)water vapor mixing ratio(g kg−1) and (b)potential temperature(K)at 18.6°N,120.3° E from EXP-2 and EXP-3 at 1100 UTC 29 June. |
Note that the effect of sea spray is generally tomoisten the boundary layer,but its impact on temperaturedepends on the total amount of spray and the relative position of spray to the typhoon center(Gall et al., 2008). The typhoon duct may be enhancedif the boundary layer under this duct is cooled and moistened by sea spray,otherwise it may be weakened.5. Conclusions and discussion
A ducting process induced by Typhoon Mindule (2004) was simulated with the WRF model(version3.2). The impacts of the bogus data assimilation(BDA)scheme and sea spray parameterization(SSP)on the simulation of typhoon ducts were analyzed.The results show that typhoon ducts are likely toform in every direction around the typhoon center,with the main type of ducts being elevated duct. Improvedtyphoon intensity forecast by the BDA schemefavors the correct simulation of duct structure and distribution. Sea spray affects typhoon ducts beyond270 km from typhoon center mainly by changing thelatent heat flux at the air-sea interface,which consequentlychanges the upward transport of heat and moisture,resulting in the changes of temperature and humidity structures in the boundary layer. Generally,the effect of sea spray is to moisten the boundarylayer,but its influence on temperature depends onthe total amount of spray and the relative position ofspray to the typhoon center. If the boundary layeris cooled and moistened by sea spray,the typhoonduct strength may be enhanced,otherwise it maybe weakened. However,the impacts of sea spray ontyphoon duct are not very obvious,because the seaspray impacts on air-sea heat flux are concentratedin the maximum wind speed area near the typhooncenter,with the increase of radial range,the impactsare significantly weakened.
Our previous study(Ding et al., 2013)shows thatthe distribution of typhoon ducts is associated withthe variation of typhoon intensity. The present studyhas further revealed that improved typhoon intensityforecast by the BDA scheme can exert a positive effecton typhoon duct simulation.By comparing the model results to the GPS dropsondeobservations,we find that the WRF v3.2 indeedhas the capability of forecasting typhoon duct distribution and structure,but it becomes less capablefor stronger TCs,especially when the ducts are closeto the typhoon center. This is one of the most challengingproblems for typhoon duct forecasting and research, and our future study will be targeted alongthis direction.
Acknowledgments. The authors wish to thankProfessor Wu Junjie and others in “DOTSTAR” forproviding the GPS dropsonde data. We are very gratefulto the reviewers of this article for their insightfulcomments and suggestions.| [1] | Atkinson, B. W., J. G. Li, and R. S. Plant, 2001: Numerical modeling of the propagation environment in the atmospheric boundary layer over the Persian Gulf. J. Appl. Meteor., 40(3), 586-603. |
| [2] | Bean, B. R., and E. J. Dutton, 1968: Radio Meteorology. Dover, New York, 435 pp. |
| [3] | Chang, P. L., and P. F. Lin, 2011: Radar anomalous propagation associated with foehn winds induced by Typhoon Krosa (2007). J. Appl. Meteor. Climatol., 50(7), 1527-1542. |
| [4] | Chen, F., and J. Dudhia, 2001: Coupling an advanced land surface-hydrology model with the Penn State-NCAR MM5 modeling system. Part I: Model implementation and sensitivity. Mon. Wea. Rev., 129(4), 569-585. |
| [5] | Cheng Yinhe, 2009: A study on atmospheric ducts over the sea retrieval with AMSR-E satellite data and its numerical simulation. Ph. D. dissertation, Chinese Academy of Sciences, 101 pp. (in Chinese) |
| [6] | Cook, J., 1991: A sensitivity study of weather data inaccuracies on evaporation duct height algorithms. Radio Sci., 26(3), 731-746. |
| [7] | Ding Juli, Fei Jianfang, Huang Xiaogang, et al., 2013: Observational occurrence of tropical cyclone ducts from GPS dropsonde data. J. Appl. Meteor. Climatol., 52(5), 1221-1236. |
| [8] | Dockery, G. D., 1988: Modeling electromagnetic w5ave propagation in the troposphere using the parabolic equation. IEEE Trans. Antennas Propag., 36(10), 1464-1470. |
| [9] | Dudhia, J., 1989: Numerical study of convection observed during the winter monsoon experiment using a mesoscale two-dimensional model. J. Atmos. Sci., 46(20), 3077-3107. |
| [10] | Fairall, C. W., J. D. Kepert, and G. J. Holland, 1994: The effect of sea spray on surface energy transports over the ocean. Global Atmos. Ocean Syst., 2, 121-142. |
| [11] | Gall, J. S., W. M. Frank, and Y. Kwon, 2008: Effects of sea spray on tropical cyclones simulated underidealized conditions. Mon. Wea. Rev., 136(5), 1686-1705. |
| [12] | Hong, S. Y., Y. Noh, and J. Dudhia, 2006: A new vertical diffusion package with an explicit treatment of entrainment processes. Mon. Wea. Rev., 134(9), 2318-2341. |
| [13] | Hu Xiaohua, Fei Jianfang, Li Juan, et al., 2007: Analysis and numerical simulation research of atmospheric duct affected by typhoon. Marine Forecasts, 24(2), 17-25. (in Chinese) |
| [14] | Kain, J. S., 2004: The Kain-Fritsch convective parameterization: An update. J. Appl. Meteor., 43(1), 170-181. |
| [15] | ——, and J. M. Fritsch, 1990: A one-dimensional entraining/ detraining plume model and its application in convective parameterization. J. Atmos. Sci., 47(23), 2784-2802. |
| [16] | Lin, Y. L., R. D. Farley, and H. D. Orville, 1983: Bulk parameterization of the snow field in a cloud model. J. Climate Appl. Meteor., 22(6), 1065-1092. |
| [17] | Liu Chengguo, Huang Jiying, and Jiang Changyin, 2002: The occurrence of tropospheric ducts over the southeastern coast of China. Chin. J. Radio Sci., 17(5), 509-513. (in Chinese) |
| [18] | Liu Guiyan, Gao Shanhong, Wang Yongming, et al., 2012: Numerical simulation of atmospheric duct in typhoon subsidence area. J. Appl. Meteor. Sci., 23(1), 77-88. (in Chinese) |
| [19] | Mesnard, F., and H. Sauvageot, 2010: Climatology of anomalous propagation radar echoes in a coastal area. J. Appl. Meteor. Climatol., 49(11), 2285-2300. |
| [20] | Mlawer, E. J., S. J. Taubman, P. D. Brown, et al., 1997: Radiative transfer for inhomogeneous atmospheres: RRTM, a validated correlated-k model for the longwave. J. Geophys. Res., 102(D14), 16663-16682. |
| [21] | Pan Zhongwei, Liu Chengguo, and Guo Li, 1996: The prediction of ducts on the south-east coast of China. Chin. J. Radio Sci., 11(3), 58-64. (in Chinese) |
| [22] | Parrish, D. F., and J. C. Derber, 1992: The National Meteorological Center’s spectral statistical interpolation analysis system. Mon. Wea. Rev., 120(8), 1747-1763. |
| [23] | Rutledge, S. A., and P. V. Hobbs, 1984: The mesoscale and microscale structure and organization of clouds and precipitation in midlatitude cyclones. XII: A diagnostic modeling study of precipitation development in narrow cold-frontal rainbands. J. Atmos. Sci., 41(20), 2949-2972. |
| [24] | Turton, J. D., D. A. Bennets, and S. F. G. Farmer, 1988: An introduction to radio ducting. Meteor. Mag., 117, 245-254. |
| [25] | Xiao, Q. N., X. L. Zou, and B. Wang, 2000: Initialization and simulation of a landfalling hurricane using a variational bogus data assimilation scheme. Mon. Wea. Rev., 128(7), 2252-2269. |
| [26] | ——, L. Q. Chen, and X. Y. Zhang, 2008: Evaluations of BDA scheme using the Advanced Research WRF (ARW) model. J. Appl. Meteor., 48(3), 680-689. |
| [27] | Zheng Jing, Fei Jianfang, Du Tao, et al., 2008: Effect of sea spray on the numerical simulation of super Typhoon “Ewiniar”. J. Ocean Univ. China, 7(4), 362-372. |
| [28] | Zou, X. L., and Q. N. Xiao, 2000: Studies on the initialization and simulation of a mature hurricane using a variational bogus data assimilation scheme. J. Atmos. Sci., 57(6), 836-860. |