 2013, Vol. 27
The Chinese Meteorological Society
Article Information
- ZHAo Lingyu, LIU Yaling, PAN Zhihua, AN Pingli, PAN Xuebiao and ZHAo Peiyi. 2013.
- Impacts of Recent Climate Change on Dry-Land Crop Water Consumption in the Northern Agro-Pastoral Transitional Zone of China
- J. Meteor. Res., 27(4): 585-590
- http://dx.doi.org/10.1007/s13351-013-0405-3
-
Article History
- Received October 25, 2012
- in final form February 5, 2013


2 Huafeng Meteorological Media Group, Beijing 100081, China;
3 Key Ecology and Environment Field Station for Scientific observation in Huhhot, Ministry of Agriculture, Wuchuan 011705, China;
4 Department of Earth, Atmospheric and Planetary Sciences, Purdue University, West Lafayett 47907, United States
The northern agro-pastoral transitional zone ofChina encompasses the shift in l and use between anagricultural area to the east and a grassy area to thewest. This transitional zone is located in a semi-aridclimate and is very sensitive to climate change(Zhang Sheng jun et al., 2006; Qi et al., 2012). The temperatureof this region has increased in recent decades, while the precipitation has decreased(IPCC, 2007).These climate changes have exerted visible impacts onthe ecological system(Crane et al., 2011)as well ascrop growth and development(Lobell et al., 2011).
Water is a key factor affecting the growth and developmentof crops in the northern agro-pastoral transitionalzone(Pan et al., 2010; Xia et al., 2010). Cropwater consumption refers to evaporation and transpirationby agricultural plants during growth and development.The water supply in the northern agropastoraltransitional zone is always inadequate, so actualcrop water consumption is typically lower thanwater dem and (Shi et al., 2007). Currently, severalmethods(Ma et al., 2005; Zhang Hexi et al., 2006)can be used to calculate crop water dem and and consumption, including water balance, lysimetermeasurements, the FAO(Food and Agriculture Organizationof the United Nations)Penman-Monteithmethod(Allen et al., 1998), energy balance, and remotesensing. Lysimeter measurements are the mostaccurate of these methods, but the instruments are expensive and data coverage is limited due to an insufficientnumber of available instruments(Zhang et al., 2001). The precision achieved by the Bowen RatioequilibriumEnergy Method is relatively low(Prueger et al., 1997). The Penman-Monteith formula is thest and ard method for estimating evapotranspiration and is applied worldwide, but calculation of this formulais complicated due to large number of parametersrequired(Allen et al., 1998). By contrast, thewater balance method is based on clear and sensibleprinciples and is easy to calculate, with universal applicability(Zhang et al., 2001; Si et al., 2005; Liu and Liu, 2006; Lie and Tang, 2007).
A large number of previous studies have analyzedcrop water consumption, but few have characterizedcrop water consumption under the background of climatechange. Underst and ing how climatic change influencescrop water consumption will help to guidelocal agricultural production and ecological development.Here, the response of crop water consumption torecent climate change is explored in Wuchuan Countyof Inner Mongolia in the northern agro-pastoral transitionalzone of China. The analysis is based on meteorologicaldata from 1960 to 2007 and soil moisturedata from 1983 to 2007. The characteristics of climatechange are analyzed along with water consumptionby three local crops(wheat, naked oats, and potatoes)during their respective growth periods. The relationshipsbetween climate change and crop water consumptionare discussed.2. Methods2.1 Study area
Wuchuan County(41°08.344'N, 111°17.580'E)islocated in the middle of the northern agro-pastoraltransitional zone and has the continental monsoonclimate typical of the area. The average annual airtemperature is approximately 3.0℃ and the averageannual precipitation is approximately 250–400 mm, mainly occurring during summertime. The frost-freeperiod lasts approximately 90–120 days. The annualmean wind speed is 4.5 m s−1. The strongest windsoccur in May, when the monthly mean wind speed increasesto 6 m s−1. The soil is chestnut, with a bulksoil density of 1.2–1.7 g cm−3 at 0–50 cm. The croppingsystem is focused on one harvest per year.2.2 Data source
TheWeather Service ofWuchuan County has providedthe data used for the analysis. This datasetincludes meteorological data from 1960 to 2007, soilmoisture data from 1983 to 2007(reported separatelyfor wheat, naked oat, and potato fields), and cropyields of wheat, naked oats, and potatoes from 1983to 2007.2.3 Research methods
The mass water content is calculated in the 0–50-cm soil layer for each type of crop field between 1983 and 2007. The water consumption by each crop duringthe growth period is then calculated using the waterbalance method.
Natural rainfall represents the main source ofagricultural water in the study area. Crops mainlyconsume water from soil moisture prior to planting and precipitation during the growth period. Crop waterconsumption includes both crop transpiration and soil evaporation(i.e., evapotranspiration or ET). Thewater balance equation is
where ΔW is the variation of the soil moistureover a period of time, P is the precipitation duringthe same period, I is irrigation, ET is farml and evapotranspiration, Rn is runoff, D is leakage, and G iscapillary-lifted water. All terms in Eq.(1)are expressedin units of mm. The underground water levelin Wuchuan County is below 7 m and the plough soleis typically between 15 and 23 cm. The leakage D and capillary water G are therefore largely negligible. Thestudy area is a rain-fed area where the irrigation I iszero. Typically, the small magnitude of rainfall ensuresthat the runoff Rn is also negligible. The waterbalance equation for the study area can therefore beapproximated asΔW can be calculated using the change in soil waterstorage in the 0–50-cm layer between the beginning and the end of the period.

The soil water mass content can be transformedinto soil water storage using the formula
where V is the soil moisture storage capacity(mm), R is the soil bulk density(g cm−3), H is the depth ofthe soil layer(cm), and W is the soil water mass content(%). Representative values of soil bulk densityare listed in Table 1.

We use the meteorological data from 1960 to 2007in Wuchuan to analyze the characteristics of climate and climate change in this region. The climatologicalmean annual precipitation in Wuchuan County is342.4 mm, with 306.6 mm between April and September.The annual mean air temperature is 3.0℃. Therainfall has decreased since 1960 at a rate of 0.7 mmyr−1, while the annual mean temperature has significantlyincreased at a rate of 0.04℃ yr−1. These trendsare even more pronounced over the period 1983–2007(which matches the availability of the soil data), witha drying trend of 2.1 mm yr−1 and a warming trendof 0.09℃ yr−1(Fig. 1).
 |
| Fig. 1. Changes in the(a)temperature and (b)precipitation of Wuchuan County from 1960 to 2007. |
The water consumption by wheat, naked oats, and potatoes in Wuchuan County declined from 1983to 2007(Fig. 2a). The water consumption by wheat, naked oats, and potatoes declined at rates of 1.65, 2.04, and 3.85 mm yr−1, respectively. The decreasein crop water consumption was even more pronouncedbetween 1991 and 2007(Fig. 2b), particularly forwheat(7.41 mm yr−1) and naked oats(4.87 mm yr−1).The trend for potatoes was relatively stable, with adecrease of 3.95 mm yr−1 between 1990 and 2007. Thisdifference is primarily dependent on the degree of temporalcoincidence between local rainfall and the criticalperiod of water requirements for each crop type.
 |
| Fig. 2. Changes in water consumption for different crops over the period(a)1983–2007 and (b)1991–2007. |
Crop water consumption is affected by meteorological factors such as rainfall and temperature. Wetherefore analyze the correlations between water consumption and annual rainfall, accumulated temperature(above 0℃ for wheat; above 10℃ for naked oats and potatoes)(Zheng and Sun, 2010), and crop yields.The results are shown in Fig. 3.
 |
| Fig. 3. Relationships between water consumption for(a–c)wheat, (d–f)naked oats, and (g–i)potatoes;(a, d, g)annualrainfall, (b, e, h)accumulated temperature, and (c, f, i)crop yield. |
Water consumption for each crop is positively correlatedwith rainfall(Figs. 3a, 3d, and 3g). The correlationcoefficients between water consumption and rainfall are very high and statistically significant atthe p < 0.01 level. As rainfall decreases, water consumptionby these crops also decreases. This relationshipis the weakest for potatoes(0.74 mm yr−1). Waterconsumption and active accumulated temperatureare negatively correlated(Figs. 3b, 3e, and 3h). Therecent warming trend therefore led to significant decreasesin crop water consumption in this region(p < 0.01 for naked oats and potatoes; p < 0.05 for wheat).Water consumption and crop yields are positively correlated(Figs. 3c, 3f, and 3i). These correlations arestatistically significant for wheat(p < 0.01) and nakedoats(p < 0.05), but not for potatoes.We next perform a multiple regression analysisof water consumption during the growth periods ofwheat, naked oats, and potatoes with accumulatedtemperature and precipitation. The results are presentedin Table 2.
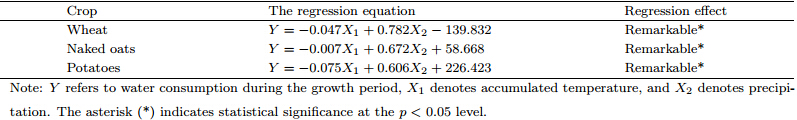
The results of the multiple regression analysis suggest that changes in precipitation affect crop waterconsumption much more than changes in accumulatedtemperature. Accumulated temperature and waterconsumption are negatively correlated for all threetypes of crops, while precipitation and water consumptionare positively correlated. Recent climate changehas been detrimental to agricultural productivity inthe northern agro-pastoral transitional zone. Adaptationto climate change in this region should focuson the development of drought-resistant crop varietals and cultivation measures.4. Conclusions and discussion
We have examined the characteristics of climatechange in the northern agro-pastoral transitional zone(Wuchuan County) and related these characteristics tochanges in water consumption by wheat, naked oats, and potatoes during their respective growth periods.Our conclusions are as follows.
(1)Temperatures have warmed and precipitationhas decreased in Wuchuan County since 1960. Annualmean rainfall has decreased at a rate of 0.7 mmyr−1, while annual mean temperature has increased ata rate of 0.04℃ yr−1. These trends were particularlypronounced between 1983 and 2007, with a warmingtrend of 0.09℃ yr−1 and a drying trend of 2.1 mmyr−1.
(2)Crop water consumption has decreased underthe backdrop of this climate change. Water consumptionby wheat, naked oats, and potatoes decreased atrates of 1.65, 2.04, and 3.85 mm yr−1, respectively.
(3)Water consumption and rainfall during thegrowth season are positively correlated, while waterconsumption and active accumulated temperature arenegatively correlated. Compared to precipitation, accumulatedtemperature has only a small impact oncrop water consumption. The relationships betweenwater consumption, rainfall, and accumulated temperatureare different for different types of crops.
Climate change has a significant impact on waterconsumption by crops. Recent climate change hasbeen detrimental to crop productions in the northernagro-pastoral transitional zone, with decreases inprecipitation playing the largest role. These resultssuggest that local agriculture could most effectivelyadapt to climate change by transitioning to droughtresistantcrop varietals and cultivation techniques.
Few previous studies have examined the relationshipsbetween climate change and crop water consumptionin dry-l and regions. This paper has addressedthis gap. The results represent a guide foradapting local agricultural production and ecologicalconstruction to climate change. However, this studyhas only obtained these relationships for one site, i.e., Wuchuan County, typical of the northern agropastoraltransitional zone of China. The results maybe dependent on soil properties or other local factors.Further studies of this type should be conducted inother areas to extend the results and evaluate theirrobustness.
Acknowledgments. The language editor forthis manuscript is Dr. Jonathon S. Wright.
| [1] | Allen, R. G., L. S. Pereira, D. Raes, et al., 1998: Crop Evapotranspiration: Guidelines For Computing Crop Requirements. Irrigation and Drainage Paper No. 56, FAO, Rome, Italy, 15 pp. |
| [2] | Crane, T. A., C. Roncoli, and G. Hoogenboomet, 2011: Adaptation to climate change and climate variability:The importance of understanding agriculture as performance. NJAS-Wagen J. Life Sci., 57(3-4), 179-185. |
| [3] | IPCC, 2007: Climate Change 2007: The Physical Science Basis. Contribution of Working Group I to the Fourth Assessment Report of the Intergovernmental Panel on Climate Change. Cambridge University Press, United Kingdom and New York, NK, USA, 30-31. |
| [4] | Lie Zhengping and Tang Bo, 2007: The measuring and estimating methods of the crop evapotranspiration. Anhui Agri. Sci. Bull., 13(2), 54-56. (in Chinese) |
| [5] | Liu Jingtao and Liu Shiring, 2006: Advances and perspectives in evapotranspiration studies. Scientia Silvae Sinicae, 42(6), 108-114. (in Chinese) |
| [6] | Lobell, D. B., W. Schlenker, and J. Costa-Roberts, 2011: Climate trends and global crop production since 1980. Science, 333(6042), 616-620. |
| [7] | Ma Lingling, Zhan Chesheng, Tang Lingli, et al., 2005: Review and prospect on the study progress in crop water requirements. Arid Land Geography, 8(4), 531-534. (in Chinese) |
| [8] | Pan Zhihua, Zhang Luyang, Chen Dongdong et al., 2010: Research progress and thoughts about proper exploitation of field water potential productivity in farming-pastoral ecotone of northern China. Journal of Agricultural Science and Technology, 12(1), 40-45. (in Chinese) |
| [9] | Prueger, J. H., J. L. Hatfield, J. K. Aase, et al., 1997: Bowen-ratio comparisons with lysimeter evapotranspiration. Agronomy Journal, 89(1), 730-736. |
| [10] | Qi Yangbin, Chang Qingru, Jia Kelin, et al., 2012: Temporal-spatial variability of desertification in an agro-pastoral transitional zone of northern Shaanxi Province, China. Catena, 88(1), 37-45. |
| [11] | Shi Yafeng, Shen Yongping, Kang Ersi, et al., 2007: Recent and future climate change in Northwest China. Climatic Change, 80(2007), 379-393. |
| [12] | Si Jianhua, Feng Qi, Zhang Xiaoyou, et al., 2005: Research progress on surveying and calculation of evapotranspiration of plants and its prospects. Adv. Water Sci., 16(3), 450-459. (in Chinese) |
| [13] | Xia Zhechao, Pan Zhihua, Zhang Luyang, et al., 2010: Examining mechanisms of vegetation ecosystems degradation based on water in northern farmingpastoral zone: A case study in Wuchuan Country. Resources Science, 32(2), 317-322. (in Chinese) |
| [14] | Zhang Hexi, Chi Daocai, Liu Zuoxin, et al., 2006: The progress in crop water requirements and consumption. Modern Agricultural Science and Technology, 3, 52-54. (in Chinese) |
| [15] | Zhang Jinsong, Meng Ping, Yin Changjun, et al., 2001: Review on methods of estimating evapotranspiration of plants. World Forestry Research, 14(2), 23-28.(in Chinese) |
| [16] | Zhang Shengjun, Yang Gaihe, and Liu Helin, 2006: Some problems about water resources and ecological environment in north ecotone and their cause. J. Anhui Agri. Sci., 34(9), 1945-1947. (in Chinese) |
| [17] | Zheng Dawei and Sun Zhongfu, 2010: Discussion on scientificalness problem of accumulated temperature and its unit. Chinese J. Agrometeor., 31(2), 165-169. (in Chinese) |