 2013, Vol. 27
The Chinese Meteorological Society
Article Information
- HOU Jun, GUAN Zhaoyong. 2013.
- Climatological Characteristics of Frontogenesis and Related Circulations over East China in June and July
- J. Meteor. Res., 27(2): 144-169
- http://dx.doi.org/10.1007/s13351-013-0202-z
-
Article History
- Received January 11, 2013


2. Jiangsu Meteorological Observatory, Nanjing 210008
Precipitation in the Jianghuai(Yangtze River and Huai River)basin is usually related to frontal systems. Particularly, the precipitation in June and Julyis often affected by the Meiyu front. Meiyu/Baiu, orplum rain, is usually distributed along an east-weststrip from the middle and lower reaches of the YangtzeRiver eastward to Japan(e.g., Geng et al., 2009). Typically, the precipitation during the Meiyu period isstrong and continuous, covering a wide area. However, showers or thunderstorms often occur intermittently, resulting in occasional heavy rains and floods(e.g., Guan and Han, 2011). After the Meiyu period, precipitation is reduced significantly and high summerarrives along with hot weather(Lin, 1979; Zhou, 1996;Wei and Zhang, 2004). Between 1885 and 2000, on average, the typical Meiyu period began on 17 June and ended on 11 July in the middle and lower reachesof the Yangtze River, with a mean duration of 21days(Wei and Zhang, 2004). The Meiyu period varieson multiple time scales. It not only exhibits weeklyweather variations, but also is affected by intraseasonal low-frequency oscillations(Xia et al., 2008; Jia and Guan, 2010), fluctuations over 2-3 yr and 11-13yr, as well as 100-yr oscillations(Xu, 1965).
Meiyu precipitation is distributed in a long narrow zone, which is along the zonally stretched quasistationary front. The Meiyu is also affected by thesoutheast monsoon(Zhu, 1934). During the monsoonseason, the modified polar continental air mass integrates with the modified equatorial air mass or withthe modified Pacific air mass to produce a Meiyu front(Tu, 1938). Therefore, the Meiyu is not only characterized by precipitation within the monsoon systembut also by rain belts at the forefront of the EastAsian monsoon. An early study(Tao et al., 1958)suggests that when the East Asian summer monsoondominates southeastern mainl and China and the airflows from both north and south sides converge near30°N, a Meiyu front is produced and hence East Asiaenters the Meiyu period.
Many researchers have attempted to deeply underst and the nature and structure of the Meiyu front.It has been shown that the Meiyu front is a subtropicalfront between the extratropical and equatorial fronts, which exhibits a very small contrast in temperaturebut a large one in humidity between air masses on thetwo sides of the front in the lower troposphere, and also exhibits a very weak vertical wind shear within thefrontal zone(Ninomiya, 1984; Zhang and Zhang, 1990;Ding, 1993). With the increase of available observational data in the upper troposphere, along with theimplementation of special observational experiments, many researchers have studied the spatial structureof the Meiyu front(e.g., Qiu and Ding, 1979). It isfound that the temperature field around the Meiyufrontal zone has a "s and wich" structure(Kato, 1987;Ding, 1992). That is to say, the air temperatures atthe north and south sides of the Meiyu front are higherthan those in the frontal zone; the Meiyu front is like acold tongue located between the north and south warmair masses.Recently, Zheng(2007)reviewed studies on synoptic-scale Meiyu fronts over past decades, and concluded that the Meiyu fronts varied on multispatial-temporal scales and could transit from signatures of the polar fronts to these of the equatorialfronts.
The Meiyu rainfall changes significantly on interannual timescale. These changes are related to boththe location and intensity of the Meiyu fronts. In fact, Meiyu-related precipitation varies with the time of onset and the activity of the Meiyu front. Tao and Chen(1987)pointed out that the migration of rain b and s inEast China was consistent with the north-south motion of the Meiyu front. Chen(1994)studied 43 Meiyufrontal systems and showed that interannual variationsof precipitation over Taiwan during the Meiyu periodwere resulted from the different structures, locations, and intensities of the frontal systems. Similar interannual variations in precipitation were also observedover southern mainl and China(Tao and Chen, 1987;Chen, 1992).
The mesoscale systems around and within theMeiyu frontal zone appear to be responsible forchanges in the Meiyu precipitation and frontogenesis(Geng et al., 2009). The different forms of frontogenesis may lead to changes in the intensity and location of precipitation. Gao et al.(2002)analyzed theMeiyu front structure in 1998, 1999, and 2003, whichincurred heavy Meiyu precipitation, and found a dewpoint front close to the northwest edge of the subtropical high. They suggested that the double-front structure constituted by the dew-point and Meiyu frontswas the main cause of the heavier than usual rainstorms in the above years.
The frontogenesis of the Meiyu can be analyzedby the frontogenesis function. Yin(2010)found thatthe location of rainstorms during the Meiyu period inJiangsu Province in 2003 and 2006 shifted more northern, which incurred a major rain belt in the Huai Riverbasin, and though the length of the Meiyu period wasthe same, the total precipitation amounts in these twoyears differed. These scenarios were believed to be related to both the distribution of frontogenesis function and the differences in Meiyu frontal intensity.
What is mentioned above suggests that muchprogress has been made in better underst and ing theMeiyu and Meiyu front. Many researchers have investigated the formation conditions, structural features, maintenance mechanisms, and other aspects of theMeiyu front from different perspectives in climatology and synoptic meteorology. However, studies, especially multi-sample statistical studies on Meiyu frontogenesis, are still very few. The climatological characteristics of frontogenesis over East China, especiallythe Jianghuai area, remain unclear, as does the climatological frontal structure, the major types of frontogenesis over the Jianghuai area, and their relationships with the precipitation there. In the present studywe investigate the relationship between Meiyu precipitation and frontogenesis and further underst and thetypes and structures of the Meiyu fronts. Frontogenesis over East China, especially the Jianghuai area, isdiscussed from a climatological point of view to clarify the climatological features of both the frontogenesis and frontal systems.2. Data and methodology2.1 Selection of data and stations
The NCEP/NACR global final analysis data(FNL; http://dss.ucar.edu/)are employed. The gridresolution is 1°×1° in horizontal, with 26 layers in vertical. Data assimilation is carried out every six hoursfor this reanalysis. However, only is the daily me and ata used in this paper. Daily precipitation data from743 stations of the China Meteorological Administration are used. All daily data are from June to July of2000-2010.
Quality of the precipitation data is strictly controlled. Stations with missing data during the studyperiod are excluded. Then, 212 stations in East China and the surrounding area are ultimately selected.2.2 Definition of frontogenesis function
Frontogenesis(frontolysis)can be divided intokinematic frontogenesis(frontolysis) and dynamicfrontogenesis(frontolysis)(Wu, 1999; Guan, 1992).Frontogenesis function is defined as 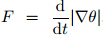 where θ indicates potential temperature. This equa-tion is for a dry atmosphere. When condensation and precipitation occur in the region under the control of saturated moist air, the physical quantity θ isno longer a conservative. Moreover, the structure ofthe Meiyu front in the lower troposphere manifestsas a strong contrast of humidity rather than temperature, so pseudo-equivalent potential temperature isoften used to analyze the structure of the Meiyu front(e.g., Wang and Tao, 2002). To define a proper Meiyufrontogenesis function, the pseudo-equivalent poten-tial temperature is used instead of temperature in thisstudy(e.g., Han et al., 2005). With the zonal and meridional components of horizontal wind representedby u and v, respectively, and the pseudo-equivalenttemperature by θse, the kinematic frontogenesis function in the p coordinate can be expressed as

From Eq.(1), the following physical quantitiescan be obtained
and then

In the above equations, 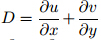 denotes thehorizontal divergence,
 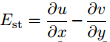 denotes stretching deformation, and
 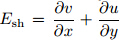 denotes sheardeformation. FnDiv denotes the increase(or decrease)in the horizontal temperature gradient caused by horizontal convergence(D < 0)or horizontal divergence(D > 0). FnDfm represents the frontogenesis generatedfrom the overall horizontal deformation. Variable β inthe deformation term is the angle between the contourof θse and the stretching axis; when β is less than 45°, frontogenesis occurs along the stretching axis, that isto say, deformation of the wind field always leads tofrontogenesis. FnTlt denotes the tilting term(or twisting term)resulting from uneven horizontal distribution of vertical velocity and pseudo-equivalent potential temperature. Each term in Eq.(3)indicates frontogenesis if positive and frontolysis if negative.2.3 Calculation and statistical methods
The mean frontogenesis intensity at a grid point(denoted with η)is defined as the ratio of accumulativetotal of positive values of frontogenesis function to thetotal frequency of events with a positive frontogenesisfunction value at that grid point. It should be notedthat only frontogenesis other than frontolysis is discussed in this paper. The selected area over which thevalues are averaged is 31°-35°N, 118°-123°E. Composite analysis is carried out to investigate four frontogenesis types in East China, especially in the Jianghuaiarea. In the statistical analysis of frontogenesis events, all relevant variables are statistically verified using at-test.3. Distribution of frontogenesis function
In East China, precipitation events with different durations and intensities occur every summer fromJune to July and most of them are in the Meiyu period. These events are usually associated with frontalsystems. The distribution of frontogenesis functionvalues at 850 hPa in June and July from 2000 to 2010(Fig. 1)shows that significant kinematic frontogenesis is observed in East China in these months, butapparent differences are found in the values of different terms. Deformation frontogenesis is the strongest, with the largest frontogenesis area(Fig. 1b); tiltingfrontogenesis is relatively weaker, with two large valuecenters in East China(Fig. 1c); and divergence frontogenesis is the weakest(Fig. 1a), differing from theother two terms by one order of magnitude. Usually, these three terms do not contribute to frontogenesis atthe same time. When some terms contribute to frontogenesis, other terms contribute to frontolysis. Inareas of Jiangsu Province there prevails deformationfrontogenesis while in Jiangxi and Hunan provinces sodoes the tilting frontogenesis. The distribution of integrated terms(Fig. 1d)indicates that the strongestfrontogenesis occurs in the Jianghuai basin, with anaverage intensity of 3.7×10⁻¹⁰ K m-1 s-1 in this area.
 |
| Fig. 1. Distributions of the frontogenesis function values at 850 hPa in June and July from 2000 to 2010 in East China.(a)Divergence term FnDiv, (b)deformation term FnDfm, (c)tilting term FnTlt, and (d)integrated term Fn. The blackframe in(d)is the key area, marked with letter A. |
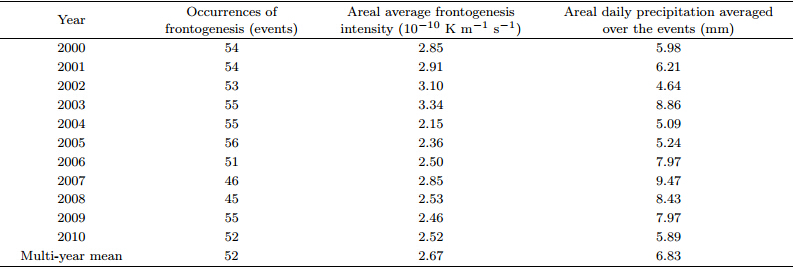
Based on the definition of mean intensity(η)offrontogenesis at a grid point, it is found that the gridpoint with the strongest frontogenesis function Fn isat 33°N, 121°E(Fig. 1d), with an intensity of η =3.7×10⁻¹⁰ K m-1 s-1. This point is referred to asPmax. To pick out the representative cases of strongfrontogenesis events in East China, the first step is todefine a rectangular area that contains Pmax. Then, Fn during the 671 days from June to July of the 11-yrstudy period is averaged over the Pmax-centered area(31°-35°N, 118°-123°E)(denoted by A, as seen Fig. 1d). Thus, the time series of areal averaged Fn is obtained. If the Fn averaged over area A is positive on acertain day, a frontogenesis event is considered to haveoccurred. The frequencies and intensities of frontogenesis events in June and July of each year are listed inTable 1, which shows there are significant interannualvariations in the frequency of frontogenesis(frontolysis)events, with the frequency of frontolysis events being relatively low(95 events) and frontogenesis eventsbeing relatively high(576 events). The frontogenesisevents occurred most frequently in 2005(56 events), while the strongest frontogenesis as determined by theareal average frontogenesis function occurred in 2003(3.34×10⁻¹⁰ K m-1 s-1).
 |
The normalized time series of Fn(Fig. 2)showsthat the intensity of strong frontogenesis events changesignificantly year by year. Two stronger cases occurredin 2002 and 2009, with normalized values of Fn up to6. In general, strong frontogenesis events usually occurred from mid June to mid July, which coincideswith the Meiyu periods over the past decades.
 |
| Fig. 2. Normalized time series of areal averaged Fn(black bars)at 850 hPa in June-July from 2000 to 2010 in theJianghuai area. The horizontal red line is for values at one st and ard deviation. |
Eighty-five frontogenesis events with the normalized value greater than 1 in the normalized time series are selected. These selected frontogenesis eventsare separated into four types as per the shear type ofhorizontal wind along the strong frontogenesis b and at850 hPa. They include the type of warm shear betweensouthwesterly and southeasterly winds, type of coldshear between northeasterly and northwesterly winds(sub-type I)or between northeasterly and southwesterly winds(sub-type II), type of west wind induced byconvergence between southwesterly and northwesterlywinds, and type of east wind induced by convergencebetween southeasterly and northeasterly winds(Table 2). As shown in Table 2, the different frontogenesisevent types occur with different frequencies. In theJianghuai area, warm shear frontogenesis occurs mostfrequently(21 events). This type is the shear frontogenesis between the southwesterly and southeasterlywinds and usually occurs to the right of the surface cyclone center. For cold shear frontogenesis events, thefrequency of sub-type I frontogenesis is relatively high(16 events). This sub-type shows a shear induced bycyclonic rotation of the southward motion of a strongnortherly flow in the Jianghuai area. West wind typeoccurs 15 times, ranking only second to that of coldshear type I. This type is generated from the integration of southwest monsoon and northwest flow inthe Jianghuai area and is different from the frontogenesis occurring within the cyclone. Cold shear type IIfrontogenesis occurs 11 times from shear generated between northeasterly and southwesterly winds. Specifically, the cold shear type II events are caused by thecombined action of warm moist flow at the northwestedge of the subtropical high and the northeasterly coldair moving southward, which differ from the cold sheartype I. East wind type has the lowest frequency(4events) and is affected by typhoon. These events areinduced by deformation of the wind field caused bythe strong convergence of strong easterly flow at thenorth edge of the typhoon and northeasterly flow overthe Jianghuai basin.
 |
There are a total of 67 events of the four types.Different frontogenesis types have different areal average intensities. Cold shear type II frontogenesis is thestrongest, followed by warm shear, then west wind, with cold shear type I the weakest. In addition, 18 ofthe 85 strong frontogenesis events are not included inthe statistical analysis because of their complex typesof wind field in the strong frontogenesis area and theiroccurrences are lower than three events for each type.
Two steps are performed based on the above classification and definition of frontogenesis events to reveal the large-scale circulation patterns and structurecharacteristics of the four frontogenesis types in theJianghuai area of East China. Firstly, using compositetechniques, a comprehensive analysis is carried out forthe frontogenesis function, pseudo-equivalent potential temperature, temperature, horizontal wind, and velocity potential function and stream function to reveal the basic characteristics of horizontal structureof the Meiyu front. Secondly, based on the fact thatPmax is centered and the Meiyu front is on an eastwest zonal distribution, a meridionally-averaged zonalsection that parallels with the front and a meridionalsection averaged over 116°-121°E are used to analyzethe vertical structure of fronts for each of the fourfrontogenesis types.4.2 Circulations and structure of warm shear frontogenesis
Warm shear frontogenesis is typical during theMeiyu period. Distributions of the pseudo-equivalentpotential temperature θse or equivalent temperatureTe(Fu and Qian, 2011)are able to display the distribution characteristics of atmospheric humidity in thelower and middle troposphere. Because a large sideto-side contrast of humidity across the Meiyu front isoften observed in the lower troposphere, the approximate location of the frontal zone can be determinedthrough analysis of low-level θse distributions. At 850hPa, a b and with large gradient of θse is observed between 32° and 35°N and an obvious nearly eastwestfrontal zone is formed(Fig. 3a). The location of thefrontal zone defined by the large value area of frontogenesis function is well consistent with that by θse. Inthe frontal zone, a zonal distribution of strong frontogenesis can be found with the central intensity up to12×10-10 K m-1 s-1. Moreover, the 340-K contourof θse crosses the strongest frontogenesis area, dividingthe strong frontogenesis b and into the north and southparts. It has been pointed out that the 340-K contourof θse is the dividing line of the southern warm moistarea and northern dry cold area(Zheng, 2007), whichconforms to the concept that the Meiyu front is the interface between the warm air flow moving northward and the northern relatively cold air mass. In addition, dense contours of θse have also been observed in thesoutheast coast of mainl and China and Taiwan region, which may be associated with the subtropical frontalzone and distribution of l and and sea.
 |
| Fig. 3. Circulation patterns of warm shear type frontogenesis.(a)Fn at 850 hPa. Shaded areas show the values ofFn above 2×10⁻¹⁰ K m-1 s-1. The area circled by inner(outer)red curves shows the values of Fn above 95%(90%)confidence level using a t-test. The black contours denote θse, with the 340-K contour of θse in bold.(b)Red contours are for temperature, arrows are for winds at 850 hPa, and the thick(thin)ones are for those above 95%(90%)level of confidence using a t-test. Areas with wind speed greater than 12 m s-1 are shaded. The red thick line indicates the shear line. The Tibetan Plateau is colored gray . The rectangular box with dashed border is the key area as shown in Fig. 1d.(c)Streamlines indicate non-divergent winds while arrows indicate divergent winds at 850 hPa.(d)As in(c), but at 200 hPa. |
The isotherms near the frontal zone are relativelysparse. This may be caused by the reduced temperature in rain belt resulting from high precipitation overthe Meiyu zone, which weakens the north-south temperature difference of the ground and low-level frontalzone(Xie, 1956). Ninomiya(1984)opined that thelow temperature in the Meiyu zone is caused by theshelter effect of thick clouds and cooling effect of heavyprecipitation. The distribution of temperature is similar to the "s and wich" structure(Kato, 1987). It isgenerally believed that the Meiyu front is characterized by confrontation of cold and warm air over theYangtze River basin. However, the temperature analysis in East China, particularly in the Jianghuai basin, shows that there is not always a strong temperaturegradient between the two sides of the Meiyu front.
The westerly flow from the Bay of Bengal is divided into two over Indo-China. One is a southwest flow bypassing the Tibetan Plateau, which enters China along the southern edge of the TibetanPlateau(Figs. 3b and 3c). The other enters China after turning into a strong southerly by stretching to theSouth China Sea from the equatorial region to meetthe southeasterly flow at the leading edge of the western Pacific subtropical high. The two southerlies turninto a southwest low-level jet stream to the south of thelarge value area of frontogenesis function, with a windspeed ≥ 12 m s-1; in the meantime, east-southeastwinds occur to the north of the frontal zone, so a warmshear wind field forms in the Jianghuai area.
Non-divergent circulation at the 850-hPa isobaricsurface shows that the cyclone zone extends from Indo-China to the Jianghuai basin(Fig. 3c) and strongfrontogenesis is located in the northeast of the monsoon trough. At 200 hPa, an anticyclonic circulationis observed(Fig. 3d). The obvious convergent airflow in the lower troposphere comes from the westernPacific subtropical high to the south of the Jianghuaibasin and from the anticyclonic zone to the north ofthe Jianghuai area, respectively. This convergent airflow corresponds to a divergent air flow in the uppertroposphere. The divergence center is located betweenthe anticyclone center of the South Asian high and theexit of westerlies northeast of the Jianghuai area(Fig. 3d). This is conducive to the circulation pattern thatfavors precipitation and frontogenesis.
In the case of significant temperature contrasts and strong baroclinicity, such as in winter and spring, the isotherm in the frontal zone is sloping in thehorizontal-vertical section. This indicates the basicthermodynamic characteristic that the horizontal temperature gradient is large while the vertical one is small(or even with inversion)in the frontal zone. Therefore, the principle of front positioning in the sectionis to use the turning point(also known as inflexion)on the isotherm from horizontal to sloping to determine the locations of the upper and lower borders ofa front. Moreover, the potential temperature isolinein the frontal zone is also sloping in the section, butin a direction opposite to that of the isotherm, so thetrend of potential temperature isoline in the frontalzone nearly parallels that of the frontal zone(Tao and Zheng, 2012). Because pseudo-equivalent potentialtemperature is more conservative than potential temperature, the frontal zone can be much more preciselypositioned by using the former than the latter, especially in summer with a weak temperature gradient butintense condensation and precipitation. For frontalzone positioning through identifying air masses in thesection, not only can the frontal zone be preciselypositioned, but when precipitation occurs, significantpseudo-equivalent potential temperature maxima often appears in the upper boundary of the frontal zone, and the physical phenomena of moist air rising alongthe frontal zone can be effectively visualized(Xie et al., 1956). Side-to-side temperature contrast is generallyvery small in the Meiyu front. No significant inflexionappears between the upper and lower boundaries ofisotherm or potential temperature isoline. Therefore, the frontal zone should be positioned mainly according to the density of isolines of the pseudo-equivalentpotential temperature.
For further analysis on the vertical structure and circulations of warm shear type strong frontogenesis, sections averaged over 116°-121°E are plotted(Fig. 4). As shown in Fig. 4, the funnel-shaped contour ofθse extends downward near 33°N above the 500-hPaisobaric surface, while dense contours of θse are observed between 32° and 35°N in the middle and lowertroposphere to the north of the funnel below 600 hPa.The dense contours of θse are often associated withprecipitation, and thus the Meiyu zone is defined byθse. The frontal zone is steep, with its upper and lowerboundaries slightly tilting northward with height. Thelarge value area of frontogenesis function extends fromthe lower troposphere up to 600 hPa, approximatingthe shape of a column with height. The strongestfrontal zone is located between 850 and 700 hPa. Itsdistribution is largely consistent with that defined byθse(Fig. 4a). In the strong frontogenesis area, thestrong frontogenesis tongue, high θse tongue, and highspecific humidity tongue overlap with each other and the high specific humidity tongue extends up to 350hPa, indicating that there is a strong humidity gradient but a weak temperature gradient in the frontalzone(the temperature gradient was only significantnear the ground). This further clarifies that the sideto-side contrast of humidity is a major feature of themiddle frontal zone in warm shear frontogenesis. The340-K contour of θse passes through the strong frontogenesis area, in parallel with the frontal zone, and is always located north of 34°N from the bottom toupper levels. In addition, a high-altitude subtropical frontal zone is located slightly south of the Meiyufrontal zone in the upper half of the troposphere. Thisfrontal zone tilted significantly northward with height, indicating strong baroclinicity in this zone. Moreover, the side-to-side contrast of temperature is more significant in this zone than in the lower frontal zone.
 |
| Fig. 4. Vertical structure and circulations of warm shear type frontogenesis.(a)Shaded areas are for values of Fn above2×10-10 K m-1 s-1, averaged over 116° -121°E. Areas circled by inner(outer)red curves show the values of Fn above95%(90%)level of confidence using a t-test. The black contours are for µse, with the 340-K contour of µse in bold. Thered contours are for temperatures. The black dotted contours are for specific humidity . The black thick lines indicatethe boundaries of the Meiyu frontal zone and the purple dotted thick lines denote the boundaries of upper troposphericsubtropical frontal zone.(b)The streamlines are for meridional circulations. The green solid contours indicate southwind while the green dotted ones indicate north wind. The zero-wind line is in bold face. The orange solid contoursindicate west wind while the orange dotted ones indicate east wind. The zero-wind line is also in bold face. The bluecontours indicate vertical wind speed.(c)Longitude-height section for quantities averaged over 31°-35°E. Shaded areasshow the values of Fn above 2×10⁻¹⁰K m-1 s-1. Areas circled by inner(outer)blue curves show the values of Fn above95%(90%)con¯dence level using a t-test. The streamlines are for zonal circulations. The red solid contours indicatewest wind while the dotted contours indicate east wind. The thick contour in red indicates zero-wind speed line. Thered thick line at abscissa indicates the area over which the physical quantities are averaged in space. |
The vertical circulations demonstrate a strong ascent with its speed greater than 0.1 m s-1 in front ofthe Meiyu front, with companion of a high θse tonguein vertical. In addition, two clockwise circulations areobserved to the south of the frontal zone(Fig. 4b).The existence of these two circulation cells indicatesthe complex structure of monsoon circulation. The circulation cell located at 21°N in the tropics has differentproperties from the one at 28°N. The southwesterlyflow from the lower troposphere around 20°N meetsthe cold air from 35°N in the strong frontogenesis area and then ascends vertically up to 200 hPa. The zerowind line of north and south winds tilts southwardfrom 850 to 350 hPa. The strong frontogenesis areainclines to a relatively dense contour area of southerlywinds. The warm moist air comes from the lower troposphere, while the dry cold air is from the northernupper troposphere. This relatively unstable stratification facilitates heavy precipitation. The shear linebetween the easterly and westerly winds is collocatedwith the Meiyu front in the lower half of the troposphere, while the subtropical westerly jet stream inthe upper troposphere coexists with the subtropicalfrontal zone in the upper half of the troposphere. Thestrong ascent associated with the Meiyu front is located around the boundary of upper tropospheric easterly and westerly winds while inclining to the westerlyside. This actually indicates that the occurrence ofthe Meiyu rain belt is associated with a divergent flowaround the east ridge of the South Asian high, wherethe easterly winds turn into westerly winds(Zheng, 2007). In the tropics, a weak vertical circulation cellexists(Fig. 4b), corresponding to the weaker but relatively large value area of frontogenesis function(Figs.4a and 3a). This may be related to the terrain and distribution of l and and sea in Taiwan region and southern China, as well as the tropical and subtropical airmasses.
In the zonal direction, the ascent motion of airis observed in the whole large value area of frontogenesis functions. A consistent westerly flow is foundto the east of 114°E from the lower to upper troposphere(Fig. 4c). To the west of 114°E, the zero-windline of tropospheric westerly winds tilts westward withheight. The westerly wind speed is lower at lower altitude while higher at higher altitude. This is associatedwith the thermal wind resulting from the north-southtemperature difference.4.3 Circulations and structure of cold shear type I frontogenesis
Cold shear type frontogenesis emerges often during the Meiyu period. At the 850-hPa isobaric surface, dense contours of θse are observed between 31° and 35°N and a wide frontal zone across distance by5° in meridional is formed(Fig. 5a). The large valuearea of frontogenesis function is found in key area A, being consistent with the frontal zone. The frontogenesis intensity is relative weak as compared to thatof the warm shear type. The 340-K contour of θsepasses through the strong frontogenesis area. In addition, dense contour b and of θse is also observed on thesoutheast coast of China and Taiwan region.
 |
| Fig. 5. As in Fig. 3, but for cold shear type I frontogenesis. |
A "s and wich" structure in the temperature field isalso found in the lower troposphere over the Jianghuaiarea, but temperature of the cold tongue is slightlyhigher and the temperature gradient is very small(Fig. 5b).
An anticyclonic circulation is observed east of theHetao area in China(Figs. 5b and 5c) and a cycloniccirculation is seen over the Korean Peninsula. Thestrong northerly flow between the cyclonic and anticyclonic circulations drives the dry cold air southward, which produces cyclonic rotation in the strong frontogenesis area, so a cold shear type I wind pattern isformed over the Jianghuai area.
The non-divergent flows at the isobaric surface inthe lower troposphere show that the cyclone zone extends from Indo-China to the Jianghuai basin to connect with the northern cyclone zone. Moreover, it constitutes a saddle-shaped flow together with an anticyclone to the east of the Hetao area and the westernPacific subtropical high. The key area A is locatedon the deformation axis of the flow field(Fig. 5c). Atthe 850-hPa isobaric surface, an obvious convergent airflow comes from the western Pacific subtropical high and the two northern cyclonic and anticyclonic circulations. Corresponding to the convergence center, at 200hPa, a divergence center is present in the upper troposphere between the center of the South Asian high and the westerly jet stream exit zone in the northeast(Fig. 5d). The circulation pattern of this cold sheartype I frontogenesis facilitates both precipitation and frontogenesis.
Dense isolines of θse are observed between 32° and 36°N below 500 hPa in the frontal zone of the coldshear type I frontogenesis. The frontal zone is steep, with a strong humidity gradient. Moreover, the Meiyufront tilts southward significantly within height below1.5 km in the planetary boundary layer. This showsthat the low tropospheric Meiyu front has acquired theproperties of an equatorial front(Fig. 6a). The frontogenesis function below 600 hPa(Fig. 6b)shows thatas height increases, the strong frontogenesis tongueextends in vertical in the same direction of the denseisolines of θse. This tongue looks weaker in intensitythan that of the warm shear type. The 340-K contourof θse passes through the strong frontogenesis area inparallel with the frontal zone. This 340-K contour islocated at 35°N in the boundary layer and tilts southward with height. After reaching 31°N at 600 hPa, it begins to tilt northward with height. The middletroposphere of the frontal zone is weakly convectivestable, while it is convectively instable in the lowertroposphere. A subtropical frontal zone is also observed in the upper half of the troposphere.
 |
| Fig. 6. As in Fig. 4, but for cold shear type I frontogenesis. |
The vertical circulation shows that there are alsotwo clockwise circulations south of the frontal zone(Fig. 6b). The range of the circulation cell at 21°N isgreater than the one at 28°, showing a relatively complex structure of monsoon circulation. A southwesterly flow from 20°N in the lower troposphere meetsthe dry cold air from the north in the strong frontogenesis area and then induces a strong ascent up to200 hPa. However, compared with that in the warmshear type, the strong ascent zone is present in themiddle and upper troposphere with a narrower range.The zero-wind line between north and south winds becomes vertical with height below 400 hPa. The strongfrontogenesis area inclines to the dense isotach area ofthe north wind, and the horizontal gradient of windspeed in the frontal zone is large. This is conduciveto the accumulation of cold air in the frontal zone.The subtropical westerly flow also coordinates withthe subtropical frontal zone in the upper troposphere.A weak vertical circulation cell is also observed in thetropics(Fig. 6b).
The strong frontogenesis area as seen in thelongitude-height section(Fig. 6c)tilts westward withheight. There is a clockwise circulation at 600 hPa at108°E; the westerly flow diverges into two at 110°E;one sinks vertically to converge with the easterly flowin the lower troposphere and the other is incorporatedinto the strong ascent of the strong frontogenesis area.The speed of westerly wind is relatively larger in theupper troposphere, with a maximum speed of 19 ms-1.4.4 Circulations and structure of cold shear type II frontogenesis
The cold shear type II frontogenesis shares manycommon characteristics with the cold shear type I.However, some differences still exist. Dense contoursof θse with a zonal distribution are observed between31° and 35°N in the lower troposphere(Fig. 7a). Correspondingly, the large values of frontogenesis function distribute zonally. This frontogenesis type is verystrong, with the maximum intensity up to 12×10-10K m-1 s-1. The strong frontogenesis is found withinthe key area. The 340-K contour of θse is located inthe middle of the key area(Fig. 7a). As seen in coldshear type I, dense contours of θse are also observedon the southeast coast of China and over the Taiwanregion.
 |
| Fig. 7. As in Fig. 3, but for cold shear type II frontogenesis. |
The "s and wich" structure of temperature is nolonger obvious, and the cold tongue has been shortened to the east. However, the temperature is relatively low in the Jianghuai area, with a minimum of19.
Interestingly, the flow pattern of this type is similar to that of the warm shear type south of the keyarea A(Figs. 7b and 7c). Specifically, the westerlyflow from the Bay of Bengal divides into two over IndoChina. One becomes the southwest flow bypassing theTibetan Plateau, which enters China along the southern edge of the Tibetan Plateau. The other entersChina after turning into a strong southerly by stretching to the South China Sea from the equatorial regionto meet the southeasterly flow at the leading edge ofthe western Pacific subtropical high. The two southerlies turn into southwesterlies to the south of the largevalue area of frontogenesis function, with wind speed≥ 9 m s-1. To the north of key area A, the flowfield looks similar to that of cold shear type I. Specifically, two cyclonic and anticyclonic circulations existover the Hetao area in China and the Korean Peninsula to drive the dry cold air southward. The nondivergent circulation in the lower troposphere(Fig. 7c)shows that the circulation pattern of this type isassociated with a saddle-shaped flow field in the lowertroposphere. Cyclonic circulations are observed to thesouthwest and northeast of key area A, while anticyclonic circulations are observed in the south-southeast and north-northwest areas. Key area A is located atthe intersection of the stretching axis and compressionaxis of the deformation flow. At the 200-hPa isobaricsurface, the anticyclone of the South Asian high is welldefined and strong(Fig. 7d), close to key area A, and centers at 113°E. Convergence is present over the lowerlevels of key area A and divergence is present at theupper levels, with the divergence center located in theupper tropospheric westerly jet exit zone.
Cold shear type II has both similarities and differences as compared to cold shear type I in the verticalstructure of the frontal zone. The horizontal-verticalsection of θse over 116°-121°E(Fig. 8a)shows that thefrontal zone tilts northward significantly with heightfrom the lower to upper troposphere, displaying typical characteristics of the vertical frontal zone of theMeiyu front. The lower boundary of the Meiyu frontalzone tilts southward only below 1 km in the planetaryboundary layer. The large value area of frontogenesis function tilts northward significantly with height, with a strong contrast of humidity but a small one oftemperature in the frontal zone. The 340-K contourof θse passes through the strong frontogenesis area inparallel with the frontal zone. Similar to that of thewarm shear type, the 340-K isoline of θse of cold sheartype II is just located at 34°N in the middle and lower troposphere. In addition, there is also a tropical frontal zone in the upper troposphere.
 |
| Fig. 8. As in Fig. 4, but for cold shear type II frontogenesis. |
Two clockwise circulations in vertical are presentto the right of the frontal zone, but the one at 21°Nis relatively weaker(Fig. 8b). The zero-wind line between north and south winds extends vertically below400 hPa. The frontal zone is located in the middle ofthe dense isotaches of north and south winds. There isa strong horizontal wind gradient but a weak verticalone in the frontal zone. A strong ascent with a vertical velocity greater than 0.1 m s-1 is present south ofthe frontal zone from the bottom to upper levels. Inaddition, the upper tropospheric westerly jet tongue, which accompanies with the subtropical frontal zone, extends to 500 hPa, with wind speed up to 40 m s-1.In the tropics, there is also a weak vertical circulationcell(Fig. 8b), corresponding to a weaker frontogenesis.
The zonal vertical section shows that the flowsabove 850 hPa are most often westerly, and a strongascent is in the large value area of frontogenesis function, which has a central intensity as high as 12×10-10K m-1 s-1.4.5 Circulations and structure of west wind type frontogenesis
West wind type frontogenesis occurs more frequently in June and July and is different from theprevious two types of shear frontogenesis happeningwithin cyclones. As shown in Fig. 9a, dense isolinesof θse are found between 33° and 35°N. The 340-K contour of θse is located north of the dense isolines. Thelarge value area of frontogenesis function is located inthe key area, which is consistent with the location ofthe frontal zone. In addition, dense contours of θse arealso observed on the southeast coast of China.
The temperature distribution shows that the"s and wich" structure no longer exists in the lower troposphere in the west wind type frontogenesis. Thetemperature is higher to the southwest and lower tothe northeast of the large value area of frontogenesisfunction.
The winds in the lower troposphere(Fig. 9b)show that a southwesterly flow from the Bay of Bengal enters the north of the Jianghuai area. Moreover, cold air invades southern China from Inner Mongoliain the northwest and from Northeast China. The twoflows strongly converge in the Jianghuai basin, forming a convergent flow of west wind.
 |
| Fig. 9. As in Fig. 3, but for west wind type frontogenesis. |
The non-divergent flow at the 850-hPa isobaricsurface(Fig. 9c)shows a cyclone north of key areaA. This cyclone dominates in the area from northernJianghuai to Sh and ong Peninsula to Liaodong Peninsula. Meanwhile, the western Pacific subtropical highis present south of the key area. The key area is justbetween the cyclonic the anticyclonic circulations inthe lower troposphere. Convergence is found in thekey area A in the lower troposphere and divergence isin the upper troposphere, with the divergence centerlocated in the upper troposphere between the center ofthe South Asian high and the westerly flow exit zonein the northeast(Fig. 9d).
The frontal zone of strong west wind type frontogenesis tilts slightly northward with height(Fig. 10a). The baroclinic frontal zone is quite consistentwith the dense contours of θse. The lower part of thefrontal zone in the lower planetary boundary layer tiltssouthward. The funnel-shaped contours of θse extenddownward near 33°N above the 500-hPa isobaric surface. The large value area of frontogenesis function extends from the lower troposphere up to 550 hPa. Thestrongest frontal zone is located between 650 and 750hPa in the middle troposphere. The 340-K contour ofθse passes through the strong frontogenesis area in parallel with the frontal zone. This contour stretches outat 37°N and tilts southward from the lower boundarylayer up to 800 hPa. Below 600 hPa, the strong frontogenesis tongue, high θse tongue, and high specifichumidity tongue overlap with each other and the highspecific humidity tongue extends up to 400 hPa. Thereis a strong humidity gradient but a weak temperaturegradient in the frontal zone. In addition, there appearsalso a tropical frontal zone in the upper troposphere.
 |
| Fig. 10. As in Fig. 4, but for west wind type frontogenesis. |
Of the two counter-clockwise vertical circulationsof the afore-mentioned three frontogenesis types, theone in low latitudes disappears in the study area, buta clockwise circulation is observed north of the frontal zone(Fig. 10b). The southerly component of thewinds stretches vertically in the frontal zone. The horizontal wind gradient is strong but the vertical windgradient is weak in the frontal zone. The northerlywinds and the deep southerly winds constitute a deepstrong ascending area throughout the troposphere, which is crucial for the strengthening of the verticalcirculation in the frontal zone. The zero-wind line between north and south winds tilts slightly northwardfrom the lower to upper levels. The subtropical westerly jet extends down to 550 hPa. In the tropics, thereis also a weak vertical circulation cell(Fig. 10b), corresponding to the relatively larger values of frontogenesis function(Figs. 10 and 9a).
In zonal-vertical section(Fig. 10c), the east windsare not observed from the lower to upper troposphere, while a westerly is found from west to east. The strongascent is observed in the areas with large values offrontogenesis function, while a well-defined clockwisevertical circulation exists to its left between 104° and 108°E.4.6 Circulations and structure of east wind type frontogenesis
East wind convergence type frontogenesis occurswith a relatively low frequency in the Meiyu period.This type is mainly affected by typhoons over thecoastal areas of China. As shown in Fig. 11, densecontours of θse are found at 850 hPa over the Jianghuaiarea. The large values of frontogenesis function arefound in the northeast of the key area, with a relativelyhigh intensity of 14×10-10 K m-1 s-1, in consistentwith the frontal zone. The 340-K contour of θse passesacross the area with large values of frontogenesis function. In addition, the dense contours of θse disappearon the southeast coast of China.
 |
| Fig. 11. As in Fig. 3, but for east wind type frontogenesis. |
In vertical, large frontogenesis function is centered at 700 hPa(Fig. 12), tilting southward withheight, and extending up to 350 hPa. The deepsoutherly winds prevail south of the strong frontogenesis area, with a strong horizontal gradient. The largestsoutherly winds appear at 300 hPa, with wind speedup to 12 m s-1.
 |
| Fig. 12. As in Fig. 4, but for east wind type frontogenesis. |
To further investigate the intrinsic link betweenstrong frontogenesis and precipitation as well as precipitation characteristics of the various frontal systemtypes, area A(i.e., 31°-35°N, 118°-123°E; over whichthe frontogenesis function Fn is averaged), is considered as the target area. As shown in Fig. 13, dailyprecipitation recorded by 14 stations(in Jiangsu and Anhui provinces)within area A is summed and averaged to depict the overall features of daily precipitation in area A. A close relationship is found betweenthe intensity of frontogenesis and precipitation. Whenfrontogenesis is strong in key area A, precipitation ishigh in the area. When strong frontogenesis events occur successively with high frequency, such as in 2003 and 2007, precipitation lasts a long period with largerainfall amount. After having both time series of Fn and precipitation smoothed with three-point runningmean, the correlation coefficients between the time series of Fn and precipitation is found as high as 0.55, which is above the 95% level of confidence using a twotailed t-test.
 |
| Fig. 13. Time series of areal averaged Fn(black bars)at 850 hPa and daily precipitation(red lines; mm)in June-July from 2000 to 2010 in East China.(a)2000-2002, (b)2003{2005, (c)2006-2008, and (d)2009-2010. |
Precipitation distributions induced by differenttypes of frontogenesis look different as displayed inFig. 14 and Table 3. The largest precipitation is seenin the warm shear type frontogenesis(Fig. 14a), whichmight be related to southwest warm flow with abundant moisture delivered to the Jianghuai basin. Precipitation occurs within the frontal zone and along thestrong frontogenesis area, being consistent with the airascent in the frontal zone(Fig. 4b). The precipitationrelated to this type is usually referred to as warm frontprecipitation.
 |
| Fig. 14. Distributions of daily precipitation(mm day-1)associated with the four frontogenesis types. The area circledby inner(outer)red curves shows the values of precipitation above the 95%(90%)level of conffidence using a t-test.(a)Warm shear type, (b)cold shear type I, (c)cold shear type II, (d)west wind type, and (e)east wind type. |

Precipitation induced by the cold shear type frontogenesis is the second largest, which occurs south ofthe frontal zone in both cases of cold sub-type I and sub-type II. The precipitation area in sub-type II tiltsmore southward, exhibiting a northeast-southwest distribution, and the precipitation amount is higher thanthat of sub-type I. The intensity of precipitation is related to the ascent of air, the location of the frontalzone, and the warm moist flow. Stronger warm moistflow and stronger updraft are observed in the frontalzone and nearby for the warm shear type and coldshear type II frontogenesis, so stronger precipitationcould be produced in these two types. In the westwind type, the third highest precipitation is produced, which occurs also south of the frontal zone. Affectedby typhoons, relatively low precipitation occurs in areaA in the east wind type.6. Summary
Based on the above analyses, the results can besummarized as follows.
Frontogenesis function values distribute unevenin East China. Kinematic frontogenesis of the different terms has different frontogenesis intensities.The strongest frontogenesis integrated from differentterms of kinematic frontogenesis is observed in theJianghuai area in June and July. In Jiangxi and Hunanprovinces, the tilting frontogenesis dominates; whilein the Jianghuai area, the deformation frontogenesisdominates; and in northern Jiangsu Province, the integrated frontogenesis dominates.
Strong frontogenesis events usually occur frommid-late June to early-mid July of each year, whichcoincides with the Meiyu period over the past decades.Significant interannual variations are observed in theintensity of frontogenesis. The different types of frontogenesis events occur with different frequency and interannual variations. In the Jianghuai area, warmshear frontogenesis occurs with the highest frequency, followed by cold shear type I, and then west windtype.
There are four types of frontogenesis in theJianghuai area of East China. All the four typesof front result from the strong horizontal gradient ofθse in the lower and middle troposphere. The 340-Kcontour of pseudo-equivalent potential temperaturecan be considered as the characteristic line in strongfrontogenesis, which always passes through the largevalue area of frontogenesis function. Southwesterlywinds in the frontal zone originate from the air flowfrom both the Bay of Bengal and the northwesternflank of the western Pacific subtropical high. Convergence is in the frontal zone in the lower troposphere, while divergence in the upper troposphere with thedivergence center located between the center of theSouth Asian high and the westerly flow exit in thenortheast of China. A subtropical frontal zone in theupper troposphere exists above the frontal zone in thelower troposphere, but it is separated from the Meiyufront. Moreover, a subtropical westerly jet accompanies with the subtropical front. Significant differencesare found among the circulation patterns of the different types of frontogenesis, such as the central position and intensity of background cyclone or anticyclone, distribution of divergence/convergence fields, and vertical structure of circulations(Table 3).
Both amounts and distributions of precipitationare closely related to frontogenesis intensity indicatedby the frontogenesis function values. The correlationcoefficients between the time series of daily precipitation and that of the frontogenesis function is as high as0.55. There are some differences in the precipitationdistribution related to different frontogenesis types.In warm shear cases, precipitation occurs within thefrontal zone and distributes in parallel with the strongfrontogenesis belt. In the cold shear type, the secondhighest precipitation is observed. High precipitationin the two sub-types of the cold shear frontogenesisoccurs south of the frontal zone. Particularly, in coldshear sub-type II, precipitation tilts more southward, showing a northeast-southwest distribution.
It should be noticed that the results of this studyare obtained based on high-resolution analysis data.The 11 years of data are good for our investigation onthe climatological characteristics of frontogenesis inEast China. Because longer-term higher-quality dataare not available now, to characterize the frontogenesisin East China more profoundly will be a formidabletask. In addition, the east wind type frontogenesis isnot subject to detailed statistical analysis due to itstoo few occurrences(Table 2), and thus may requireadditional further studies.
Acknowledgments: The daily precipitationdata were provided by the National Climate Center of China Meteorological Administration. TheNCEP/NCAR FNL analysis data were downloadedfrom http://dss.ucar.edu/. All figures employed inthis paper were prepared using the Grid Analysis and Display System(GrADS).
| [1] | Chen, G. T. J., 1992: Mesoscale feature observed in the Taiwan Meiyu season. J. Meteor. Soc. Japan, 70, 497-515. |
| [2] | —, 1994: Large-scale circulation associated with the East Asian summer monsoon and the Meiyu over South China and Taiwan. J. Meteor. Soc. Japan, 72, 959-983. |
| [3] | Ding Yihui, 1992: Summer monsoon rainfall in China. J. Meteor. Soc. Japan, 70(1), 373-396. |
| [4] | —, 1993: The Persistent Torrential Rain in Jianghuai Basin in 1991. China Meteorological Press, 255 pp. (in Chinese) |
| [5] | Fu, J. L., and W. H. Qian, 2011: The structure of a typical Mei-Yu front identified by the equivalent temperature. Atmos. Oceanic Sci. Lett., 4(2), 109113. |
| [6] | Gao Shouting, Zhou Yushu, and Lei Ting, 2002: Structural features of the Meiyu front system. Acta Meteor. Sinica, 16(2), 195-204. |
| [7] | Geng, B., H. Yamada, K. K. Reddy, et al., 2009: Mesoscale development and along frontal variation of a Meiyu/Baiu front and precipitation observed in the downstream region of the Yangtze River. J. Meteor. Soc. Japan, 87(3), 423-457. |
| [8] | Guan Zhaoyong, 1992: Subgeostrophic nonlinear flow and frontogenesis. J. Nanjing Inst. Meteor., 15(4), 525-530. (in Chinese) |
| [9] | — and Han Jie, 2011: Circulation patterns of regional mean daily precipitation extremes over the middle and lower reaches of the Yangtze River during the boreal summer. Climate Res., 50(2), 171-185. |
| [10] | Han Guirong, He Jinhai, Fan Yongfu, et al., 2005: The transfiguration frontogenesis analyses on 0108 landfall typhoon extratropical transition and heavy rain structure. Acta Meteor. Sinica, 63(4), 468-476. (in Chinese) |
| [11] | Jia Yan and Guan Zhaoyong, 2010: The relation between summer precipitation anomalies in Jianghuai basin and interannual variability in the 30-60-day oscillation intensity in subtropical western North Pacific. Chinese J. Atmos. Sci., 34(4), 691-702. (in Chinese) |
| [12] | Kato, K., 1987: Airmass transformation over the semiarid region around North China and abrupt change in the structure of the Baiu front in early summer. J. Meteor. Soc. Japan, 65, 737-750. |
| [13] | Lin Chunyu, 1979: Meiyu season and its forecast in the middle and lower reaches of the Yangtze River. Meteor. Mon., 37(5), 2-8. (in Chinese) |
| [14] | Ninomiya, K., 1984: Characteristics of baiu front as a predominant subtropical front in the summer Northern Hemisphere. J. Meteor. Soc. Japan, 62, 880-893. |
| [15] | Qiu Binghuan and Ding Yihui, 1979: Circulation patterns during Meiyu period in China in 1973. Memoir of the Institute of Atmospheric Physics (No. 7), Science Press, Beijing, 56-83. (in Chinese) |
| [16] | Tao, S. Y., and L. X. Chen, 1987: A review of recent research on the East Asian summer monsoon in China. Monsoon Meteorology. Chang, C. P., and T. N. Krishnamurti, Eds., Oxford University Press, 60-92. |
| [17] | Tao Shiyan, Zhao Yujia, and Chen Xiaoming, 1958: The relationship between Meiyu in Far East and the behaviour of circulation over Asia. Acta Meteor. Sinica, 29(2), 119-134. (in Chinese) |
| [18] | Tao Zuyu and Zheng Yongguang, 2012: Analysis methods on potential temperature, isentropic potential vorticity, front and tropopause. Meteor. Mon., 38(1), 17-27. (in Chinese) |
| [19] | Tu Changwang, 1938: Air mass in China. Memoir of the Institute of Meteorology, 12, 2-3. (in Chinese) |
| [20] | Wang Jianjie and Tao Shiyan, 2002: Structure and formation of Meiyu front in 1998. J. Appl. Meteor. Sci., 13(5), 526-534. (in Chinese) |
| [21] | Wei Fengying and Zhang Jingjiang, 2004: Climatic variation of Meiyu in the middle-lower reaches of Changjiang River during 1885-2000. J. Appl. Meteor. Sci., 15(3), 313-320. (in Chinese) |
| [22] | Wu Rongsheng, 1999: Principles of Modern Synoptic Meteorology. Higher Education Press, Beijing, 121124. (in Chinese) |
| [23] | Xia Yun, Guan Zhaoyong, and Wang Lijuan, 2008: Association of 30-70-day oscillations with the heavy rainfall over Yangtze-Huaihe River valley in summer 2003. J. Nanjing Inst. Meteor., 31(1), 33-41. (in Chinese) |
| [24] | Xie Yibing, et al., 1956: Analysis of several precipitation systems in the second half of the year in China. Acta Meteor. Sinica, 27(1), 1-23. (in Chinese) |
| [25] | Xu Qun, 1965: Meiyu period in the past eight decades in the middle and lower reaches of the Yangtze River. Acta Meteor. Sinica, 35(4), 517-518. (in Chinese) |
| [26] | Yin Dongping, 2010: Analysis of Meiyu front characters of Huaihe valley rainstorms. Meteor. Mon., 36(6), 1-6. (in Chinese) |
| [27] | Zhang Bingchen and Zhang Zhenyue, 1990: Meiyu Frontal Rainstorm in the Middle and Lower Reaches of the Yangtze River. China Meteorological Press, 4-9. (in Chinese) |
| [28] | Zheng Yongguang, 2007: Typical structure, diversity and multi-scale characteristics of Meiyu front. Acta Meteor. Sinica, 65(5), 760-771. (in Chinese) |
| [29] | Zhou Zengkui, 1996: Meiyu in Jianghuai Area. China Meteorological Press, 210 pp. (in Chinese) |
| [30] | Zhu Kezhen, 1934: Southeast monsoon and rainfall in China. Acta Geographica Sinica, 1(1), 1-27. (in Chinese) |