 2013, Vol. 27
The Chinese Meteorological Society
Article Information
- LIU Lin, CHEN Jing, CHENG Long, LIN Chunze, WU Zhipeng. 2013.
- Study on Ensemble-Based Forecast of Extremely Heavy Rainfalls in China: Experiments for July 2011 Cases
- J. Meteor. Res., 27(2): 170-185
- http://dx.doi.org/10.1007/s13351-013-0203-y
-
Article History
- Received August 1, 2012
- in final form December 31, 2012


2. Numerical Weather Prediction Center, Beijing 100081;
3. Chengdu University of Information Technology, Chengdu 610225
The past decades have witnessed the great impacts of extreme weather and climate events on humansociety and the environment. There are a number ofmethods to define extreme events(Easterling et al., 2000). Beniston et al.(2007)pointed out that the extreme events can be divided into three types:(1)theevents that have a relatively larger or smaller intensity;(2)the events that rarely take place; and (3)the eventsthat lead to serious social losses. In the third and fourth Intergovernmental Panel on Climate Change(IPCC)assessment reports(IPCC, 2001, 2007), theabove definition(2)was adopted to identify extremeevents, i.e., the small probability events that usuallyoccur only 10% or even less of such weather phenomena in a particular place at a certain time. This definition avoids the large differences induced by the absolute intensity of an extreme event in different regions.
Extremely heavy precipitation(abbreviated asextreme precipitation or extreme rainfall hereafter)has been a subject of many studies. Most of thesestudies employed an extreme precipitation index toanalyze the features and variations of the extremeevents based on observations. Yamamoto and Sakurai(1999), Groisman et al.(1999), and Osborn et al.(2000)investigated the long-term variations of precipitation and heavy precipitation, and showed that thereis an increasing trend in occurrence of extreme precipitation events. Yan and Yang(2000)noted thatthe drought in northern China reflects a significantreduction in trace precipitation events. Huang et al.(2003)detected that there is a continuous drought inNorth China and an increasing trend in summer monsoon precipitation over the Yangtze and Huaihe Riverbasins since 1976. Zhai and Pan(2003), Qian and Lin(2005), and Zhang and Wei(2009)studied thevariations of extreme precipitation in different areasin China, and obtained similar results. They foundthat the frequency of extreme precipitation events increased in Southwest, northern Northwest, and EastChina, but it decreased in North and Central China.Li et al.(2008)showed that summer precipitationin East China is mainly related to the intensity ofrainstorms which produce more than 60% of the total precipitation. They also found that the amount and frequency of the rainfalls, the frequency of theextreme precipitation events, and the intensity of therainstorms have increased in summer over the YangtzeRiver basin. Wang et al.(2008)used a regionalcoupled general circulation model(GCM)to simulatethe extreme precipitation events in summer in China.Their results showed that the regional coupled GCMwas able to simulate the spatial distribution of themean threshold of the extreme precipitation. Thestudy from Lu et al.(2009)showed that the initialmoisture conditions had a great impact on the timewhen the maximum precipitation occurred.
As we know, the atmosphere is a chaotic system. Uncertainty of weather forecast is an inherentproperty of the chaotic system(Ye et al., 2006). Extreme precipitation is a small probability event thatoccurs with a great deal of uncertainty. Prediction ofextreme precipitation is a difficult task. As a newmethod of probabilistic forecasting, ensemble forecasting provides a new prospect for small probability extreme events(Li and Chen, 2002; Chen et al., 2005). Probability forecasting has been used in studies of extreme precipitation events for a long time.Steven and Jun(2001)used the short-range ensemble forecasting system of NCEP to simulate a snowstorm in North Carolina on 25 July 2000. They foundthat most ensemble members could successfully forecast this snowstorm. Sobash et al.(2011)indicatedthat the "neighborhood"(Theis et al., 2005)technique will be even more valuable in probabilistic forecasting of extreme events when implemented within aconvection-allowing ensemble forecasting system.
So far, little such work has been done in China.Jiang et al.(2009)examined seven GCMs and fiveensemble forecast models that are referred to in thefourth IPCC assessment. They pointed out that theGCMs were able to simulate the spatial distribution ofthe extreme precipitation index and to reflect its regional linear tendency in China. They also found thatthe skill of the ensemble forecast is better than thatof the single model. Based on the Bayesian method, Chen et al.(2010)improved the heavy rainfall ensemble prediction by using climatological rainstorm observations from 147 stations in Sichuan. They showedthat this method can eliminate the false prediction tosome extent. By adopting four multi-model ensembleschemes to produce the probability density function(PDF)prediction of summer rainfalls over East Chinafrom 1960 to 2005, Li(2011)reported that the optimal ensemble scheme can well calibrate the originaldeterministic prediction, and the ensemble predictionsare better or approximately equal to the climatological prediction.
Lalaurette(2002)developed an extreme forecastindex(EFI)based on the ECMWF ensemble prediction. The principle of the EFI is to compute the continuous probability differences of the cumulative distribution function(CDF)between the model climate and the ensemble prediction system. The results of Lalaurette(2002)indicated that EFI can be used to wellpredict the extreme events even five days in advance.Lalaurette(2003)revised the EFI formula by means ofthe Anderson and Darling(1952)theory and improvedthe sensitivity of EFI to extreme events. Ervin(2006)regenerated the CDF with ERA40 reanalysis and improved the EFI forecast skill.
Research on the ensemble-based forecast of extreme events is still at its preliminary stage in China.Xia and Chen(2012)evaluated the ensemble forecastmethod in predicting the extreme low temperatureevent in January 2008 with the T213 ensemble forecast product. They found that the EFI has a goodability to identify the extreme cold events 3-5 daysin advance, and the forecast skill gradually decreasedwith the increase of the forecast lead time. Nonetheless, the application of EFI to predictions of otherextreme events(e.g., extreme precipitation, extremestrong winds, etc.)remains unattended. It is knownthat precipitation is a non-continuous variable, whichis different from temperature. Does the EFI still workfor the prediction of extreme rainfalls?
In this paper, we propose a method for forecastof extreme rainfalls using the precipitation productfrom the China Meteorological Administration(CMA)T213 global ensemble prediction system(EPS). Wewill analyze the characteristics of the CDF derivedfrom the T213 EPS forecast precipitation data incomparison with that from the observed precipitation data. After that, we will establish a mathematical model of the extreme precipitation forecast index(EPFI), and the skill of the index will be verified bysimulations of several extreme rainfall events that happened in China in July 2011.2. Data
In this paper, daily 24-h cumulative rainfall observations at 2412 stations in China during June-Augustof 2001-2011 were used(Fig. 1a). The data wereprovided by the National Meteorological InformationCenter of CMA. The precipitation product from theT213 EPS includes the data in July 2007 and the datain June-August of 2008-2011 at 24-168-h forecast leadtimes on 0.5625±×0.5625± grids(Fig. 1b).
Figure 1a shows the geographic location of theobservation stations. Figure 1b gives the grid mapof the T213 model over China. It can be seen thatthe stations are unevenly distributed. They are intensively distributed in the east and south of Chinabut sparsely distributed in the northwest, especiallyin Xinjiang and the Tibetan Plateau. In this paper, the Cressman method(Chen and Shi, 2010)was usedto interpolate the rainfall data at the 2412 stationsonto the T213 grid points(n = 3182), as shown inFig. 1b.
 |
| Fig. 1. Spatial distributions of(a)the 2412 rainfall observation stations and (b)the model grids. The stars in(b)denote grid points that are representative for the eight sub-regions under study . |
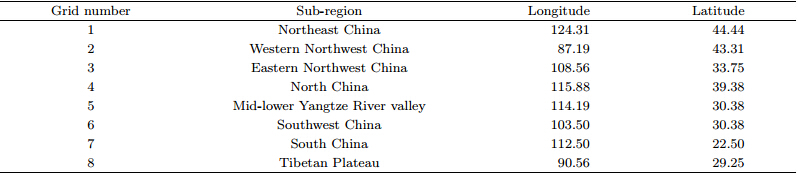
Prior to studying the method for ensemble-basedprediction of extreme rainfalls, we now compare thefeatures in the observed rainfall and the T213 EPSforecast extreme precipitation. The differences in thegeographic distribution of extreme precipitation and in the error distribution of the ensemble forecast extreme precipitation are examined, based on which amore reasonable prediction model and forecast indexcan be established for extreme rainfalls in China. TheCDFs of the extreme rainfalls are different in differentregions because of the topography in China. Thus, eight different climatic sub-regions of China are demarcated(Fig. 1b and Table 1)(Chen and Shao, 1991). For simplicity, we select a representative gridpoint in each sub-region, with its location denoted bya star in Fig. 1b.
 |
The extreme precipitation is defined by the percentile method(Zhai and Pan, 2003). First, the observed daily precipitation at each grid point duringJune-August of 2001-2010 is arranged in an ascending order. Then, the 10-yr mean 99th percentile of theprecipitation observations is assigned as the thresholdof the extreme precipitation, which only occurs whenthe daily precipitation exceeds the threshold.
The model precipitation serial is derived from theensemble forecast product. It covers the period fromJune to August of 2008-2010. The length of this dataserial is 4140, and the threshold is the 99th percentileof the model climatic precipitation.
The Γ distribution is used to fit the model precipitation distribution(Liu and Wu, 2005)accordingto the skewed probability distribution of the dailyobserved summer precipitation. Figure 2 shows theprecipitation probability distribution of the ensembleforecast at the eight points at 24-168-h forecast leadtimes. It can be seen that the probability density distribution of the 24-168-h precipitation forecast at different grid points shows a consistent trend. But theprobability density distribution for different effectiveforecast times is slightly different. Overall, the differences in the probability density distribution of different forecast lead times are obvious when precipitationamounts to 10-40 mm. The probability density distribution of 24 h is the largest. As the forecast leadtime increases to 144 h, the probability density of themodel climate precipitation gradually decreases. Theprobability density of 168-h forecast precipitation isimproved when compared with the probability densityof 144 h. The probability density of the precipitationgreater than 40 mm gradually decreases and tends toapproach zero when the forecast time increases. It isworth noticing that the precipitation probability density of the 168-h forecast precipitation is substantiallyconstant. This means that the frequencies of heavy and moderate rains gradually decrease and the frequency of light rain increases when the forecast leadtime increases. The probability density of 168-h forecast precipitation of different intensity scales tends tostabilize.
 |
| Fig. 2. Precipitation probability distribution of the ensemble forecast system at the representative grid points of the eight sub-regions(a-h). |
The observed and the ensemble forecast precipitation data during June-August of 2008-2010 are usedto compare the characteristics of the observed and themodel extreme precipitation. The spatial distributionsof the observed and the model extreme precipitationare obtained according to the definition in Section 3.1.Figure 3a shows the observation and Figs. 3b-3d givethe model results at 24-168-h forecast lead times, respectively.
 |
| Fig. 3. Spatial distributions of(a)observed and (b)24-, (c)96-, and (d)168-h ensemble forecast extreme precipitation. |
It can be seen that the horizontal distribution ofthe forecast extreme precipitation is in general consistent with that of the observation. The precipitation gradually decreases from Southeast to NorthwestChina. The maximum rainfall centers in the modelforecasts deviate from those in the observation. Thereare five centers in the observed extreme precipitation, located in the adjacent area of Sichuan and Shanxi, Hubei and Hunan, the Dabie Mountain, Guangdong, and other coastal areas. But the locations of the modelforecast precipitation centers are different, with themaximum rainfall appearing in the southeast of theTibetan Plateau and overestimated by model forecasts, and the maximum rainfall in the coastal areasin observation now near Jiangsu, Zhejiang, and Fujianprovinces in the ensemble forecasts. The other largecenters of the model extreme precipitation are in accordance with those of the observation. Figure 3 alsoshows that the model extreme precipitation is obviously less than the observed, especially in East China, and it decreases with the increase of the forecast leadtime.4. Methodology of ensemble-based extreme rainfall forecast4.1 Theory
The ensemble forecast of extreme rainfalls isbased on the continuous differences of CDF betweenthe historical model climate and the ensemble mem-bers, which could imply whether the extremes occur.We now take the CDFs of 48- and 96-h forecasts aswell as the CDF of the model climate as examples toexplain this theory. Figure 4 shows a schematic diagram of ensemble-based extreme precipitation forecast. In Fig. 4, solid lines represent the model climateCDF curves, dashed lines represent the CDFs of theensemble forecasts; green lines are for 48-h and blacklines for 96-h ensemble forecasts. Figure 4b shows thecorresponding probability density distribution. Thehistorical model climate at 48 and 96 h is separatelycollected by 48- and 96-h forecast precipitation of eachT213 ensemble member in July of 2007-2010, and theserial length is 1860(4 yr × 31 days × 15 ensemblemembers). The 48- and 96-h precipitation forecastsby the T213 EPS on 20 July 2011 are chosen as theensemble forecast distribution serials, each of which iscomposed of 15 ensemble forecast members.
 |
| Fig. 4. Schematic diagrams of ensemble-based extreme precipitation forecast.(a)Vertical axis represents cumulativeprobability; lateral axis represents precipitation. Solid line represents the CDF curve of the model climate; dashed linerepresents the CDF curve of the ensemble forecasts(green line for 48 h and black line for 96 h).(b)Vertical axisrepresents probability density; lateral axis represents precipitation. Solid line represents the PDF curve of the modelclimate; dashed line represents the PDF curve of the ensemble forecasts(green line for 48 h and black line for 96 h). |
As seen in Fig. 4a, the model climate CDF at96 h is CDF1, and the CDF of the ensemble forecastsis CDF2 when precipitation is Pr. The difference between CDF1 and CDF2 is greater than zero. This indicates that the ensemble forecast probability is greaterthan the model history when precipitation is greaterthan Pr. The area between the cumulative probability curve of the 96-h ensemble forecast and the modelhistory is the continuous integration of the differencebetween the two curves within the 96-h forecast precipitation range. If the integration is greater than zero, the ensemble forecast precipitation is more than themodel history. If the cumulative probability of theensemble forecast precipitation tends to distribute atthe tail(right side)of the model climatic CDF curve, the area increases. It can be seen from Fig. 4a thatthe area between the cumulative probability curve ofthe 48-h ensemble forecast and the model history islarger than that of the 96-h ensemble forecast. Figure 4b gives the probability density at 48 and 96 h, corresponding to Fig. 4a. It can be found that thetotal amount of the 48-h ensemble forecast precipitation in the concentrated region is more than that of96-h forecast precipitation, and the 48-h precipitationis heavier than the 96-h precipitation. Thus, the 48h ensemble forecast has a better skill for predictingheavy rains than the 96-h ensemble forecast.
The above analysis shows that the continuousdifferences between the cumulative probability of themodel history and the ensemble members can be usedto measure the precipitation intensity. If the differenceis positive, more precipitation and wet conditions maydominate, and vice versa.4.2 Mathematical model of the extreme precipitation forecast index based on the Anderson-Darling test
Based on the theory of Aderson and Darling(1952), Lalaurette(2002)defined the EPFI formula:
where p is the CDF of the historical model climate.If the climatic distribution is put in an ascending order, each percentile represents a probability thresholdf(p). In that way, f(0) and f(1) separately correspondto the minimum and maximum of the climate serial, and so on. Ff(p) is taken as the cumulative probability of the ensemble forecast. EPFI is the sum of thedifference between the cumulative probability of thehistory and the ensemble forecast at each percentile.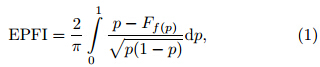
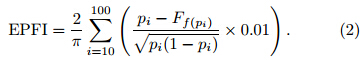
 is the weight coefficients. If p = 1/2, theweight coefficients is the smallest. If p = 0 or 1, theweight coefficients is the biggest. This could improvethe EPFI sensitivity to the extreme events distributedat the tail of the cumulative probability curve. Tosome extent, it can make a prediction of the extremeevent. Equation(2)below is a discrete form, wherepi = i=100(i = 0, 1, 2, …, 100).It can be easily found from Eq.(1)that EPFI has someproperties as follows: EPFI is a real number between-1 and 1. If the results of all ensemble members areless than the minimum climatic probability(Ff(pi) is1 for all Pi), EPFI is -1. This means that the extremedrought may occur. If the results of all ensemble members are more than the minimum climatic probability(Ff(pi) is 0 for all Pi), EPFI is 1. This implies thatan extreme precipitation event may occur. The closerthe EFPI is to -1(+1), the greater probability of theextreme drought(precipitation)event may happen.
The CDF of the model climate is an importantcomponent of EPFI. In this paper, we adopt the modelclimate CDF of T213 ensemble forecast precipitationfrom 2007 to 2010 with the Lalaurette(2002)method. Xia and Chen(2012)found that the T213 model forecast has different errors for different forecast periodsof validity. In the first section, it has been found thatthe ensemble forecast precipitation has different probability densities for different forecast lead times. Thefrequency of light rain increases with the increase ofthe forecast lead time. This paper selects daily precipitation of the T213 ensemble forecast in July from2007 to 2010, and 7 model climate serials are generated at each grid point with the length of 1860. In thefollowing, the climate CDF scheme will be referred toas T213-P1 in order to distinguish it from the schemein Section 6.
The CDFs of 24-168-h ensemble forecasts are calculated using the daily precipitation from T213 ensemble forecasts in July from 2007 to 2010. The length ofthese serials is 15. The EPFI is computed using Eq.(2). The derived EPFI could then provide the basisfor determining the critical threshold of extreme precipitation in the next sub-section.4.3 Method for determining the critical threshold of the EPFI
The above analysis indicates that extreme precipitation/rainfall may occur when EPFI is positive. Butthe forecasters need to know when they can release analarm for extreme heavy rainfalls based on the EPFI.In this section, we focus on the method for determining the critical threshold of the EPFI. Extreme rainfalls can be seen as dichotomous(yes/no). We can finda certain approach to determine the critical threshold.If EPFI is greater than this threshold, the forecastercan make a warming of extreme rainfall occurrence.How to determine this critical threshold?
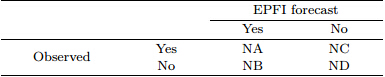
It is known that the Threat Score(TS) and Bias(BS)are two most commonly used indices in the assessment of precipitation forecast. Based on the contingency table of dimorphic distribution(Table 2)of areal extreme rainfall event and the EPFI forecast, theTS, BS, hit rate(HR), and false alarm rate(FAR)canbe obtained by using Eqs.(3)-(6).
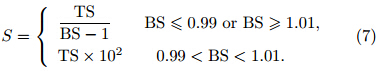
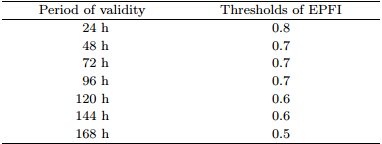
We design an S index for identifying the criticalthreshold of EPFI with consideration of the physicalsignificance of the TS and BS. As seen in Eq.(7), the S index is proportional to the TS and inverselyproportional to jBS-1j. The way of using S index toidentify the critical threshold is to take 10 numbersof 0.1, 0.2, 0.3, …, and 1.0 as the reference threshold for releasing an alarm with the EPFI. The S indices of these 10 reference thresholds are calculated byEq.(7). Figure 5 gives 4-yr averaged S indices of the10 reference thresholds for 24-168-h forecasts. Then, the EPFI corresponding to the maximum S index isselected as the critical threshold for a certain forecast period of validity. The critical thresholds of the24-168-h extreme precipitation forecast are shown inTable 3. It can be found that the critical thresholdof EPFI gradually decreases from 0.8 to 0.5 while theforecast period of validity increases to 168 h.


 |
| Fig. 5. Variations of the S index with different EPFI thresholds for 24-168-h forecast periods of validity. |
The EPFIs at each model grid point for sevenforecast periods of validity are calculated by Eq.(2)based on the CDF of the ensemble forecasts and themodel climate during 15-31 July 2011. Table 4 showsthe mean statistics of the extreme rainfall forecast.The TS gradually decreases with the increase of theforecast lead time. The TS of 24 h is the highest(0.15). The bias is proportional to the forecast period of validity, and the miss rate slightly increaseswith the increase of the forecast time while the hitrate decreases from 0.321 to 0.139. The false alarmrate increases to 0.044 when the forecast time reaches168 h.
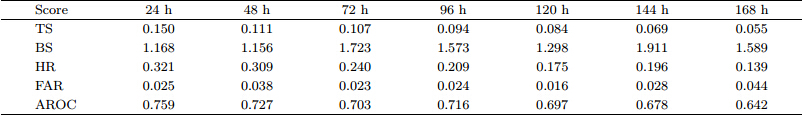
Relative Operating Characteristic(ROC)is an effective measure to evaluate the probabilistic forecast(Mason and Graham, 2002). It is obtained by plottingthe hit rate and false alarm rate of different probabilities(EPFI can be divided into 10 grades)into onecurve. If the curve is above the diagonal, the forecastskill is positive. The larger the area of ROC is, the better the forecast is. Figure 6 gives the mean ROC ofthe EPFI. The ROC is above the diagonal for forecastperiod of 24-168 h. It is closer to the diagonal with theincrease of the forecast period. This indicates that allof the 24-168-h forecasts have positive forecast skills, which drop with the increase of the forecast period.The area of ROC(AROC)can be found in Table 4.
 |
| Fig. 6. The average Relative Operating Characteristic curve valid for the EPFI test. Each point of the curve corresponds to a different EPFI threshold. |
In this section, we assess the extreme precipitation forecast on 24 July. The maximum precipitationappeared in Beijing, Tianjin, Liaoning and nearby. Onthat day, precipitation in some areas in Beijing wasover 100 mm and the areal mean was 62 mm. Themaximum cumulative precipitation occurred near thenorth of the Miyun Reservoir with 244 mm rainfall.Two deaths and one missing person were blamed onthis extreme event. The precipitation in the east ofInner Mongolia and Sh and ong was more than 50 mm.According to the statistics, extreme rainfall occurredat a total of 76 grid points on 24 July, which accounts2.39% of the total grids(Fig. 7). Most of these gridpoints are in the north of Inner Mongolia, Beijing, Hebei, Tianjin, central Sh and ong, the west and thesouth of Tibet.
 |
| Fig. 7. Distribution of extreme precipitation grids on 24 July 2011. |
Figure 8 shows distributions of 48-120-h forecastextreme rainfall. The start time of the forecasts is 0000UTC 22 July, 0000 UTC 21 July, 0000 UTC 20 July, and 0000 UTC 19 July, respectively. The shaded areasare the regions where extreme rainfall appears judgedby EPFI. Compared with the observation, the 48- and 72-h EPFIs correctly predicted the extreme events inthe eastern Inner Mongolia, Beijing, Hebei, Tianjin, and western Tibet. But they missed the events in central Sh and ong and south of Tibet. The 72- and 96-hforecasts present similar results. The 120- and 144-hforecasts have also correctly predicted the events in theeastern Inner Mongolia, Beijing, Hebei, Tianjin, and western Tibet, but there are some false alarms whichincrease with extension of the forecast period in SouthChina. The distribution of 24-96-h EPFI is very closeto the observations(figures of the first few forecasttimes are omitted). Although the forecast skills of the120-h or even longer lead times slightly decrease, theensemble forecast approach still can predict the extremes in most regions at quite early lead times.
 |
| Fig. 8. Distributions of EPFI on 24 July 2011 at(a)48-, (b)72-, (c)96-, and (d)120-h forecast lead times. |
The above analyses show that the EPFI is indeedable to make forecasts of extreme rainfalls even 3-7days in advance, but the EPFI is unrealistically largerin South China. There are also some false alarms inthe 120-h forecast in South China. The 48-120-h forecasts miss the extreme events in central Sh and ong.This may result from the fact that the model climateCDF only contains precipitation information in July.At that time, the rain belt jumps northward to NorthChina, following the movement of the subtropical high, which leads to the increase of rainfall in North China and the decrease of rainfall in South China and themid-lower reaches of Yangtze River. According to theclimate CDF in South and Central China, the frequency of light rain increases. In North China, theoccurrence probability of heavy rain increases. Thus, the EPFI is greater in South and Central China, and smaller in North China.6. Impact of the model climatic CDF on the extreme precipitation forecast
It can be perceived from Eqs.(1) and (2)thatthe model climatic CDF has a great impact on the ensemble forecast of extreme precipitation. It is knownthat the rainy season in China falls mainly in June-August. The available historical model data in Chinacover a shorter time period than the ECMWF data.Accordingly, we compile a second set of model climatedata. Daily precipitation forecast product from theT213 EPS at each grid point in China during June-August of 2008-2010 is selected. Seven independentmodel climate series(24-168 h)are generated at eachgrid point with a length of 4140(n = 3 yr × 92 days× 15 members), which is referred to as T213-P2 in thefollowing.
Comparison between the CDFs of the two modelclimate datasets, i.e., T213-P2 and T213-P1, for 72-hforecast(the results of other forecast times are similar)in South China, North China, and the mid-lowerreaches of Yangtze River is displayed in Fig. 9. Thefrequencies of light to moderate rains in North Chinaincrease and the CDF curve is closer to y-axis. InSouth China and the mid-lower reaches of YangtzeRiver, the frequencies of moderate and heavy rainsincrease and the CDF curve is closer to x-axis. Thistrend is more obvious in South China. These resultssuggest that light rains occur more often in NorthChina and moderate to heavy rains happen less frequently in central and South China based on T213-P2.
 |
| Fig. 9. Cumulative probability curves of the 72-h model climate precipitation datasets T213-P1(solid) and T213-P2(dashed)for(a)North China, (b)mid-lower reaches of Yangtze River, and (c)South China. |
Figure 10 compares the EPFI maps from the twoclimate datasets T213-P1 and T213-P2 at 48 and 120h, respectively. We can see that for 48-h forecasts, T213-P1 scheme missed the extreme precipitation incentral Sh and ong while T213-P2 successfully capturedit and set the alarm. For 120-h forecasts, the falsealarm from T212-P1 appeared in a larger area in SouthChina while the false alarm from T213-P2 decreasedobviously in this area, suggesting an improved resultby using T213-P2. The other experiments producedsimilar results. Overall, T213-P2 reduces the missesin North China due to smaller EPFI, and also reducesthe false alarms in South China.
 |
| Fig. 10. EPFI maps derived from the two model climate precipitation datasets T213-P1(a, c) and T213-P2(b, d)on24 July 2011 for 48-(a, b) and 120-h(c, d)forecasts. |
The statistical results from comparisons of thetwo model climate datasets are given in Fig. 11. Boththe TS and HR based on T213-P2 are higher thanthose based on T213-P1. The AROC of T213-P2 isalso higher than T213-P1(Table 5). However, thefalse alarm rate and the bias of T213-P2 are slightlyhigher than T213-P1, which means that although thehit rate of T213-P2 dwarfs that of T213-P1, its falsealarm rate is defeated by that of T213-P1. Overall, the T213-P2 climate is better than the T213-P1.
 |
| Fig. 11. Average test results of the two model climates of precipitation. |

Comparisons of the climatic CDF between the twomodel climate datasets show that T213-P2 has an improved EPFI forecast skill than T213-P1. T213-P2 hasa higher probability to predict the extremes(althoughit also has a higher false alarm rate). This may bebecause the raining season in China covers three continuous months(June-August); T213-P2 uses threemonth data and thus contains more precipitation information than T213-P1 does, which uses only onemonth data. It is therefore inferred that the modelclimatic CDF should contain as much objective precipitation information as possible.7. Summary
Extremely heavy precipitation(abbreviated asextreme precipitation/rainfall throughout the text)isa small probability event that occurs with a great dealof uncertainty. It is very difficult for its accurate prediction. In this study, the differences between theobserved and model forecast precipitation CDFs areanalyzed with consideration of characteristics of theT213 ensemble forecast precipitation. According tothe Anderson-Darling test, an EPFI is established onthe basis of the T213 ensemble forecast. The impactof the historical model CDF on the EPFI is examinedthrough comparisons between experimental results onthe extreme precipitation events that occurred in July2011. Preliminary results are summarized as follows.
(1)Precipitation forecasts from the T213 ensemble prediction system show that the differences in theprobability density distribution for different forecastlead times are obvious when the forecast precipitationis between 10 and 40 mm. Precipitation density decreases with the growth of the forecast time. Whenforecast rainfall is over 40 mm, the precipitation probability density is close to zero for different forecasttimes. When forecast precipitation is less than 10 mm, the precipitation probability increases. For precipitation events of all intensity levels, the precipitationprobability begins to stabilize after the forecast timereaches 168 h.
(2)Comparisons between the observed and themodel forecast precipitation show that the horizontalpattern of the model precipitation is close to the observation, but the model precipitation is less in magnitude than the observation. Besides, extreme precipitation decreases with the growth of the forecast time.There are some differences in the center location ofthe extreme rainfalls. The observed centers are inGuangdong Province and nearby areas whereas themodel centers are near Jiangsu, Zhejiang, and Fujianprovinces. Over the Tibetan Plateau, there is a fakecenter of extreme rainfall.
(3)The extreme precipitation forecast index(EPFI)has taken full advantage of the tail information of the CDF curve of ensemble forecasts. Theresults show that EFPI has a good ability to identifyextreme precipitation, which enables an alarm to beset 3-7 days ahead of the extreme event. The EPFIforecast skill decreases with the increase of the forecast time.
(4)By comparing the CDF of two model climatedatasets, we find that the forecast skill of the CDFthat contains historical model precipitation information from June to August is better than the CDF thatcontains only the July precipitation information. Thismay be associated with the actual length of the threemonth rainy season of China. Thus, it is better for themodel climatic CDF to include objective precipitationinformation as much as possible.
It should be pointed out that in this paper, weonly obtained 5-yr data of the T213 ensemble forecast.How to take advantage of the existing data to generate a better model climatic CDF in order to improvethe forecast skill of the EPFI on the extreme rainfallsneeds to be further studied.
| [1] | Anderson, T., and D. Darling, 1952: Asymptotic theory of certain goodness of fit criteria based on stochastic processes. Annals of Mathematical Statistics, 23, 193-212. |
| [2] | Beniston, M., D. B. Stephenson, O. B. Christensen, et al., 2007: Future extreme events in European climate: An exploration of regional climate model projections. Climatic Change, 81(Suppl. 1), 71-95. |
| [3] | Chen Fei and Shi Ping, 2010: Assimilation of hydrographic data in the northern South China Sea based on the Cressman objective analysis. Journal of Tropical Oceanography, 29(4), 1-7. (in Chinese) |
| [4] | Chen Longxun and Shao Yongning, 1991: Preliminary analysis of climatic change during the last 39 years in China. J. Appl. Meteor. Sci., 2(2), 164-174. (in Chinese) |
| [5] | Chen Jing, Xue Jishan, and Yan Hong, 2005: A new initial perturbation method of ensemble mesoscale heavy rain prediction. Chinese J. Atmos. Sci., 29(5), 717-726. (in Chinese) |
| [6] | Chen Zhaoping, Feng Hanzhong, and Chen Jing, 2010: Application of Sichuan heavy rainfall ensemble prediction probability products based on Bayesian method. Meteor. Mon., 36(5), 22-39. (in Chinese) |
| [7] | Easterling, D. R., G. A. Meehl, C. Parmesan, et al., 2000: Climate extremes: Observations, modeling, and impacts. Science, 289(5487), 2068-2074. |
| [8] | Evrin, Z., 2006: Recent developments in extreme weather forecasting. ECMWF Newsletter No. 107-Spring, 8-17. |
| [9] | Groisman, P. Y, T. R. Karl, D. R. Easterling, et al., 1999: Changes in the probability of heavy precipitation: Important indicators of climatic change. Climatic Change, 42, 243-283. |
| [10] | Huang Ronghui, Chen Jilong, Zhou Liantong, et al., 2003: Studies on the relationship between the severe climatic disasters in China and the East Asian climate system. Chinese J. Atmos. Sci., 27(4), 770-788. (in Chinese) |
| [11] | IPCC, 2001: Climate Change 2001: The Science of Climate Change. Contribution of Working Group I to the Third Assessment Report of the Intergovernmental Panel on Climate Change. Houghton, J. T., Y. Ding, D. J. Griggs, et al., Eds., Cambridge University Press, Cambridge, United Kingdom and New York, NY, USA, 881 pp. |
| [12] | —, 2007: Climate Change 2007: The Physical Science Basis. Contribution of Working Group I to the Fourth Assessment Report of the Intergovernmental Panel on Climate Change. Solomon, S., D. Qin, M. Manning, et al., Eds., Cambridge University Press, Cambridge, United Kingdom and New York, NY, USA, 996 pp. |
| [13] | Jiang Zhihong, Chen Weiling, Song Jie, et al., 2009: Projection and evaluation of the precipitation extreme indices over China based on seven IPCC AR4 coupled climate models. Chinese J. Atmos. Sci., 33(1), 109-120. (in Chinese) |
| [14] | Lalaurette, F., 2002: Early detection of abnormal weather conditions using a probabilistic extreme forecast index. Quart. J. Roy. Meteor. Soc., 129, 3037-3057. |
| [15] | —, 2003: Two proposals to enhance the EFI response near the tails of the climate distribution. http://www.ecmwf.int/products/forecasts/efi¡guide. pdf, 1-8. |
| [16] | Li Fang, 2011: Probabilistic seasonal prediction of summer rainfall over East China based on multi-model ensemble schemes. Acta Meteor. Sinica, 25(3), 283292, doi: 10.1007/s13351-011-0304-4. |
| [17] | Li Hongmei, Zhou Tianjun, and Yu Rucong, 2008: Analysis of July-August daily precipitation characteristics variation in eastern China during 1958-2000. Chinese J. Atmos. Sci., 32(2), 358-370. (in Chinese) |
| [18] | Li Zechun and Chen Dehui, 2002: The development and application of the operational ensemble prediction system at National Meteorological Center. J. Appl. Meteor. Sci., 13(1), 1-15. (in Chinese) |
| [19] | Liu Xuehua and Wu Hongbao, 2005: Probability distribution of summer daily precipitation in China. Trans. Atmos. Sci., 29(2), 173-180. (in Chinese) |
| [20] | Lu Ping, Yu Rucong, and Zhou Tianjun, 2009: Numerical simulation on the sensitivity of heavy rainfall over the western Sichuan basin to initial water vapor condition. Chinese J. Atmos. Sci., 33(2), 241-250. (in Chinese) |
| [21] | Mason, S. J., and N. E. Graham, 2002: Areas beneath the relative operating characteristic (ROC) and relative operating level (ROL) curves: Statistical significance and interpretation. Quart. J. Roy. Meteor. Soc., 128, 2145-2166. |
| [22] | Osborn, T. J., M. Hnhne, P. D. Jones, et al., 2000: Observed trends in the daily intensity of United Kingdom precipitation. Int. J. Climatol., 20, 347364. |
| [23] | Qian, W., and X. Lin, 2005: Regional trends in recent precipitation indices in China. Meteor. Atmos. Phys., 90(2), 193-207, doi: 10.1007/s00703004-0101-z. |
| [24] | Steven, T. M., and D. Jun, 2001: Application of the NCEP/EMC short range ensemble forecast system (SREF) to predicting extreme precipitation events. the 81st AMS Annual Meeting, Amer. Meteor. Soc., Albuquerque, NM, July, P1.25, 64-70. |
| [25] | Sobash, R. A., et al., 2011: Probabilistic forecast guidance for severe thunderstorms based on the identification of extreme phenomena in convection-allowing model forecasts. Wea. Forecasting, 5(26), 714-728. |
| [26] | Theis, S. E., A. Hense, and U. Damrath, 2005: Probabilistic precipitation forecasts from a deterministic model: A pragmatic approach. Meteor. Appl., 12, 257-268. |
| [27] | Wang Zhifu, et al., 2008: Analysis of numerical simulation on extreme precipitation in China using a coupled regional ocean-atmosphere model. Plateau Meteor., 1(2), 37-50. (in Chinese) |
| [28] | Xia Fan and Chen Jing, 2012: The research of extreme forecast index based on the T213 ensemble forecast and the experiment in predicting temperature. Me-teor. Mon., 8(12), 1513-1522. (in Chinese) |
| [29] | Yamamoto, R., and Y. Sakurai, 1999: Long term intensification of extremely heavy rainfall intensity in recent 100 years. World Resour. Rev., 11, 271-281. |
| [30] | Yan Zhongwei and Yang Chi, 2000: Geographic patterns of extreme climate changes in China during 19511997. Climatic Environ. Res., 5(3), 267-272. (in Chinese) |
| [31] | Ye Duzheng, Yan Zhongwei, et al., 2006: A discussion of future system of weather and climate prediction. Meteor. Mon., 32(4), 3-8. (in Chinese) |
| [32] | Zhai Panmao and Pan Xiaohua, 2003: Change in extreme temperature and precipitation over northern China during the second half of the 20th century. Acta Geographica Sinica, 58(Suppl.), 1-10. (in Chinese) |
| [33] | Zhang Ting and Wei Fengying, 2009: Probability distribution of precipitation extremes during raining seasons in South China. Acta Meteor. Sinica, 67(3), 442-451. (in Chinese) |