 2013, Vol. 27
The Chinese Meteorological Society
Article Information
- JIANG Haimei, LIU Shuhua, LIU Heping. 2013.
- Spectra and Cospectra of Turbulence in an Internal Boundary Layer over a Heterogeneously Irrigated Cotton Field
- J. Meteor. Res., 27(2): 233-248
- http://dx.doi.org/10.1007/s13351-013-0208-6
-
Article History
- Received April 30, 2012
- in final form December 5, 2012


2. Department of Atmospheric and Oceanic Sciences, School of Physics, Peking University, Beijing 100871, China;
3. Department of Civil and Environmental Engineering, Washington State University, Pullman, WA 99164, USA
Large eddies greatly disturb the atmospheric surface layer(ASL) and play an important role in thetransport of energy and scalar fluxes between theground and the atmosphere. Large eddies have manysources, such as surface inhomogeneities, topography, and synoptic weather systems. The contribution toeddy flux by low frequency eddies has drawn considerable scientific attention. Some studies have suggested that low frequency eddies contribute approximately 10%-20% of the total flux(Sakai et al., 2001;Kang and Davis, 2007, 2008, 2009; Zhang et al., 2010), while others have found no significant fluxes of scalarsor momentum at horizontal scales greater than 10km(Lenschow and Sun, 2007). Previous work reveals that large eddies occurring over different underlying surfaces make different contributions to surfaceatmosphere exchange of momentum, heat, and scalars.Sakai et al.(2001), Vickers and Mahrt(2003), Foken(2008a), and others analyzed the importance of lowfrequency contributions to turbulent fluxes and energybalance closure; however, both the mechanism underlying large eddies and the influence of these eddies onfluxes remain unclear. The existence of large eddies isgenerally thought to be one of the main uncertaintiesin energy balance closure.
In addition to local turbulent mixing, large eddies influence the spectra of wind velocity and scalarcomponents in the ASL. Considerable work has beendone to study locally-generated turbulence using idealturbulent structures in a quasi-stationary atmosphereover homogeneous surface conditions, resulting in thegeneration of empirical relationships between normalized spectra/cospectra and frequency(Kaimal et al., 1972; Wyngaard and Coté, 1972; Moraes and Epstein, 1987). However, the surface conditions at most experimental sites are not ideal, meaning that the surface layers at these sites are disturbed by large eddies. These large-eddy disturbances are included inobservations of turbulence and contribute to flux estimates(Sakai et al., 2001). A number of recent experiments have investigated how boundary layer disturbances respond to a variety of surface roughness and atmospheric stability conditions(e.g., Andreas, 1987;Smeets et al., 1998; McNaughton and Laubach, 2000;Hong et al., 2004; Li et al., 2007). Most research indicates that low frequency eddies induced by topography generally enhance the observed spectra, producing complicated cospectra with unpredictable sign atlow frequencies and nearly-isotropic spectra/cospectrathat obey the -5/3 power law at high frequencies. Thebehaviors of the v spectrum and uw cospectrum arequite complicated. However, Hong et al.(2004)foundthat the v spectrum contains a spectral gap at moderate frequencies; moreover, this spectra does not obeythe -1 power law as suggested earlier by Hunt and Morrison(2000), and inactive eddies at low frequenciesdo not affect momentum fluxes(Hong et al., 2004). Liet al.(2007)compared the inner peak frequency of thev spectrum over valley and flat terrains. Their resultsindicated that topography affects the inner structureof the ASL. The peak frequency of the normalized vspectrum is the same as the peak frequency of thenormalized u spectrum over valley terrain, and corresponds to the height of the boundary layer(Li et al., 2007). These studies have shown that the ASL canbe influenced by large eddies generated by topography, but the mechanism behind this influence is stillunknown.
McNaughton and Laubach(2000), McNaughton and Brunet(2002), and McNaughton(2004)developeda theoretical framework for underst and ing the resultsdescribed above. They noted that the spectra and cospectra in the ASL contain three separate scalingregions: inner layer scaling(ILS), outer layer scaling(OLS), and combined scaling(CS). ILS describes theparts of the spectra and cospectra that are dominatedby mechanical friction at the ground surface; the spectral characteristics in this region have been defined byan experiment in Kansas, USA(Kaimal et al., 1972).The amplitude and shape of the ILS frequency rangedo not change with height, but the peak frequencydoes. The turbulence frequency scale in the OLS frequency range depends on the length scales of the largeeddies in the outer layer, defined by Deardorff as theconvective boundary layer(CBL). The OLS lengthscale is related to the height of the CBL(Zi). Theamplitude and position of the peak frequency in theOLS part of the spectra are not dependent of height, but the shape is. In the CS frequency range, bothspectra and cospectra should obey the requirementsof both OLS and ILS. The intensity of turbulence inthe CS frequency range is independent of both height and frequency(McNaughton and Laubach, 2000).
Typical l and scapes comprise surfaces with heterogeneous characteristics. Wind and temperature profiles over each surface depend on the surface roughness and surface temperature, respectively. Profiles areshifted downwind by the horizontal wind field, forming a discontinuous layer called the internal boundarylayer(IBL)(Foken, 2008b). In the experiments mentioned above, the disturbances are mostly induced bytopography or differences in the roughness of the surface layer. Little attention has been paid to effectsof the IBL on turbulent fluxes and the spectra and cospectra of turbulence. The summer 2000 international Energy Balance EXperiment(EBEX-2000)location was flood irrigated using a patch-to-patch approach from north to south, forming an inhomogeneous surface. An IBL was detected during this experiment, probably due to contrasts in soil moistureinduced by patch-to-patch irrigation. This work investigates interactions between large eddies and localturbulence by analyzing the characteristics of the spectra and cospectra of turbulence in the IBL. The resultsare then inspected to identify whether McNaughton's(2004)theoretical framework holds under these conditions. The influences of large eddies on turbulentfluxes are interpreted according to characteristics ofthe turbulence spectra and cospectra.
This research focuses on three aspects of turbulent mixing in the ABL: 1)the influences of the IBL onturbulence spectra and cospectra; 2)the relationshipbetween surface layer stability and these influences; and 3)the height dependence of these influences.2. Experiment2.1 Site description
The EBEX-2000 was carried out over a flat and flood-irrigated cotton field in the San Joaquin Valleyof California(36°06'N, 19°56'W). The experimentalsite was located in a 1600 m×800 m field about 20 kmsouthwest of the town of Lemoore and approximately67 m above sea level with a slight slope of 0.1 degree.The weather during the project was clear withno recorded precipitation. The prevailing upper-levelwinds were steady from the north-northwest, due inpart to the topography of the valley. Winds in thenear-surface layer were more variable than those atupper levels.
Patch-to-patch flood irrigation from north tosouth was performed on the field twice during the experiment, leading to inhomogeneous distributions ofsoil moisture. The irrigation schedule during EBEX-2000 is given in Fig. 4 of Oncley et al.(2007). An IBL, which may have been induced by the spatial variationsof surface temperature that accompanied the irrigation schedule, was observed. The mechanism underlying the formation of the IBL will be discussed later inthis paper.
This experiment used an array of ten towers with200-m spacing in the along-wind direction and a typical fetch of more than 400 m. Profiles of temperature, specific humidity, and wind were measured at nearbytowers at 12 near-surface levels(up to 11 m)to provideinformation about horizontal advection. The EBEX-2000 proceeded in two operational periods: 18-29 July2000 focusing on instrument inter-comparisons, and 124 August 2000 for formal experiment. Oncley et al.(2007)described the layout of the experimental sites and other details of the EBEX-2000.
The data used in this paper were observed at Site7 by the City University of Hong Kong. The canopycoverage at Site 7 during the operational period wasabout 90%-95%, with the average canopy height assumed to be 0.9 m. The zero-displacement was takento be 0.6 m, two-thirds of the canopy height.2.2 Instrumentation
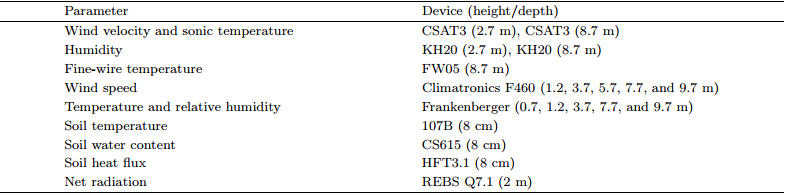
Site 7 contained 5 towers with 8 eddy-covariancesystems at 5 levels each, and 2 profile towers withanemometers and dry/wet-bulb psychrometers at 12levels. This study uses turbulence data at 2.7 and 8.7 m, observations of wind/temperature profiles, and soil conditions(soil temperature, soil volumetric watercontent, and soil heat flux). Signals from the eddycovariance systems were sampled at a rate of 10 Hz, while signals from the cup anemometers and dry/wetbulb psychrometers were sampled at a rate of 0.2 Hzat all levels. Table 1 lists all of the devices and theheights/depths of measurements used in this study.
The experiment location was flood-irrigated fromnorth to south. The l and surface of Site 7 becamevery wet on 2 August; however, some turbulence datawas not recorded at Site 7 during the first few daysof the formal experiment period. Measurements forthe irrigated case were taken during 5-7 August, and measurements for the non-irrigated case were takenduring 11-13 August. These two cases are comparedto investigate the effects of heterogeneous irrigationon turbulence spectra and cospectra, especially in thelow-frequency domain.3.2 Data processing3.2.1 Calculation of spectra and cospectra
Turbulence data were recorded at 10 Hz during30-min runs, yielding records of 16000 data points attwo vertical levels for each time segment. The FastFourier Transform(FFT)is used to calculate powerspectra and cospectra. There were 214(16384)datapoints used for every 30-min segment.
The data series are conditioned prior to the application of the FFT algorithm following several procedures commonly used in micrometeorological dataanalysis. First, bad data points are eliminated using a 9-point smoothing. Second, three-dimensionalrotations are applied. The block averages of each individual segment are then removed, leaving turbulentfluctuations of wind velocity, temperature, and specifichumidity. The series are then multiplied by a Hanningwindow. The effects of these procedures have been described by Kaimal and Finnigan(1994).3.2.2 Averaging of spectra and cospectra
The spectra and cospectra analyzed here havebeen averaged over six runs. For example, the average of spectra at 1000 LT(Local Time)for the irrigated case is calculated from the six segments at1000 and 1030 LT 5-7 August. The individual spectra and cospectra are normalized by the scaling parameters before averaging. The averaged spectra are thensmoothed as follows. An overlapping block averagewith a width of 3 points is used for the first 20 points toreduce the erratic variability at the statistically unreliable low-frequency end(McNaughton and Laubach, 2000). The other points are averaged into nonoverlapping blocks with logarithmically increasing width(Kaimal and Finnigan, 1994). All of the spectra and cospectra series are then smoothed using 3-point averages, with the three points assigned weights of 3/11, 5/11, and 3/11, respectively.3.2.3 Profile data processing and flux calculations
Profile data(such as wind speed, dry temperature and wet temperature)were collected every 5 minutes.A non-overlapping block average of six data points istherefore used to calculate the mean value for each halfhour.
The net fluxes are calibrated by the observedwind. If the FW05 fine-wire temperature measurements are of good quality, data from the fast-responsethermocouple are used to calculate the sensible heatflux. Otherwise, crosswind-corrected sonic temperatures are used instead(Schotanus et al., 1983). Thelatent heat flux is calculated using data from the KH20(calibrated at both levels using level-specific calibration constants), and then the Webb correction is applied(Webb et al., 1980). Soil moisture is representedby the measured volumetric water content. All of thesecalibration methods have been described in the usermanual for the Hong Kong tower data collected during the EBEX-2000.4. Results
The general characteristics of the energy balance, statistical quantities, turbulence spectra and structureduring the EBEX-2000 have been reported previously(e.g., Li et al., 2003; Liu et al., 2005, 2006a, b). Here, data collected on 5 August are taken to represent anirrigated case with an IBL, while data collected on11 August are taken to represent a non-irrigated casewithout an IBL. The irrigation schedule and the durations of the wet, moist, and dry periods of the fieldduring the experiment are summarized in Fig. 4 of Oncley et al.(2007). The patch-to-patch irrigationproceeded from north to south(roughly one patch perday with a patch size of 200-300 m), so the two patchesupstream(north)of the patch where Site 7 was locatedwere drier than Site 7 on 5 August. Moreover, the l and upstream of the experiment was dry bare soil on 5 August, when Site 7 was still freshly irrigated(Oncley et al., 2007). These multiple transitions from warm/dryto cool/wet surface conditions(i.e., dry bare soil towet cotton field; relatively drier upstream patches torelatively wet Site 7 patch)led to horizontal advectionof relatively warm and dry air over the wetter patchesdownwind. By 11 August, Site 7 was relatively dryafter several days without irrigation; accordingly, thedownstream transitions from warm/dry to cool/wetwere weak relative to those on 5 August.4.1 Evidence of the IBL and its influence on heat fluxes
The dominant circulation on 5 August was anticyclonic. The prevailing winds at low levels werenortheasterly and weak(~1-3 m s-1). The sky wassunny and cloudless, with a maximum net radiativeflux of about 700 W m-2 at 1300 LT(Fig. 1). Theseconditions led to the existence of a well-developed convective boundary layer(CBL). The CBL was accompanied by an unstable atmospheric surface layer(ASL)in the morning, which was replaced by a stable ASL inthe afternoon(after 1200 LT; Fig. 2). This transitionindicates the development of a stable IBL, presumablyrelated to the horizontal advection of relatively warm and dry air over a relatively cool and wet surface. Theexistence of this stable IBL hastened the appearanceof the stable ASL beneath the CBL in the afternoon.On 11 August, the warm/dry to cool/wet transitionwas relatively weak; accordingly, a stable IBL did notdevelop and the stable ASL did not appear until 1700LT(Fig. 2).
 |
| Fig. 1. Diurnal variations of energy fluxes(Rn: net radiative, H: sensible heat flux, and LE: latent heat flux)on(a)August 5(an irrigated day) and (b)August 11(a non-irrigated day). |
 |
| Fig. 2. Air temperature profiles at di®erent times(LT)on(a)August 5(the irrigated day) and (b)August 11(thenon-irrigated day). |
The diurnal variations of sensible heat flux(H) and latent heat flux(LE)were quite different betweenthe irrigated and non-irrigated days, even though thenet radiation changed very little(Fig. 1). LE fluctuated significantly in the daytime, with a number oflocal minima and maxima. The amplitudes of theseLE fluctuations were larger on the irrigated day(5August)than that on the non-irrigated day(11 August). Furthermore, these amplitudes were larger at8.7 m than at 2.7 m. H changed sign from positive tonegative at noon on the irrigated day, but this transition did not occur until 1700 LT on the non-irrigatedday. H and LE were correlated with fluctuations in w, T, and q, so the differences in H and LE between thetwo days may be related to differences in the structureof turbulence.4.2 Turbulence spectra and cospectra
The spectra and cospectra of turbulence associateeach scale of motion with the amount of kinetic energy, variance, or eddy flux it contributes to the whole. Thecharacteristics of the turbulence spectra and cospectracan be used to analyze the structure of turbulence and explain the behavior of H and LE. The spectra of u, v, w, T, and q and the cospectra of uw, wT and wq willbe analyzed in the following paragraphs. The behavior of these spectra and cospectra at low frequencieswill be studied carefully to determine the strength and scale of large eddies, and to identify interactions between large eddies and local turbulence.
Figures 3-10 show the spectra of u, v, w, T, and q, and the cospectra of uw, wT, and wq at the twolevels(2.7 and 8.7 m)on irrigated and non-irrigateddays. Data at 1000, 1200, 1400, and 1700 LT are usedto represent four different stability regimes(unstable, weakly unstable, near-neutral, and weakly stable).Each group contains six data series(each representinga 30-min segment)for irrigated days(5-7 August) and six data series for non-irrigated days(11-13 August).The horizontal coordinate in Figs. 3-10 is natural frequency; the vertical coordinate is the normalized spectrum/cospectrum. The spectra and cospectra understationary conditions(Kaimal et al., 1972; Andreas, 1987)are presented for comparison to evaluate the applicability of the -2/3 power law and local isotropy inthe inertial subrange. The empirical functions for thenormalized spectra and cospectra are given as follows.
Equations(4) and (5)apply to the spectra of both T and q. Equations(7) and (8)apply to the cospectraof both wT and wq.4.2.1 Horizontal wind velocity spectra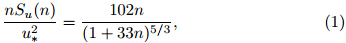
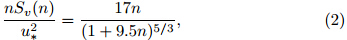
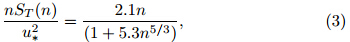

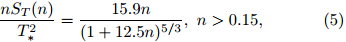

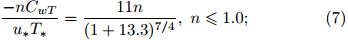
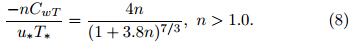
Figure 3 presents the power spectra of the zonalcomponent of wind speed at 2.7 and 8.7 m on irrigated and non-irrigated days. Figure 4 presents the corre-sponding power spectra of the meridional componentof wind speed.
 |
| Fig. 3. The u spectra versus natural frequency for the irrigated case(5-7 August) and the non-irrigated case(11-13August)on two levels(2.7 and 8.7 m)at(a)1000, (b)1200, (c)1400, and (d)1700 LT. |
 |
| Fig. 4. As in Fig. 3, but for the v spectra. |
Figure 3 provides the general characteristics of theu spectrum. The power spectra of u are much largerthan the Kansas spectra at low frequencies. The substantial variance in this region reflects disturbance ofthe surface layer by large eddies. The peak frequenciesat both vertical levels occur at the same true frequency(see also Table 2), indicating that the large eddiespassing through these two levels have the same lengthscales. This result is consistent with the OLS theory:frequency scale depends on the turbulent length scale and the velocity scales that characterize motion in theouter layer, and does not change with height. Theu spectra converge and are approximately parallel tothe Kansas spectra at high frequencies, in the inertialsubrange. This result suggests that the u spectra obeyILS at high frequencies. The separation between OLS and ILS is not notable at moderate frequencies exceptin the stable case. This result reveals that the differences between OLS and ILS in the scales of turbulenceaffecting the zonal wind speed are relatively indistinct.The two scalings combine well during daytime whenthe surface layer is unstable, so no gaps appear in thespectrum at moderate frequencies.
The main characteristics of the u spectra in thisexperiment are similar to the results reported by Mc-Naughton and Laubach(2000) and Hong et al.(2004), but differ from those reported by Li et al.(2007).Here, no clear spectral gaps appear in the u spectra inunstable cases, whereas spectral gaps are apparent inthe spectra calculated by Li et al.(2007). The lengthscales of the topographically induced outer layer eddies are much larger in their experiment than in thisone. The frequency differences between OLS and ILSare therefore greater in their experiment, resulting inless merging of OLS and ILS eddies and the appearance of a spectral gap at moderate frequencies.
Comparison of the spectra for the irrigated case(marked as "Wet" in Fig. 3) and the non-irrigatedcase(marked as "Dry" in Fig. 3)shows that the development of the IBL is associated with greater powerat low frequencies. This result indicates that the existence of the IBL corresponds to a greater number oflarge eddies in the surface layer. The power spectraof u do not change significantly in the OLS region asthe stability of the surface layer increases, but the energy contained in the inertial subrange increases substantially. The u spectra show substantial variance atlow frequencies in all cases, reflecting the disturbancescaused by large eddies. This effect is greater at 8.7 mthan at 2.7 m.4.2.1.2 Meridional wind spectra
Figure 4 shows that the v spectra can also be decomposed into three frequency ranges. Just like theu spectra, the v spectra are convergent and parallelto the Kansas spectra at high frequencies. This resultdemonstrates that the v spectra also obey ILS at highfrequencies. The v power spectra are also enhancedat low frequencies due to disturbances from the outerlayer. Under unstable or near-neutral conditions, thepower spectra generally peak twice at low frequenciesthen decrease as the frequency increases. Under stableconditions, the v power spectrum contains doublepeaks at both high and low frequencies, with a distinct minimum at intermediate frequencies. This feature has been described as a spectral gap, and is characteristic of spectra in a disturbed surface layer(Mc-Naughton and Laubach, 2000). This phenomenon isinconsistent with Monin-Obukhov similarity theory.McNaughton and Laubach(2000)obtained similar results over a paddy field when the surface was stable.These spectral gaps may demonstrate a distinguishable scale separation between the active local turbulence in the inner layer and the inactive turbulence inthe outer layer. This would occur if the large-eddylength scales were much larger than the local turbulence length scales. The two would then merge less atmoderate frequencies, producing clear spectral gaps.
The v spectra contain broader spectral gaps thanthe u spectra, especially under stable conditions. OLSmotions travel faster than ILS structures in the zonaldirection due to the influence of horizontal advection(McNaughton and Brunet, 2002). Similar results havebeen obtained by Hong et al.(2004) and Li et al.(2007).
The spectra of v are greatly enhanced at low frequencies for irrigated days with a well-developed IBL.Moreover, the IBL-related enhancement of the v spectra is greater at 8.7 m than at 2.7 m and decreaseswith the increase of surface layer stability. These features are similar to those of the u spectra.4.2.2 Vertical velocity spectra
The w spectra(Fig. 5)are similar to those obtained during the Kansas experiment, but with greaterpower at low frequencies. The w spectra are alsobroader throughout the frequency range, especiallyunder unstable conditions, with spectral peaks in therange n = 0.1-0.5. The low frequency variabilityof vertical wind is enhanced in these spectra relative to those obtained during the Kansas experiment.This enhancement has previously been observed during other experiments conducted under disturbedconditions(Smeets et al., 1998; Andreas, 1987; Mc-Naughton and Laubach, 2000). HÄogstrom(1990)alsonoted a similar effect in a study conducted over lessdisturbed agricultural l and . He concluded that theadditional variance was attributable to inactive turbulence, and he also provided a number of interesting lines of evidence to support this conclusion. Here, the additional turbulence is treated using OLS withheight dependence as the distinguishing feature(McNaughton and Laubach, 2000).
 |
| Fig. 5. As in Fig. 3, but for the w spectra. |
Peltier et al.(1996)also reported an enhancementin the w spectrum at low frequencies. They proposedthat the variations in vertical velocity could be produced by the convergence and divergence of the dominant horizontal motions near the ground. Continuity dem and s spectral energy transfer from horizontalto vertical motion. The total energy involved in thistransfer is small, so it can be identified in w spectrabut is imperceptible in u and v spectra. This indicates that vertical motion is related to the coherenceof updrafts and downdrafts. The w spectra containgreater height dependence at low frequencies than theu and v spectra. This feature is consistent with theOLS theory as proposed by McNaughton and Laubach(2000). The skewness of w decreases significantly and even turns negative with the development of the IBL(Table 3). This change implies a weakening in theprevailing narrow updrafts, and is more apparent at8.7 m than at 2.7 m. This is consistent with the hypothesis that OLS motions enter the IBL from above, thereby affecting the structure of turbulence at 8.7 mmore than at 2.7 m.
The power spectra of w in the OLS frequencyrange decrease as the stability of the ASL increasesfrom unstable to weakly stable, revealing that thepower of the large eddies induced by the IBL decreaseswith increasing stability. The ILS part of the w spectracorresponds more closely to the Kansas spectrum under the more stable nighttime conditions, when largeeddies are suppressed and locally generated turbulenceis dominant(e.g., the non-irrigated case at 2.7 m asshown in Fig. 3d).4.2.3 Temperature spectra
Figure 6 shows the spectra of surface air temperature. The T power spectra decrease gradually withincreasing frequency when the surface layer is unstable, with no obvious peaks in power. Under unstable and near neutral conditions, the power of the T spectrum in the inertial subrange is larger at 2.7 m thanat 8.7 m. This result indicates that the small-lengthscale turbulent eddies are induced by the ground surface. Spectral gaps appear at intermediate frequenciesunder unstable conditions, but these gaps are not aspronounced as the gaps in the v spectra.
 |
| Fig. 6. As in Fig. 3, but for the T spectra. |
The q spectra(Fig. 7)contain some interestingfeatures. The humidity spectra contain more energyat low frequencies than predicted by the Kansas experiment, even under stable conditions. This excessenergy is presumably induced by the effect of largescale velocity fluctuations on the scalar field. The qspectra are smaller than the Kansas experiment spectrum in the inertial subrange under unstable and nearneutral conditions, but are larger than and parallel tothe Kansas spectrum under stable conditions. Theshapes of the spectra of the two scalars(T and q)are dissimilar, especially at intermediate frequencies.The q spectra at 2.7 m are larger than those at 8.7 m, indicating that humidity fluctuations are generated bythe ground surface.
 |
| Fig. 7. As in Fig. 3, but for the q spectra. |
The power of the uw cospectra at low frequenciesis much larger than that obtained during the Kansasexperiment(Fig. 8). This enhancement of energyat low frequencies is due to large eddies induced bythe coherence of the zonal and vertical wind components. The normalized momentum cospectra converge and parallel the Kansas experiment spectrum in theinertial subrange. This behavior demonstrates thatthe uw cospectra obey ILS at high frequencies.
 |
| Fig. 8. As in Fig. 3, but for the uw cospectra. |
The wT and wq cospectra vary in similar ways(Figs. 9 and 10). When the stratification of the surface layer is unstable or near-neutral, the wT and wqcospectra contain much more energy at low frequenciesthan predicted by the Kansas experiment, but muchless energy at high frequencies than predicted by theKansas experiment. The results coincide well withthose of the Kansas experiment when the surface layeris stable, but with significant fluctuations at low frequencies. These fluctuations can be attributed to theeffects of large eddies, as mentioned above. The powerof the wT and wq cospectra at 1700 LT decreases substantially at frequencies greater than n ≈ 0.01 Hz atboth levels on irrigated days and at the 2.7-m levelon non-irrigated days. The wT and wq cospectra at2.7 m are flatter than those at 8.7 m under unstable and near-neutral conditions because local turbulence(which operates on small scales)is much more activeat 2.7 m. The differences in scale between local turbulence and large scale motions are therefore much moresignificant at 2.7 m, resulting in a much wider intermediate frequency regime. The top-down eddies from theouter layer cannot penetrate downward to the surfaceas well when the surface layer is stable, so the structure of turbulence at 2.7 m is affected less substantiallyby large eddies. The interaction between large eddies and local turbulence is consequently weaker at 2.7 mthan at 8.7 m. The characteristics of the wT and wqcospectra at 2.7 m are accordingly dominated by local turbulence; thus, the spectral gaps at intermediatefrequencies are much more pronounced than those inthe cospectra at 8.7 m(Figs. 9d and 10d).
 |
| Fig. 9. As in Fig. 3, but for the wT cospectra. |
 |
| Fig. 10. As in Fig. 3, but for the wq cospectra. |
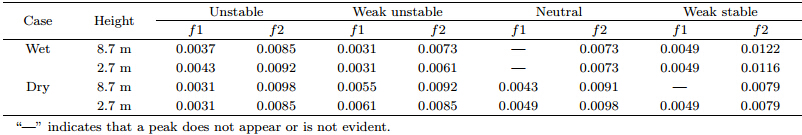
The relationship between the dominant scale oflarge eddies and the dominant scale of heterogeneity isexplored by identifying the minima and maxima of thespectra and cospectra. Large-scale motions at 1000 LToccur at three dominant frequencies: 0.005, 0.01, and 0.015 Hz. The mean wind speed during this time is approximately 3 m s-1, so the corresponding large eddylength scales are approximately 600, 300, and 200 m.The 600-m eddies are induced by horizontal advectionfrom the bare soil upstream of the experiment site.The eddies at the other two length scales are inducedby the development of the IBL caused by patch-to-patch irrigation. The length scales of these eddies areconsistent with the dominant scales of surface heterogeneity at the experiment site.
The differences in the behavior of the spectra and cospectra at different levels and above different surface conditions also provide interesting results. Forexample, the q spectra at 8.7 m have maxima at 0.01Hz on irrigated days but minima at this frequency onnon-irrigated days. This result demonstrates the substantial enhancement of the spectra and cospectra atthis frequency due to the existence of large eddies withan approximate 300-m length scale on irrigated days.Turbulence is affected by large eddies at other scaleson non-irrigated days, eliminating the peak at this frequency. The maxima in the spectra and cospectraare much sharper at 8.7 m than at 2.7 m, indicating greater interaction between inactive OLS motions and active ILS turbulence at 8.7 m than at 2.7 m.Comparison of the dominant peak frequencies at thetwo levels indicates that the peak frequencies at 2.7 mare slightly larger than the peak frequencies at 8.7 m.Analysis of the strengths and length scales of eddiesat the two vertical levels therefore suggests that outerlayer eddies propagate downward through the IBL and interact with local turbulence. These large eddies fromthe outer layer gradually break up into smaller eddiesduring this interaction process.5. Summary
The power spectra of wind velocity, temperature, and humidity, and the cospectra of momentum flux and heat flux at EBEX-2000 Site 7 during daytimehave been analyzed. The influence of the developmentof an IBL on the structure of turbulence in the ASL hasbeen examined by comparing an irrigated case(witha well-developed IBL) and a non-irrigated case(withno IBL). This work identifies several features of thestructure of turbulence in the presence of an IBL thatdeserve further discussion.
Spectra and cospectra can be decomposed intothree components according to their dependence onfrequency and height. Spectral power at low frequencies is associated with external disturbances. The frequencies of peak power in this spectral regime are independent of height, but their amplitudes vary withheight. These features are consistent with OLS. Thepower spectra of wind velocity for the irrigated casewith a well-developed IBL are greatly enhanced byOLS motions, reflecting the importance of externaldisturbances under these conditions. The spectra and cospectra for the irrigated and non-irrigated cases tendto converge and run parallel to the Kansas spectrumin the high frequency inertial subrange, indicating theimportance of ILS turbulence in this spectral regime.The spectra and cospectra are not independent in either the frequency or height domain in the intermediate frequency regime. They typically fluctuate inthe frequency domain under most unstable and nearneutral conditions, and often contain a "spectral gap"in this frequency range under stable conditions. Theseresults do not provide enough evidence to determinewhether these spectra obey CS. The interactions between large-scale motions and local turbulence in theASL require further investigation.
The behavior of the w spectra indicates that thepower of OLS motions decreases as the stability of thesurface layer increases from unstable to weakly stable, suggesting that the net influence of large eddies induced by the IBL also decreases. The ILS turbulencealso matches the Kansas spectrum better when conditions are more stable, i.e., large eddies are suppressed and locally generated turbulence is dominant.
The different behaviors of the spectra and cospectra in the low and intermediate frequency regimes reveal that the power of turbulent fluctuations in windvelocity, scalars, and energy fluxes is affected by OLSmotions more strongly at 8.7 m than at 2.7 m. Thisresult suggests that OLS motions descend from abovethe surface layer to interact with local turbulence, and should be investigated further.
Three dominant frequencies of OLS motions aredetected in the power spectra at 0.005, 0.01, and 0.015Hz. The length scales of these motions are consistentwith the dominant scales of surface heterogeneity atthe experiment site.
Acknowledgments: We thank the two anonymous reviewers for their valuable comments and suggestions.
| [1] | Andreas, E. L., 1987: Spectral measurements in a disturbed boundary layer over snow. J. Atmos. Sci., 44, 1912-1939. |
| [2] | Foken, T., 2008a: The energy balance closure problem: An overview. Ecol. Appl., 18(6), 1351-1367. |
| [3] | —, 2008b: Micrometeorology. Springer-Verlag Berlin Heidelberg, 328 pp. |
| [4] | Högstrom, U., 1990: Analysis of turbulence structure in the surface layer with a modified similarity formulation for near neutral conditions. J. Atmos. Sci., 47, 1949-1972. |
| [5] | Hong, J. K., T. Choi, H. Ishikawa, et al., 2004: Turbulence structures in the near-neutral surface layer on the Tibetan Plateau. Geophys. Res. Lett., 31, L15106. |
| [6] | Hunt, J. C. R., and J. F. Morrison, 2000: Eddy structure in turbulent boundary layers. Euro. J. Mech. B. Fluids, 19, 673-694. |
| [7] | Kaimal, J. C., J. C. Wyngaard, Y. Izumi, et al., 1972: Spectral characteristics of surface layer turbulence. Quart. J. Roy. Meteor. Soc., 98, 563-589. |
| [8] | —, and J. J. Finnigan, 1994: Atmospheric Boundary Layer Flows. Oxford University Press, New York, 45-55. |
| [9] | Kang, S. L., and K. J. Davis, 2007: Observations of the ABL structures over a heterogeneous land surface during IHOP-2002. J. Hydrometeorol., 8, 221-244. |
| [10] | —, and —, 2008: The effects of mesoscale surface heterogeneity on the fair-weather convective atmospheric boundary layer. J. Atmos. Sci., 65, 31973213. |
| [11] | —, and —, 2009: Reply. J. Atmos. Sci., 66, 32293232. |
| [12] | Lenschow, D. H., and J. Sun, 2007: The spectral composition of fluxes and variances over land and sea out to the mesoscale. Bound.-Layer Meteor., 125, 63-84. |
| [13] | Li Jie, Liu Shuhua, Liu Heping, et al., 2003: Surface imbalance energy calculated and analyzed with the data of EBEX-2000. Acta Meteor. Sinica, 17(4), 448-464. |
| [14] | Li, W., T. Hiyama, and N. Kobayashi, 2007: Turbulence spectra in the near-neutral surface layer over the Loess Plateau in China. Bound.-Layer Meteor., 124, 449-463. |
| [15] | Liu Shuhua, Liu Heping, Li Jie, et al., 2005: Characteristics turbulence spectra and local isotropy in EBEX-2000. Chinese J. Atmos. Sci., 29(4), 365380. (in Chinese) |
| [16] | —, —, —, et al., 2006a: Characteristics turbulence dissipation rates, length scales, and structure parameters in EBEX-2000. Chinese J. Atmos. Sci., 30(1), 27-35. (in Chinese) |
| [17] | —, —, —, et al., 2006b: Characteristics of statistical quantities of atmospheric turbulence in EBEX-2000. Chinese J. Atmos. Sci., 30(2), 115-122. (in Chinese) |
| [18] | McNaughton, K. G., 2004: Turbulence structure of the unstable atmospheric surface layer and transition to the outer layer. Bound.-Layer Meteor., 112, 199221. |
| [19] | —, and J. Laubach, 2000: Power spectra and cospectra for wind and scalars in a disturbed surface layer at the base of an advective inversion. Bound.-Layer Meteor., 96, 143-185. |
| [20] | —, and Y. Brunet, 2002: Towensend's hypothesis, coherent structures, and Monin-Obukhov similarity. Bound.-Layer Meteor., 102, 161-175. |
| [21] | Moraes, O. L. L., and M. Epstein, 1987: The velocity spectra in the stable surface layer. Bound.-Layer Meteor., 40, 407-414. |
| [22] | Oncley, S. P., T. Foken, R. Vogt, et al., 2007: The energy balance experiment EBEX-2000. Part I: Overview and energy balance. Bound.-Layer Meteor., 123, 1-28. |
| [23] | Peltier, L. J., G. C. Wyngaard, S. Khanna, et al., 1996: Spectra in the unstable surface layer. J. Atmos. Sci., 53, 49-61. |
| [24] | Sakai, R. K., D. R. Fitzjarrald, and K. E. Moore, 2001: Importance of low-frequency contributions to eddy fluxes observed over rough surfaces. J. Appl. Meteor., 40, 2178-2192. |
| [25] | Schotanus, P., F. T. M. Nieuwstadt, and H. A. R. DeBruin, 1983: Temperature measurement with a sonic anemometer and its application to heat and mois-ture fluctuations. Bound.-Layer Meteor., 26, 81-93. |
| [26] | Smeets, C. J. P. P., P. G. Duynkerke, and H. F. Vugts, 1998: Turbulence characteristics of the stable boundary layer over a mid-latitude glacier. Part I: A combination of katabatic and large-scale forcing. Bound.-Layer Meteor., 87, 117-145. |
| [27] | Vickers, D., and L. Mahrt, 2003: The cospectral gap and turbulent calculations. J. Atmos. Oceanic Technol., 20, 660-672. |
| [28] | Webb, E. K., G. I. Pearman, and R. Leuning, 1980: Correction of the flux measurements for density effects due to heat and water vapour transfer. Quart. J. Roy. Meteor. Soc., 106, 85-100. |
| [29] | Wyngaard, J. C., and O. R. Coté, 1972: Cospectral similarity in the atmospheric surface layer. Quart. J. Roy. Meteor. Soc., 98, 590-603. |
| [30] | Zhang Y., H. Liu, T. Foken, et al., 2010: Turbulence spectra and cospectra under the influence of large eddies in the Energy Balance Experiment (EBEX). Bound.-Layer Meteor., 136, 235-251. |