 2013, Vol. 28
The Chinese Meteorological Society
Article Information
- MA Tingting, JIANG Zhihong, WU Zhiwei. 2013.
- Responses of the Leading Mode of Coldwave Intensity in China to a Warming Climate
- J. Meteor. Res., 28(5): 673-683
- http://dx.doi.org/10.1007/s133-51-013-0503-1
-
Article History
- Received December 16, 2012
- in final form March 19, 2013


Regional extreme cold events have changed dramatically under recent global warming(e.g., Karl et al., 1996; Easterling et al., 2000; Cattiaux et al., 2010;Wang et al., 2010b; Chen et al., 2011; Lin and Wu, 2011a, b; Jiang et al., 2012a). A number of investigations have pointed out that the occurrence of coldextremes has decreased over the last century. Karl etal.(1996) and Easterling et al.(2000)showed thatthe number of days with temperatures below freezing decreased over the United States during the 20thcentury. A similar decreasing trend in the number offrost days has been found in both Australia and NewZeal and (Plummer et al., 1999). Heino et al.(1999)identified a pronounced decline in the number of frostdays associated with strong increases in winter minimum temperatures in northern and central Europe.
The intensity of disastrous cold events has seemedto increase over the past few years. The World Meteorological Organization(2010) reported observationsof extreme cold temperatures in Mongolia and Russia, with minimum temperatures near -60 across central and southern Siberia in January 2001. In 2007, many parts of southern South America experiencedthe coldest winter in the past 50 years, along withunusual snowfalls. Extremely cold temperatures and snowstorms characterized the winter of 2009-2010 overlarge parts of the Northern Hemisphere, includingparts of Europe, North America, and Asia. A series of cold extremes and record snowfalls were observed in northern and western Europe(Cattiaux et al., 2010), records for daily minimum temperatureswere broken in many parts of North America(Wang et al., 2010b; Lin and Wu, 2011a, b; Li and Wu, 2012), and China experienced heavy snowstorms. This background lends urgency to investigations of how cold-waves in China change under a warming climate.
The main purpose of this study is to examinethe responses of coldwave intensity(CWI)in China toglobal warming. Extreme cold temperatures and theworst snowstorm in the past 100 years were observedacross southern China during January-February 2008(e.g., Wen et al., 2009; Wu et al., 2010). Focusing on the dynamical and physical processes that ledto this specific severe case, many subsequent studieshave considered this snowstorm as an unusual event(e.g., Tao and Wei, 2008; Ding et al., 2008; Yang and Li, 2008; Wen et al., 2009). However, someresearchers pointed out that several similar(thoughless intense)events had occurred in the past 50 years(Wu et al., 2010; Zhang et al., 2011; Jiang et al., 2012b; Ma et al., 2012). The continueous occurrences of cold events over the following years havesupported this view. Southern China experienced several extreme cold temperature events in January 2010(http://ncc.cma.gov.cn/upload/upload2/jdjc), alongwith heavy snowstorms during the winter of 2010-2011. It seems that southern China has experiencedmore intense coldwaves during recent years.
This study addresses the following questions.How does the leading mode of CWI change in a warming climate? Is the change in the leading mode a response to global warming? What physical processescould be responsible for this response? The paper isstructured as follows. Section 2 describes the data, model, and methodology used in this study. Section3 presents observations of changes in the CWI leadingmode under recent global warming. Section 4 providesa verification of the response of the CWI leading modeusing results from seven state-of-the-art climate models that participated in the 2007 Fourth AssessmentReport(AR4)coordinated by the IntergovernmentalPanel on Climate Change(IPCC). Possible physicalmechanisms that may account for the response of theCWI are discussed in Section 5. Section 6 summarizesthe major findings and discusses some outst and ing issues.2. Data, model, and method
The datasets used in this work include 1)dailysurface air temperatures at 605 gauge stations acrossChina provided by the China Meteorological Administration(see black dots in Fig. 1); 2)HadCRUT3 datafrom the Met O°ce Hadley Centre(Brohan et al., 2005); 3)NCEP/NCAR reanalysis 1957-2010 dailycirculation data(Kalnay et al., 1996); and 4)1957-2010 monthly mean circulation data, gridded at a2.5°×2.5° resolution, from the European Centre forMedium-Range Weather Forecasts(ECMWF)40-yrreanalysis dataset(ERA-40; 1957-2002)(Uppala et al., 2005) and the NOAA National Centers for Environmental Prediction reanalysis dataset(NCEP-DOEreanalysis 2; 2003-2010)(Kanamitsu et al., 2002).
To verify the response of the CWI leading mode, we use output from seven state-of-the-art climatemodel simulations performed for the IPCC AR4 tocalculate CWI in the 21st century(2080-2099). All ofthe simulations follow the A1B global warming stabilization scenario, with an atmospheric CO2 concentration of 720 ppm. The credibility of IPCCAR4 model simulations and projections of climate extremes has been examined by Li et al.(2011a, b) and Kodra et al.(2011). We use output from thefollowing seven models: ECHAM5/MPI-OM, MRICGCM2.3.2, CCCma-CGCM3.1(T63), CNRM-CM3, CSIRO-Mk3.0, MIROC3.2-hires, and ECHAM4. Allof these models simulate Chinese climate well(Zhou and Yu, 2006; Ma et al., 2012).
Winter in this paper comprises four months: November, December, January, and February(NDJF).The observational data used in this study cover theperiod 1957-2010, and the model output data coverthe period 2080-2100. We supplement ERA-40 reanalysis data, which are only available for the period1957-2002, with 2003-2010 NCEP-DOE reanalysis 2data. The 2003-2010 NCEP-DOE reanalysis 2 datawere adjusted by removing the climatological difference between the ERA-40 and NCEP-DOE reanalysis2 datasets to maintain temporal homogeneity(Li et al., 2010; Wang et al., 2010a).
Following the definition of heatwave by Fischer and Schär(2010), a coldwave refers to a spell of atleast 6 consecutive days with minimum temperaturesless than the local 10th percentile of the control period1961-1990. We remove the seasonal cycle by using a15-day running mean to calculate the 10th percentilefor each calendar day at each grid point. The annualvalue of CWI is calculated as the deviation of the minimum temperature of the coldest wintertime coldwavefrom the maximum 10th percentile temperature during the control period 1961-1990. We report CWI asthe absolute value for convenience: a high CWI refersto a strong coldwave. The maximum 10th percentilewintertime temperature during the control period isshown in Fig. 1. Considering the notable warmingtrend of global mean temperature during 1957-2009(Fig. 2), we treat the relatively cool period 1957-1979as a cold epoch and the relatively warm period 1980-2009 as a warm epoch.
 |
| Fig. 1. BlackcarboninthefiveicecorescollectedovertheTibetan |
 |
| Fig. 2. BlackcarboninthefiveicecorescollectedovertheTibetan |
We derive the CWI leading mode by performingan empirical orthogonal function(EOF)analysis ofthe CWI during 1957-2009, which is carried out byconstructing a covariance matrix. The EOF spatialpatterns and the corresponding principal components(PCs)are presented in Fig. 3. The two leading modes(hereafter EOF1 and EOF2)explain 28.5% and 12.4%of the total variance, respectively. The EOF1(Fig. 3a) and EOF2(Fig. 3c)modes are statistically distinct from each other(North et al., 1982). The EOF1spatial pattern is uniform in sign, with the center ofmaximum loading located in northern China. ThePC1(Fig. 3b)decreased sharply in the mid 1980s, implying that coldwaves associated with this spatialpattern were more intense before the 1980s than afterthe 1980s. This interdecadal transition is evident inmany metrics of Chinese climate, and is observed inboth winter and summer seasons(Zhou et al., 2009).The EOF2 spatial pattern is a dipole, which reflects aseesaw effect in CWI between northeastern and southern China. The PC2(Fig. 3d)does not show anynotable trends over the period of 1957-2009.
 |
| Fig. 3. BlackcarboninthefiveicecorescollectedovertheTibetan |
To further investigate the temporal variations ofthe CWI leading mode, we perform separate EOFanalyses of CWI for the cold(1957-1979) and warm(1980-2009)periods. The results are shown in Fig. 4. The EOF1 mode accounts for 29.7% of the total variance during the cold period, and 21.9% of thevariance during the warm period. During the coldepoch, the EOF1 spatial pattern is nearly uniformin sign, with the extreme value center located overnorthern China. The amplitude of the CWI values associated with EOF1 decreases southward. The PC1of CWI is primarily dominated by interannual variations. In the warm epoch, the EOF1 spatial patternis a dipole, with the largest negative anomaly covering northeastern China and two positive extreme valuecenters located in northern and southern China, respectively. This indicates that the maximum loadingof the CWI extends into southern China during thetransition from the cold period to the warm period.This southward extension of the extreme value center indicates a greater intensity of coldwave variationsin southern China associated with EOF1. The PC1time series does not contain any notable trends during1980-2009.
 |
| Fig. 4. BlackcarboninthefiveicecorescollectedovertheTibetan |
In this section, we have examined variations of theCWI leading mode from an observational perspective.The results show that the CWI decreases across Chinaduring 1957-2009. The CWI leading mode is characterized by an extreme value center located in northernChina during the cold period(1957-1979). This center of maximum loading extends into southern Chinaduring the warm period(1980-2009), suggesting thatcoldwave variations in southern China may grow moreintense in a warming climate. In the next section, wewill examine whether the southward extension of theextreme value center in the CWI leading mode is a4. Modeling results
We hypothesize that the southward extension ofthe maximum loading center in the CWI leading modeis a response to a warming climate. If this hypothesisis true, the extreme value centers of the CWI leadingmode should be found in southern China in climatemodel projections of future warming. We examinethe pattern of the EOF leading mode under the A1Bscenario(stabilization at an atmospheric CO2 concentration of 720 ppm). A number of studies(Pierce et al., 2009; Santer et al., 2009)suggest that the multimodel ensemble(MME)mean provides a more robustprediction of future climate than output from a singlemodel. In this study, we calculate the MME mean ofseven state-of-the-art ocean-atmosphere coupled models that participated in the IPCC AR4, and then perform EOF analysis on this MME mean over the 2080-2099 period. We only consider the distribution of CWIextreme value centers at the end of the 21st century.The control periods for calculating the CWI are 2045-2064 and 2080-2089.
Figure 5 presents the spatial pattern and corresponding PC of the leading EOF mode of CWI at theend of the 21st century. The EOF1 mode accounts for22.7% of the total variance(Fig. 5a). The spatial pattern over China is uniform in sign, with extreme valuecenters covering northern and southern China. Theposition of the maximum loading centers supports ourhypothesis that the increase in CWI in southern Chinais a response to global warming. The PC1 primarilyshows interannual variations in CWI.These model results provide evidence that the primary response of the CWI leading mode in China toa warming climate may be a southward extension ofthe extreme value center.
 |
| Fig. 5. BlackcarboninthefiveicecorescollectedovertheTibetan |
In this section, we will discuss the physical processes that may be responsible for the response ofthe CWI leading mode to global warming. The stormtrack plays an important role in midlatitude weather and climate, especially in winter(Zhu and Li, 2010);we may therefore expect a strong relationship betweenCWI and storminess. To investigate this relationship, we calculate the correlation coe°cients(Fig. 6)between PC1(Fig. 3b) and storminess. Storminessis defined as the st and ard deviation of geopotentialheight filtered with a 2-6-day b and -pass filter at 500hPa(Blackmon, 1976; Scaife et al., 2011). We findlarge areas of negative correlation between PC1 and storminess in the climatological Pacific storm track regions, which is consistent with our expectations. Correlations are insignificant and negative over most ofChina(except northeastern China), while correlationsare positive at low and high latitudes.
 |
| Fig. 6. BlackcarboninthefiveicecorescollectedovertheTibetan |
As noted above, coldwaves in China are related tothe Pacific storm track. The following text will focuson how changes in storminess could cause the responseof the CWI leading mode to global warming. The variations of the storm track from the cold period to thewarm period are shown in Fig. 7. The climatologicalmaxima in storminess are located over northeasternChina and over the northern Pacific between 40° and 60°N throughout both the cold(Fig. 7a) and warm(Fig. 7b)epochs. The amplitude of these maxima instorminess decreases southward. The composite difference in the spatial distribution of storminess betweenthe two epochs(warm minus cold)is shown in Fig. 7c. Large areas of positive storminess anomalies prevail in middle and low latitudes, covering the areasbounded by 30° and 50°N. These changes are consistent with enhancement of the intensity of the stormtrack over these regions. Negative anomalies prevailin regions north of 50°N, indicating a reduction of thestorm track intensity. These results suggest that thesouthern flank of the climatological storm track experienced enhanced storminess during the warm epochrelative to the cold epoch, whereas the northern flankexperienced reduced storminess. These changes areconsistent with the intensification and southward shiftof the storm track in the warm period.
 |
| Fig. 7. BlackcarboninthefiveicecorescollectedovertheTibetan |
The southward shift in storminess may be relatedto changes in synoptic eddies, which have profoundimplications for the climate in China. We investigatethese changes by calculating the Eady growth rate inthe troposphere(Eady, 1949; Wittman et al., 2004;Scaife et al., 2011; Ren et al., 2011):
where f is the Coriolis parameter, U=H is the vertical shear of the zonal wind over the whole troposphere(surface to 200 hPa), and N is the mean static stability over the whole troposphere. The Eady growth ratecan also be used as a measure of baroclinicity.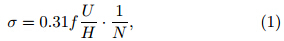
Figures 8a and 8b present the climatological Eadygrowth rate for the cold and warm periods, respectively. A strong baroclinicity zone dominates the region around 30°N during the cold epoch, with theamplitude decreasing both northward and southward.The growth rate for baroclinic eddies during the 1980-2009 period has similar characteristics; however, Fig. 8c shows that synoptic eddy activity over China increased during the warm epoch relative to the coldepoch. Significant centers of positive anomaly are located around 40°N, where eddies that are generatedmay develop well. These positive anomalies act to enhance the storm track and shift it slightly southward.Small negative anomalies over Mongolia and low latitudes indicate a reduction of synoptic eddies in thewarm period over these regions.
 |
| Fig. 8. BlackcarboninthefiveicecorescollectedovertheTibetan |
To summarize, the response of the CWI leadingmode is accompanied by a change in the position ofthe Pacific storm track. The increases in baroclinicity near 40°N are favorable for eddies, so the stormtrack is intensified and shifted southward in the warmperiod relative to the cold period. This shift and theassociated baroclinic changes may lead to the observedincrease in storminess over southern China during thewarm epoch.6. Conclusions and discussion
Although global warming is known to bring aboutmany changes in extreme regional cold events, its influences on CWI in China are still unknown. This studyhas focused on the response of the CWI leading modeto a warming climate. The EOF results show thatCWI decreases throughout China during the 1957-2009 period. Observational evidence indicates thatthe maximum of the EOF1 mode of CWI is located innorthern China during the cold period(1957-1979), and then extends into southern China during thewarm period(1980-2009). Numerical model resultsalso project an extension of the maximum loading ofthe CWI leading mode into southern China at theend of the 21st century(2080-2099). These resultsindicate that the primary response of the CWI majormode is a southward extension of the CWI maxima, which may increase the intensity of coldwave variations in southern China. Such increases in coldwaveintensity have been observed in the recent past.
We have presented and discussed possible physical processes associated with the response of CWI inChina to global warming. The response of the CWIleading mode appears to be intimately connected withchanges in the Pacific storm track. A significant increase in observed baroclinicity near 40°N is favorable for maintaining eddies and promoting increasedstorminess around this latitude. These changes tend tointensify the storm track and shift it southward. Thissouthward shift and associated baroclinic changes maybe responsible for the enhanced storminess in southern China during the warm epoch relative to the coldepoch.
The storm track is not the only factor that influences CWI in China. Coldwaves and cold surgesare often associated with significant events during astrong East Asian winter monsoon(EAWM)(Ding and Sikka, 2006; Wu et al., 2009; Chang et al., 2010;Wang et al., 2010a). The dynamical energy sourcesfor these events may be associated with variations inthe strength and location of the Siberian High(SH)(Lee et al., 2010). Many previous studies have pointedout that the strength of the SH has diminished considerably during recent decades(Gong and Wang, 1999;Gong and Ho, 2002; Panagiotopoulos et al., 2004).This weakening of the SH may alter its impact onCWI in China; however, the mechanisms by whichchanges in the SH affect CWI are still unclear. Otherfactors besides the SH may also contribute to theresponse of the CWI. These outst and ing issues mayrequire further discussion in future papers.
Acknowledgments: The authors acknowledgethe related modeling groups for making their simulations available for analysis, and the Program for Climate Model Diagnosis and Intercomparison(PCMDI)for collecting and archiving the Coupled Model Intercomparison Project 3(CMIP3)model output. Thelanguage editor for this manuscript is Dr. JonathonS. Wright.| [1] | Blackmon, M. L., 1976: A climatological spectral study of the 500-mb geopotential height of the Northern Hemisphere. J. Atmos. Sci., 33, 1607-1623. |
| [2] | Brohan, P., J. J. Kennedy, I. Harris, et al., 2005: Uncertainty estimates in regional and global observed temperature changes: A new dataset from 1850. J. Geophys. Res., 111, D12106, doi: 10.1029/2005JD006548. |
| [3] | Cattiaux, J., R. Vautard, C. Cassou, et al., 2010: Winter 2010 in Europe: A cold extreme in a warming climate. Geophys. Res. Lett., 37, L20704, doi:10.1029/2010GL044613. |
| [4] | Chang, C. P., M. M. Lu, and B. Wang, 2010: The East Asian winter monsoon. The Global Monsoon System: Research and Forecast, 2nd ed., Chang, C. P., et al., Eds., World Scientific, 99-110. |
| [5] | Chen, W. L., Z. H. Jiang, L. Li, et al., 2011: Simulation of regional climate change under the IPCC A2 scenario in Southeast China. Climate Dyn., 36, 491-507, doi:10.1007/s00382-010-0910-3. |
| [6] | Ding, Y. H., and D. R. Sikka, 2006: Cold waves and cold surges. The Asian Monsoon. Wang, B., Ed., Praxis,184-194. |
| [7] | —-, Z. Y. Wang, Y. F. Song, et al., 2008: Causes of the unprecedented freezing disaster in January 2008 and its possible association with the global warming. Acta Meteor. Sinica, 22(4), 538-558. |
| [8] | Eady, E., 1949: Long waves and cyclone waves. Tellus,1, 33-52. |
| [9] | Easterling, D. R., J. L. Evans, P. Y. Groisman, et al., 2000: Observed variability and trends in extreme climate events: A brief review. Bull. Amer. Meteor. Soc., 81, 417-425. |
| [10] | Fischer, E. M., and C. Schär, 2010: Consistent geographical patterns of changes in high-impact European heatwaves. Nat. Geosci., 3, 398-403. |
| [11] | Gong, D. Y., and C. -H. Ho, 2002: The Siberian high and climate change over middle to high latitude Asia. Theor. Appl. Climatol., 72, 1-9. |
| [12] | Gong Daoyi and Wang Shaowu, 1999: Long-term variability of the Siberian high and the possible connection to global warming. Acta Geographica Sinica,54, 125-133. (in Chinese) |
| [13] | Heino, R., et al., 1999: Progress in the study of climate extremes in northern and central Europe. Climatic Change, 42, 151-181. |
| [14] | Jiang, Z. H., J. Song, L. Li, et al., 2012a: Extreme climate events in China: IPCC-AR4 model evaluation and projection. Climatic Change, 110, 385-401, doi: 10.1007/s10584-011-0090-0. |
| [15] | —-, T. Ma, and Z. W. Wu, 2012b: China coldwave duration in a warming winter: Change of the leading mode. Theor. Appl. Climatol., doi: 10.1007/s00704012-0613-2. |
| [16] | Kalnay, E., et al., 1996: The NCEP/NCAR 40-yr reanalysis project. Bull. Amer. Meteor. Soc., 77,437-471. |
| [17] | Kanamitsu, M., W. Ebisuzaki, J. Woollen, S.-K. Yang, et al., 2002: NCEP-DEO AMIP-II reanalysis (R-2). Bull. Amer. Meteor. Soc., 83, 1631-1643. |
| [18] | Karl, T. R., R. W. Knight, D. R. Easterling, et al., 1996: Indices of climate change for the United States. Bull. Amer. Meteor. Soc., 77, 279-291. |
| [19] | Kodra, E., K. Steinhaeuser, and A. R. Ganguly, 2011: Persisting cold extremes under the 21st-century warming scenarios. Geophys. Res. Lett., 38, L08705, doi: 10.1029/2011GL047103. |
| [20] | Lee, Y. Y., G. H. Lim, and J. S. Kug, 2010: Influence of the East Asian winter monsoon on the storm track activity over the North Pacific. J. Geophys. Res.,115, D09102, doi: 10.1029/2009JD012813. |
| [21] | Li, H., L. Feng, and T. Zhou, 2011a: Multi-model projection of July-August climate extreme changes over China under CO2 doubling. Part I: Precipitation. Adv. Atmos. Sci., 28(2), 433-447, doi:10.1007/s00376-010-0013-4. |
| [22] | —-, —-, and —-, 2011b: Multi-model projection of July-August climate extreme changes over China under CO2 doubling. Part II: Temperature. Adv. Atmos. Sci., 28(2), 448-463, doi: 10.1007/s00376010-0052-x. |
| [23] | Li, J. P., Z. W. Wu, Z. H. Jiang, et al., 2010: Can global warming strengthen the East Asian summer monsoon? J. Climate, 23, 6696-6705. |
| [24] | —-, and —-, 2012: Importance of autumn Arctic sea ice to northern winter snowfall. Proc. Natl. Acad. Sci. USA, doi: 10.1073/pnas.1205075109. |
| [25] | Lin, H., and Z. W. Wu, 2011a: Contribution of the autumn Tibetan Plateau snow cover to seasonal prediction of North American winter temperature. J. Climate, 24, 2801-2813. |
| [26] | —-, and —-, 2011b: Contribution of Tibetan Plateau snow cover to the extreme winter condition of 2009-2010. Atmos. Ocean, doi:10.1080/07055900.2011.649036. |
| [27] | Ma, T., Z. W. Wu, and Z. H. Jiang, 2012: How does China coldwave frequency respond to global warming? Climate Dyn. , doi: 10.1007/s00382-012-1354-8. |
| [28] | North, G. R., T. L. Bell, R. F. Cahalan, et al., 1982: Sampling errors in the estimation of empirical orthogonal functions. Mon. Wea. Rev., 110, 699-706. |
| [29] | Panagiotopoulos, F., M. Shahgedanova, A. Hannachi, et al., 2004: Observed trends and teleconnections of the Siberian high: A recently declining center of action. J. Climate, 18, 1411-1422. |
| [30] | Pierce, D. W., T. P. Barnett, B. D. Santer, et al., 2009: Selecting global climate models for regional climate change studies. Proc. Natl. Acad. Sci., USA,106(21), 8441-8446. |
| [31] | Plummer, N. et al., 1999: Changes in climate extremes over the Australian region and New Zealand during the 20th century. Climatic Change, 42, 183-202. |
| [32] | Ren, X. J., X. Q. Yang, T. J. Zhou, et al., 2011: Diagnostic comparison of wintertime East Asian subtropical jet and Polar-front jet: Large-scale characteristics and transient eddy activities. Acta Meteor. Sinica.25(1), 21-33. |
| [33] | Santer, B., et al., 2009: Incorporating model quality information in climate change detection and attribution studies. Proc. Natl. Acad. Sci. USA, 106(35), 14,778-14, 783, doi: 10.1073/pnas.0901736106. |
| [34] | Scaife, A. A., et al., 2011: Climate change projections and stratosphere-troposphere interation. Climate Dyn., doi: 10.1007/s00382-011-1080-7. |
| [35] | Tao Shiyan and Wei Jie, 2008: Severe snow and freezing rain in January 2008 in the southern China. Climatic Environ. Res., 13(4), 337-350. (in Chinese) |
| [36] | Uppala, S., et al., 2005: The ERA-40 reanalysis. Quart. J. Roy. Meteor. Soc., 131, 2961-3012, doi:10.1256/qj.04.176. |
| [37] | Wang, B., Z. W. Wu, C. P. Chang, et al., 2010a: Another look at climate variations of the East Asian winter monsoon: Northern and southern modes. J. Climate, 23, 1495-1512. |
| [38] | Wang, C., H. Liu, and S. Lee, 2010b: The record-breaking cold temperatures during the winter of 2009/2010 in the Northern Hemisphere. Atmos. Sci. Lett., doi:10.1002/asl.278. |
| [39] | Wen, M., S. Yang, A. Kumar, et al., 2009: An analysis of the large-scale climate anomalies associated with the snowstorms affecting China in January 2008. Mon. Wea. Rev., 137, 1111-1131. |
| [40] | Wittman, M. A. H., L. M. Polvani, R. K. Scott, et al., 2004: Stratospheric influence on baroclinic lifecycles and its connection to the Arctic oscillation. Geophys. Res. Lett., 31, L16113, doi:10.1029/2004GL020503. |
| [41] | World Meteorological Organization, 2010: A Snapshot of Some Extreme Events over the Past Decade. http://www.wmo.int/pages/prog/wcp/documents/extremes.pdf. |
| [42] | Wu, Z. W., J. P. Li, B. Wang, et al., 2009: Can the Southern Hemisphere annular mode affect China winter monsoon? J. Geophys. Res., 114, D11107, doi: 10.1029/2008JD011501. |
| [43] | —-, —-, Z. H. Jiang, et al., 2010: Predictable climate dynamics of abnormal East Asian winter monsoon: Once-in-a-century snowstorms in 2007/2008 winter. Climate Dyn., doi: 10.1007/s00382-010-0938-4. |
| [44] | Yang Hui and Li Chongyin, 2008: Influence of Arctic oscillation on temperature and precipitation in winter. Climatic Envon. Res., 13(4), 395-404. (in Chinese) |
| [45] | Zhang, H. Q., J. Qin, and Y. Li, 2011: Climatic background of cold and wet winter in southern China. Part I: Observational analysis. Climate Dyn., doi:10.1007/s00382-011-1022-4. |
| [46] | Zhou, T., D. Gong, J. Li, et al., 2009: Detecting and understanding the multi-decadal variability of the East Asian summer monsoon: Recent progress and state of affairs. Meteorologische Zeitschrift, 18(4),455-467. |
| [47] | Zhou, T. J., and R. C. Yu, 2006: Twentieth century surface air temperature over China and the globe simulated by coupled climate models. J. Climate,19(22), 5843-5858. |
| [48] | Zhu Weijun and Li Ying, 2010: Interdecadal variation characteristics of winter North Pacific storm tracks and its possible influencing mechanism. Acta Meteor. Sinica, 68(4), 477-486. (in Chinese) |