 2013, Vol. 27
The Chinese Meteorological Society
Article Information
- JIANG Ying, LUO Yong, and ZHAO Zongci. 2013.
- Maximum Wind Speed Changes over China
- J. Meteor. Res., 27(1): 63-74
- http://dx.doi.org/10.1007/s13351-013-0107-x
-
Article History
- Received October 19, 2011
- in final form June 25, 2012


2 Public Meteorological Service Center of CMA, Beijing 100081;
3 Center for Earth System Science, Tsinghua University, Beijing 100084;
4 National Climate Center of China, Beijing 100081
The global climate models GFDL−CM2−0, MRI−CGCM2, and EBGCM (the ensemble of above mentioned three global climate models) consistently suggest that the annual and seasonal WSmax values will decrease during 2046–2065 and 2080–2099 relative to 1981–2000. The models also suggest that decreases in WSmax for whole China during 2046–2065 and 2080–2099 are related to both the reduced intensity of cold waves and the reduced intensity of the winter monsoon, and the decrease in WSmax in the southeast coastal areas of China is corresponding to the decreasing number of tropical cyclones over the Northwest Pacific Ocean in the summer during the same periods.
Over the last century, the earth’s climate has beenwarming(Wang and Ye, 1995; IPCC, 2007). Globalclimate changes from 1906 to 2005 have led to increasesin the annual mean surface temperature of approximately0.74℃(0.56–0.92℃), with a slightly largerincrease in China compared to that of the global average.Climate model studies indicate that climatewarming trends will continue over the next 50–100years(IPCC, 2007; PRCC, 2007). Extreme climatechange due to global warming is a unique and valuableresearch area(Yan and Yang, 2000). Researchregarding changes in maximum wind speeds(WSmax)at the national level is important to sustainable utilizationof wind energy and mitigation of disasters causedby extreme winds. It is also useful for planning windenergy industry development, maintaining electricitygrid, and predicting the price of wind electricity.
Relevant studies have focused on two areas regardingthe near-surface(10-m level)annual, seasonal, monthly, and daily changes of WSavg(average wind) and WSmax. The first area involves observational dataanalysis of the cause of wind changes, and the secondarea involves mathematical simulation and projection.Regarding observational data analysis, previous worksuggested that there had been a decreasing trend of annualWSavg over the past 50 years(Wang et al., 2004;Ren et al., 2005; Zhu and Liang, 2005; Xu et al., 2006;Zhou and Yu, 2006). Li et al.(2007)further indicatedthat the mean wind energy density in China between1960 and 2000 exhibited declining trends, on both annual and seasonal scales. Yan and Yang(2000)showedthat the maximum wind speed decreased by 1–3 m s-1during the last few decades. Jiang et al.(2010a)indicatedthat WSavg showed declining trends over broadareas of China, except the regions from the Hetao areato Yunnan Province and Guangxi Region. The annualWSavg over China showed a decreasing trend with valuesof –0.12, –0.10, and –0.02 m s-1 per decade in thesounding data, the NCEP/NCAR and the ERA40 reanalysisdata at 925 hPa, respectively, over the last 50years. The primary reason for this decreasing trendis changes in the atmospheric circulation. Li et al.(2011)suggested that the major cause of the reducedwind speed observed during the past half century is thedecreasing sea level pressure(SLP)gradients in NorthChina. Most of the above-mentioned studies have focusedon WSavg in China, while some of the studiesaddress WSmax but do not provide a clear explanationfor the related changes. None of the previous studiesinclude a future projection of WSmax(such as for the21st century). Therefore, this study aims to examinethe WSmax changes and the underlying reasons inboth present and future China.
Since the 1990s, research on climate models hasdeveloped rapidly. Climate models have been employedto simulate and project variations in temperature and precipitation(Qian and Lin, 2004; Cook and Vizy, 2006; Phillips and Gleckler, 2006; IPCC, 2007;Zhang et al., 2008; Zhou et al., 2008; Yang et al., 2010;Hao et al., 2011). Scientists also used climate modelsto reproduce and project changes of near-surface wind and the corresponding energy. For example, Pryor etal.(2005), Rockel and Woth(2007), and Bloom etal.(2008)independently examined variations in nearsurfacewind and wind power density during the 21stcentury over northern Europe, Europe, southwesterncoast of North America, and Mediterranean region.Jiang et al.(2009a, b, 2010b, c, d)projected changesin WSavg and wind power density over China. However, there have been few reports on the projectedchanges of WSmax in China. In this paper, basedon features of future WSavg changes, we analyze and project future changes in near-surfaceWSmax throughoutChina.2. Data and methods2.1 Data processing2.1.1 Observation data
To investigate the effect of urbanization on longtermwind variations, two observational datasets wereused. One dataset is from 745 basic and st and ardweather stations, and the other is from 2425 genericweather stations. Both datasets conform to the guidelinesof the WMO global observation systems(WMO, 2004) and the China Meteorological Administration(CMA)technical observation st and ards(CMA, 2003).Wind data from 535 stations, with no missing recordsfrom 1956 to 2004, were used. These stations areevenly distributed, with the exception of a sparse distributionover the Tibetan Plateau. These datasetstogether with dust storm data and sounding data from140 stations were obtained from instruments operatedby the NMIC(National Meteorological InformationCenter of CMA). The number of typhoons originatedin western Pacific that either made l and fall or influencedwind speeds was also obtained from the NMIC.Cold wave days were defined based on the NationalClimate Center of CMA st and ards(Wang and Ding, 2006).
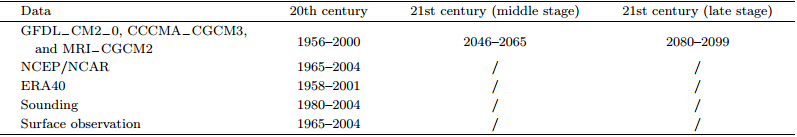
For analysis of wind speed characteristics in themid and low troposphere, wind speed at the surfacelevel, 925, 850, and 700 hPa from the NCEP and ERA40 reanalysis datasets were also used(seeTable 1).
 |
The near-surface layer is defined as 10 m aboveground, and WSavg represents the average wind speedfrom four-time daily observed values and was averagedover a particular time period(day, month, oryear). The maximum value from all 10-min averagewind speeds in a particular time period(day, month, oryear)is defined as observed(daily, monthly, or yearly)WSmax. Gale days are defined as days with wind speed≥ 17 m s-1, as determined with direct measurements, or those at the eighth grade or higher, as determinedwith visual observations when there is instrumentfailure.2.1.2 Model data
Since the three global climate models, i.e., GFDL−CM2−0 from the NOAA Geophysical FluidDynamics Laboratory, CCCMA−CGCM3 from theCanadian Centre for Climate Modeling and Analysis, and MRI−CGCM2 from the Japan Meteorological ResearchInstitute, have strong ability to simulate currentwind speeds in China(Jiang et al., 2009b), thesethree models with an emission projection of SRES A2were employed to project annual and seasonal WSmaxvalues over China for periods 2046–2065 and 2080–2099.
Considering the limitations of the simulated outputdatasets from the GCMs, the yearly(or monthly)WSmax is defined as the maximum value among thedaily average wind speeds. EBGCM denotes the ensembleof the above three global climate models.2.2 Computation method
Global climate models(GCMs)differ in their resolution.For comparative purposes, outputs of GCMs and observations of related stations were interpolatedonto 1.0°×1.0° grids using the inverse distance weightmethod.
To determine the 21st century WSmax, projectionsof each model were compared to corresponding20th century data, and the difference of wind speedwas calculated between the 20th and 21st century. Toexamine the long-term changes of WSmax and galedays, we use linear regression trend analysis(Wei, 1999)followed by a significance test of the WSmaxtrend in terms of space-time variability correlation coefficients.
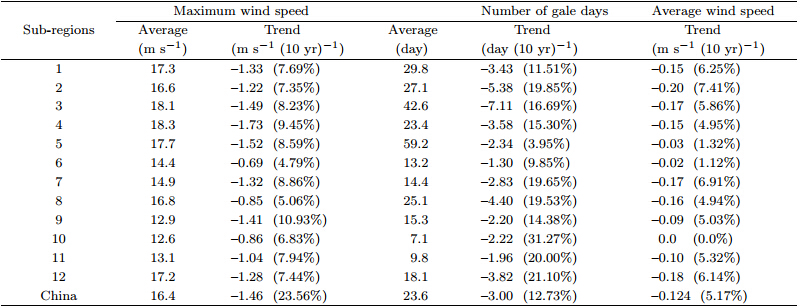
To address the detailed characteristics of WSmaxchanges in various regions and to compare these valueswith those ofWSavg(Jiang et al., 2010a), we divide theexperimental area into 12 sub-regions based on topography and physiognomy. The stations in every subregionare evenly distributed. The 12 sub-regions are:(1)Xinjiang, (2)west Inner Mongolia, (3)east InnerMongolia, (4)Northeast China, (5)Tibetan Plateau, (6)west–central China, (7)east–central China, (8)the northeastern coast of China, (9)Yunnan, (10)Guizhou, (11)South China, and (12)southeasterncoast of China.
The WSmax in January, April, July, and Octoberwas used to represent seasonal values of winter, spring, summer, and autumn, respectively.3. Observed maximum wind changes in China during 1956–2004 and associated causes3.1 Variations of maximum wind
We found that the 50-yr annual WSmax exhibiteda noticeable decline(the solid line in Fig. 1a)ofapproximately –1.46 m s-1 per decade, with a 23.6%decrease per decade and a significant linear trend(atthe 0.001 level). The annual WSavg over China declinedafter 1956 by approximately –0.124 m s-1 perdecade, with a 5.17% decrease per decade(Jiang et al., 2010a). The amplitude of the WSmax decrease islarger than that of the WSavg decrease. This trend isconsistent with that found by Yan and Yang(2000).The mean frequency of annual gale days displayed aremarkable decrease over the last 50 years, with –3.0gale days per decade, corresponding to a –12.7% decreaseper decade.
 |
| Fig. 1. Observed annual(seasonal)maximum wind(m s-1) and gale days(day)in China during 1956–2004.(a)Annual maximum wind(solid line) and gale days(dottedline), (b)seasonal maximum wind, and (c)seasonal galedays. |
Seasonally, WSmax declined within the study period, and it decreased more significantly during spring(Fig. 1b). The frequency of gale days decreased as well(Fig. 1c), with spring exhibiting the strongest winds, the highest gale frequency, and a marked decrease inthe value of strongest wind speed and the number ofwindy days. In this case, WSmax does not follow thetrends of WSavg.
Both annual WSmax and WSavg decreased overmost of China during 1956–2004(see Fig. 2). The decliningtrend of WSmax is more significant than thatof WSavg. However, there is a difference in the trenddistribution between WSmax and WSavg. The yearlyWSavg exhibited a large decline across China, exceptin the Hetao area southward to Yunnan and Guangxi and in eastern Tibet, where there were no significanttrends in wind change(Jiang et al., 2010a). Examinationof the distribution of WSavg showed that the zoneswith a decline of WSavg(< –0.12 m s-1 per decade)also exhibited greater long-term average wind speeds(> 2.2 m s-1), and the zones with no noticeable trendscorresponded to those of multiple-year average weakwinds, implying that the yearly WSavg decreases occurredprimarily in regions with greater wind velocities(Jiang et al., 2010a). However, WSmax has differenttrend distribution characteristics. WSmax exhibited anobvious reduced trend across China. WSmax showedrelatively small decreases(approximately –0.8 m s-1per decade)from western Inner Mongolia to SichuanProvince. WSmax exhibited relatively large decreases(> –1.6 m s-1 per decade)in the regions from easternInner Mongolia to Fujian and Hainan provinces and across most regions of Northeast China. The regionswith the smallest and largest WSmax decreasesmismatched the regions with the smallest and largestdecreases in WSavg.
 |
| Fig. 2. Distributions of observed maximum and average wind speeds and trends during 1956–2004.(a)Maximum wind(m s-1) and (b)trend of the maximum wind speed(m s-1(10 yr)-1). |
To further investigate regional wind characteristicsduring 1956–2004, the experimental area(i.e., China)was separated into 12 sub-regions(Jiang et al., 2010a). Both annual WSmax and the frequencyof annual gale days exhibit declining trends(Table 2).WSmax decreased over northern(sub-regions 1–4) and southeast coastal China(sub-region 12), where themulti-year average wind speed is significantly greaterthan that in sub-regions 6 or 10. This is similar tothe results of the annual WSavg, but sub-regions 6 and 10 show decreases in WSmax and no significanttrend or a slight increasing trend for WSavg. However, the frequency of gale days differs between cases(Table 2), e.g., changes in WSavg are closely related tochanges in WSmax but not clearly related to the frequencyof gale days. The latter denotes the frequencyof extreme wind rather than the wind speed value.WSmax over sub-regions 1–4 is mainly impacted bycold waves during winter and spring. The decliningtrend over sub-regions 1–2 is more obvious thanthat over sub-regions 3–4. This finding represents theslightly different changes of cold wave intensity betweenthe western(1–2) and eastern(3–4)sub-regions.For the regions along the southeast coast(8 and 12), WSmax is primarily impacted by typhoons from theNorthwest Pacific Ocean that either make l and fall orinfluence wind speeds over l and . The decrease inWSmax over the southern sub-region(12)is more significantthan that over the northern sub-region(8), which is related to the decrease of typhoon intensity and frequency as well as the trajectories of typhoonstraveling northward(Lei et al., 2009; Wang et al., 2006).
 |
Wind instrument renewal occurred in China duringapproximately 1969–1970, consistent with a timeof significant changes in average wind measurementscompared with wind measurements before and afterthe renewal events(Jiang et al., 2010a). However, thechange in maximum wind speed during the shift periodis not clear. Ignoring the impact of nationalwind instrument renewal from 1969 to 1970, the maximumwind speed and gale day frequency significantly and gradually decreased from 1971 to 2004(Fig. 1a).Additionally, the small number of stations undergoinginstrument renewal and shifting did not affect thetrends for the other 535 stations in the country. Thus, the effects of instrument renewing and station shiftingare unlikely to significantly influence WSmax changingtrends.3.2.2 Impact of urbanization
To explore the long-term effect of urbanizationnear climate stations on wind changes by using themethod presented by Jiang et al.(2010a), we selected174 of the 535 stations located near highly urbanizedareas(urban stations) and 180 stations surrounded byareas with little or no urbanization(rural stations).These two sets of stations are evenly distributed, respectively, with the exception of a sparse distributionover the Tibetan Plateau. A comparison of the longtermchanges in annual WSmax(Fig. 3a)between theurban and rural stations reveals that WSmax of urbanstations was commensurate with that of rural stationsbefore the 1970s, where both showed slightly decliningtrends over time. However, after the 1970s, WSmaxshowed a prominent decreasing trend at both urban and rural stations. Additionally, the reducing trendwas larger at urban stations than at rural stations(–1.75 versus –1.30 m s-1 per decade). This is becausethe WSmax trends did not differ initially between urban and rural stations due to the low constructionfrequency around both types of stations before the1970s, but after the 1970s, the urban wind decline wasslightly greater than the rural wind decline due to enhancedurbanization that occurred rapidly post 1970in China. However, even the stations that underwentlittle or no urbanization displayed a declining trend ofannual WSmax. This suggests that urbanization is unlikelyto be a major factor affecting the yearly WSmaxdecline in China, which is consistent with the findingsof Jiang et al.(2010a)regarding WSavg and those of Li et al.(2011)regarding extreme wind speeds in Beijing.
 |
| Fig. 3. Observed annual maximum wind speed(a; m s-1) and frequency of gale days(b; day)over the urban stations(solid line) and rural stations(line with squares)during 1956–2004. |
The average wind trends over China were calculatedfor winds measured at 10 m above ground and atdifferent levels of the troposphere using NCEP/NCAR(1980–2004), ERA40(1980–2001), and atmosphericsounding(1980–2004)data. Despite the differencesin these data sources, consistent decreasing trends inwind speed are shown from 150 hPa to the surface.The decreasing wind speed detected from atmosphericsoundings was the most significant at 250 hPa, witha decrease of –0.23 m s-1 per decade. The decliningwind trend gradually receded until the 850-hPalevel, where there was a decrease of –0.04 m s-1 perdecade(Zhang et al., 2009). The three datasets obtainedfrom NCEP/NCAR, ERA40, and atmosphericsoundings yielded similar conclusions and exhibitedsimilar trend values at the same level. Therefore, thedecreasing winds in the near-surface layer are relatedto the decreasing winds in the troposphere and lowerstratosphere over China(Fig. 4).
 |
| Fig. 4. Wind speed changes over China based on theobserved station data(dark blue), sounding data(red), NCEP reanalysis data(yellow), and ERA-40 reanalysisdata(light blue)in the mid-low troposphere from 1956to 2004. |
Most of China is affected by the East Asian monsoons.The Asian zonal(meridional)circulation hasweakened over the past 50 years and resulted in weakenedmonsoons, which is consistent with the resultsthat show reduced intensity of the winter and summermonsoons(Guo, 1983; Shi, 1996; Wang et al., 2001;Zhao and Zhou, 2005; IPCC, 2007). This suggeststhat, under the global warming, the air-sea thermalcontrast decreases, the strength of the winter Siberianhigh is reduced(Guo et al., 2001; Guo et al., 2004) and thus, the atmospheric circulation varies accordingly.These factors are most likely the forces thatcause the decline of yearly and seasonal maximal windspeed trends across China.3.2.5 Association of cold waves, dust storms, and extratropical cyclones
Most of China is located in the midlatitudes ofthe Northern Hemisphere. In the last 50 years, the frequencyof cyclones in the midlatitudes has decreased, and cyclone routes show a northward migration trend(Wang et al., 2007), which is closely related to declinesin WSmax and gale day frequency in northernChina. Extremely cold weather is often accompaniedby a sharp temperature drop. During the study period, due to conspicuous warming in many regions ofthe extratropical latitudes, the number of cold wavedays greatly decreased, which was linked to the reducedfrequency of gale days(Wang and Ding, 2006;Qian and Zhang, 2007; Wei and Lin, 2009). Duststorms occur when large volumes of s and and dustare raised by strong winds and lead to sharply diminishedvisibility. The frequency of dust storm days isassociated with the frequency of gale days in much ofnorthern China. The frequency of dust storm dayshas greatly reduced during the last 50 years(Qian et al., 2002; Ding et al., 2005; Wang et al., 2009). Dueto global warming, the frequencies of cold waves, duststorms, and extratropical cyclone days have declined, which is the direct and convincing evidence of decreasingmaximum winds.3.2.6 Influences of northwestern Pacific typhoons along the southeast coast of China
Typhoons in the Northwest Pacific Ocean havean important climatological influence, especially thosethat make l and fall on the southeast coastal regions ofChina. Typhoons often bring disastrous winds. Basedon the observation data, the frequency of typhoons hassignificantly declined(Fig. 5). This finding is consistentwith previous research(Ren et al., 2006; Wang et al., 2006; Wang and Zhang, 2006; Hu and Song, 2009). Previous studies also indicate that the strengthof strong typhoons has weakened during the last 50years(Emanuel, 2005; Wu et al., 2007; James et al., 2008). Figure 5 shows that the gale day frequency insub-regions 8 and 12 correlates with the frequency oftyphoon activity in the Northwest Pacific Ocean withcoefficients of 0.46 and 0.56 at the 99.9% significancelevel, respectively. Thus, the declining trend of boththe frequency and strength of typhoons in the NorthwestPacific Ocean is closely related to the decreasesin WSmax and the frequency of gale days in the southeastcoastal areas of China.
 |
| Fig. 5. Changes in the observed annual maximum wind speed(a; m s-1) and frequency of gale days(b; day)forsub-regions 8 and 12 located along the east coast of China, and the number of typhoons in the western Pacific(red line)from 1956 to 2004. |
Global warming can cause significant extremeevent feature changes(Ding et al., 2002; IPCC, 2007;PRCC, 2007). For example, during the last 50years, studies have shown slight increases in maximumtemperature, significant increases in minimumtemperature, increases in frequency and strength ofextreme precipitation, decreases in dust storm frequency(closely related to increased rainfall), and decreasesin frequency of strong wind events in China(Wang and Zhai, 2004). Li et al.(2011)also showedthat the changes in strong winds or wind speed extremesare due to large-scale climate changes in theregion. Therefore, global warming, especially in themid and high latitudes of the Northern Hemisphere, results in decreasing temperature differences betweenthe Northern and Southern Hemispheres, declinesin atmospheric baroclinicity, decreasing SLP gradient, possible decreases in the frequency of gale and cold wave days, and subsequently, reduced WSmaxin China. This is only the statistical relationshipbetween global(or regional)warming and maximumwind speed changes over China. The mechanism ofmaximum wind speed changes caused by global(orregional)warming is not clear. Further research isneeded to provide a more dynamic explanation.4. Climate model-projected changes in maximum wind speed across China during the late 21st century
Several studies utilizing GCMs over the last severaldecades have indicated that the GFDL−CM2−0, MRI−CGCM2, and CCCMA−CGCM3 models areable to simulate wind(at the 10-m level) and temperaturechanges in China(Wang et al., 2001; Zhou and Yu, 2006; IPCC, 2007; PRCC, 2007; Zhao et al., 2007; Jiang et al., 2009a, 2010b). These three globalclimate models are now used to project wind features, such as WSmax, throughout China during the late 21stcentury.4.1 2046–2065 projection
The annual WSmax throughout China between2046 and 2065, as projected by both GFDL−CM2−0 and MRI−CGCM2, is likely to decrease by –4.80 and –4.55 m s-1, respectively, relative to the 1981–2000value(7.0 and 6.5 m s-1, respectively). However, theCCCMA−CGCM3 model projects a slight increase inWSmax of +0.35 m s-1. The combined results fromthese three models indicate that WSmax will decreaseby approximately –3.0 m s-1 per year from 2046 to2065 relative to the 1981–2000 value(8.5 m s-1)(seeTable 3).
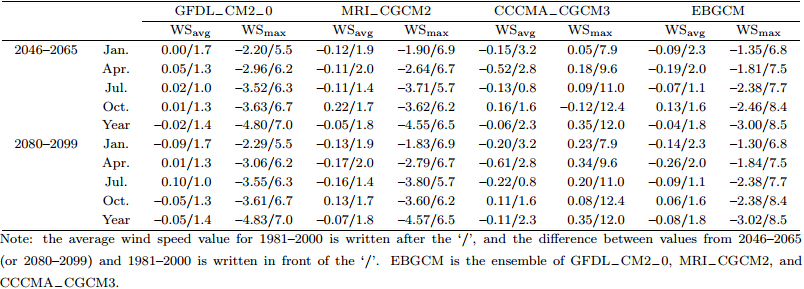 |
In each season, both GFDL−CM2−0 and MRI−CGCM2 project WSmax to be lower during2046–2065 by a range from –1.90 to –3.71m s-1 relative to the 1981–2000 value, with thelargest differences occurring in summer and autumn.The combined results from GFDL−CM2−0, MRI−CGCM2, and CCCMA−CGCM3 projectWSmax to be lower in 2046–2065 by a range from–1.35 to –2.46 m s-1 relative to the 1981–2000 value.The range of WSmax decreases is more significant thanthat of the WSavg decreases(Table 3).4.2 2080–2099 projectionThe characteristics of the annual WSmax changeduring 2080–2099 are similar to those during 2046–2065. The GFDL−CM2−0 and MRI−CGCM2 models, as well as the combined model results, show a cleardeclining trend compared to that from 1981 to 2000, while the CCCMA−CGCM3 model shows a slight increasingtrend. The range of WSmax decreases duringthe 2080–2099 period is more significant than that ofWSavg(Table 3).
Notably, the ranges of the four seasonal WSmaxdecreases during the 2080–2099 period, as projectedby the three GCMs and the ensemble of the models, are similar to the projected ranges during the period2046–2065(Table 3).
Several studies showed that, with regard to globalwarming, the frequency of cold waves accompanyingthe East Asian winter monsoon will decrease duringthe 21st century(Hu et al., 2000; Buech et al., 2003;IPCC, 2007). The decreased frequency of cold waveslikely drives the declines in WSavg and , in particular, WSmax. The changes in WSmax may also be relatedto specific extreme events, such as cold waves, duststorms, and typhoons. The frequency of cold waveswill likely decrease during the 21st century(IPCC, 2007). Approximately 10 climate models that includeanthropogenic emission data have predicted that, afterCO2 doubling, the frequency of tropical cyclonesover the Northwest Pacific Ocean is likely to decreaseby the end of the 21st century(Zhao et al., 2007) and the frequency of typhoons over the western PacificOcean making l and fall in China might decreaseas well(Knutson and Tuleya, 1999; Knutson et al., 2001; Gao et al., 2002, 2003; IPCC, 2007). Therefore, decreases in WSmax over China during the 21st centuryare related to future decreases of cold waves, and decreases in WSmax over the southeast coastal areasof China during the 21st century are corresponding tofuture decreases of typhoons.5. Concluding remarks
Based on the observation data, it is found thatannual and seasonal WSmax, frequency of gale days, and wind speed in the troposphere and lower stratospheredeclined from 1956 to 2004(especially in winter)in China. The amplitudes of annual and seasonalWSmax decreases were more significant than those ofWSavg, especially in spring.
Wind instrument renewal, station shifting, and urbanization are not major factors affecting the yearlyWSmax decline in China. The decreasing intensity ofthe East Asian winter and summer monsoons resultsin the decrease in the annual and seasonal WSmax and WSavg. The distinct decrease of cold waves in Chinais a key factor for the distinct decrease in annual and seasonal WSmax in whole China, and the declining frequencyof typhoons making l and fall were key factorsfor the distinct decrease in annual and seasonalWSmaxin the southeast coastal areas of China between 1956 and 2004.
The annual and seasonal WSmax in China during2046–2065 and 2080–2099 are likely to decreaseconsistently relative to those of the 1981–2000 period, as projected by the GFDL−CM2−0, MRI−CGCM2, and EBGCM models. The three models also projectthat the annual and seasonal reductions in WSmax inthe 21st century will be much larger than those ofWSavg. In the 21st century, the decreasing maximumwind speed over China may be related to decreases inthe intensity of the East Asian winter monsoon and the decline of cold wave frequency. In addition, thedecreasing maximum wind speed over the southeastcoastal areas of China may be related to the decreasing number of tropical cyclones over the NorthwestPacific Ocean.
| [1] | Bloom, A., V. Kortroni, and K. Lagouvardos, 2008: Climate change impact of wind energy availability in the eastern Mediterranean using the regional climate model PRECIS. Nat. Hazard Earth Sys., 8, 1247–1257. |
| [2] | Buech, C., C. Ulrich, and H. Stefan, 2003: Impacts of global warming on changes in the East Asian monsoon and the related river discharge in a global time-slice experiment. Climate Res., 24, 47–57. |
| [3] | China Meteorological Adminisitration (CMA), 2003: Ground Surface Meteorological Observation. China Meteorological Press, Beijing, 157 pp. (in Chinese) |
| [4] | Cook, K. H., and E. K. Vizy, 2006: Coupled model simulations of the western African monsoon system: The 20th century simulations and the 21st century predictions. J. Climate, 19, 3681–3703. |
| [5] | Ding, R. Q., J. P. Li, S. G. Wang, et al., 2005: Decadal change of the spring dust storm in Northwest China and the associated atmospheric circulation. Geophys. Res. Lett., 32, L02808, doi: 10.102912004GL021651. |
| [6] | Ding Yihui, Zhang Jin, and Song Yafang, 2002: Changes in weather and climate extreme events and their association with the global warming. Meteor. Mon., 28(3), 3–7. (in Chinese) |
| [7] | Emanuel, K. A., 2005: Increasing destructiveness of tropical cyclones over the past 30 years. Nature, 436, 686–688. |
| [8] | Gao Xuejie, Zhao Zongci, and Filippo Giorgi, 2002: Changes of extreme events in regional climate simulations over East Asia. Adv. Atmos. Sci., 19(5), 927–942. |
| [9] | —–, Lin Yiye, and Zhao Zongci, 2003: Impacts of greenhouse effect on typhoon over China as simulated by a regional climate model. J. Trop. Oceanogr., 22(4), 77–83. (in Chinese) |
| [10] | Guo Qiyun, 1983: The summer monsoon intensity index in East Asia and its variation. Acta Geogr. Sinica, 38(3), 207–217. (in Chinese) |
| [11] | —–, Cai Jingning, Shao Xuemei, et al., 2004: Studies on the variations of East Asian summer monsoon during AD 1873–2000. Chinese J. Atmos. Sci., 28(2), 206–215. (in Chinese) |
| [12] | Guo Yufu, Yu Yongqiang, Liu Xiying, et al., 2001: Simulation of climate change induced by CO2 increasing for East Asia with IAP/LASG GOALS model. Adv. Atmos. Sci., 18(1), 53–66. |
| [13] | Hao, Y. B., H. S. Niu, Y. F. Wang, et al., 2011: Rainfall variability in ecosystem CO2 flux studies. Climate Res., 46, 77–83, doi: 10.3354/cr00975. |
| [14] | Hu Yamin and Song Lili, 2009: Climatologically statistical features of typhoon season parameters of tropical cyclones land falling in China. Adv. Climate Change Res., 5(2), 90–94. (in Chinese) |
| [15] | Hu, Z., B. Lennart, and A. Klaus, 2000: Impact of the global warming on the Asian winter monsoon in a coupled GCM. J. Geophys. Res., 105, 4607–4624. |
| [16] | IPCC, 2007: Climate Change 2007: The Physical Science Basis. Contribution of Working Group I to the Fourth Assessment Report of the Intergovernmental Panel on Climate Change. Solomon, S., D. Qin, M. Manning, et al., Eds. Cambridge University Press, Cambridge, United Kingdom and New York, NY, USA, 996 pp. |
| [17] | James, B. E., P. K. James, and H. J. Thomas, 2008: The increasing intensity of the strongest tropical cyclones. Nature, 455(4), 92–95. |
| [18] | Jiang Ying, Luo Yong, Zhao Zongci, et al., 2009a: Evaluation of wind speeds in China as simulated by global climate models. Acta Meteor. Sinica, 67(6), 1020–1029. (in Chinese) |
| [19] | —–, —–, —–, et al., 2009b: Review of research on wind resources changes in China and in the world. Sci. Tech. Rev., 27(13), 96–104. (in Chinese) |
| [20] | —–, —–, —–, et al., 2010a: Changes in wind speed over China during 1956–2004. Theor. Appl. Climatol., 99(3), 421–430. doi: 10.1007/s00704-009-0152-7. |
| [21] | —–, —–, —–, et al., 2010b: Projections of wind changes for the 21st century in China by three regional climate models. Chinese Geogr. Sci., 20(3), 226–235. doi: 10.1007/s11769-010-0226-6. |
| [22] | —–, —–, —–, et al., 2010c: Projection of wind speed changes in China in the 21st century by climate models. Chinese J. Atmos. Sci., 34(2), 323–336. (in Chinese) |
| [23] | —–, —–, —–, et al., 2010d: Projection of wind power density in China in the 21st century by climate models. Resour. Sci., 32(4), 640–649. (in Chinese) |
| [24] | Knutson, T. R., and R. E. Tuleya, 1999: Increased hurricane intensities with CO2-induced warming as simulated using the GFDL hurricane prediction system. Climate Dyn., 15(7), 503–519. |
| [25] | —–, E. T. Robert, W. X. Shen, et al., 2001: Impact of CO2-induced warming on hurricane intesities as simulated in a hurricane model with ocean coupling. J. Climate, 14, 2458–2468. |
| [26] | Lei Xiaotu, Xu Ming, and Ren Fumin, 2009: A review on the impacts of global warming on tropical cyclone activities. Acta Meteor. Sinica, 67(5), 679–688. (in Chinese) |
| [27] | Li Yan, Wang Yuan, and Tang Jianping, 2007: Temporal and spatial variation characteristics in near-surface wind energy in China. J. Nanjing Univ. (Natural Science), 43(3), 61–72. (in Chinese) |
| [28] | Li Zhen, Yan Zhongwei, Tu Kai, et al., 2011: Changes in wind speed and extremes in Beijing during 1960–2008 based on homogenized observations. Adv. Atmos. Sci., 28(2), 408–420. |
| [29] | Phillips, T. J., and P. J. Gleckler, 2006: Evaluation of continent precipitation in the 20th century climate simulation: The utility of multi-model statistics. Water Resource Res., 42, W03202, doi: 10.1029/2005WR004313. |
| [30] | PRC Committee of Editing Climate Change Assessment Report (PRCC), 2007: China’s National Assessment Report on Climate Change. Scientific Press, Beijing, 422 pp. (in Chinese) |
| [31] | Pryor, S. C., R. J. Barthelmie, and E. Kjellstrom, 2005: Potential climate change impact on wind energy resources in northern Europe: Analyses using a regional climate model. Climate Dyn., 25, 815–835. |
| [32] | Qian, W. H., L. S. Quan, and S. Y. Shi, 2002: Variations of the dust storm in China and its climatic control. J. Climate, 15, 1216–1229. |
| [33] | —–, and X. Lin, 2004: Regional trends in recent temperature indices in China. Climate Res., 27(2), 119–134, doi: 10.3354/cr027119. |
| [34] | —– and Zhang Weiwei, 2007: Changes in cold wave events and warm winter in China during the last 46 years. Chinese J. Atmos. Sci., 31(6), 1266–1278. (in Chinese) |
| [35] | Ren, F. M., L. G. Wu, W. J. Dong, et al., 2006: Changes in tropical cyclone precipitation over China. Geophys. Res. Lett., 33, L20702, doi: 10.1029/2006GL027951. |
| [36] | Ren Guoyu, Guo Jun, Xu Minzhi, et al., 2005: Climate changes of China’s mainland over the past half century. Acta Meteor. Sinica, 63(6), 942–956. (in Chinese) |
| [37] | Rockel, B., and K. Woth, 2007: Future changes in near surface wind speed extremes over Europe from an ensemble of RCM simulations. Climatic Change, doi: 10.1007/s10584-006-9227-y. |
| [38] | Shi Neng, 1996: Features of the East Asian winter monsoon intensity on multiple time scale in recent 40 years and their relation to climate. J. Appl. Meteor. Sci., 7(2), 175–182. (in Chinese) |
| [39] | Wang Cunzhong, Niu Shengjie, and Wang Lanning, 2009: Multi-time scale variation of stand-dust storm in China during 1958–2007. Trans. Atmos. Sci., 32(4), 507–512. |
| [40] | Wang Shaowu and Ye Jinlin, 1995: An analysis of global warming during the last one hundred years. Chinese J. Atmos. Sci., 19(5), 545–553. (in Chinese) |
| [41] | —–, Gong Daoyi, and Zhou Tianjun, 2001: Twentiethcentury climatic warming in China in the context of the Holocene. Holocene, 11, 313–321. |
| [42] | Wang Xiaoling and Zhai Panmao, 2004: The spatial and temporal variations of spring dust storms in China and its associations with surface winds and sea level pressures. Acta Meteor. Sinica, 62(1), 96–103. (in Chinese) |
| [43] | —–, Wang Yongmei, Ren Fumin, et al., 2006: Interdecadal variations in frequencies of typhoon affecting China during 1951–2004. Adv. Climate change Res., 3(10), 66–69. |
| [44] | Wang Xinmin, Zou Xukai, and Zhai Panmao, 2007: Researches on extratropical cyclone variability in the Northern Hemisphere. Adv. Climate Change Res., 3(3), 154–161. (in Chinese) |
| [45] | Wang Xiuping and Zhang Yongning, 2006: Interdecadal change of the landing tropical cyclone tracks over China. J. Dalian Maritime Univ., 32(3), 41–45. (in Chinese) |
| [46] | Wang Zhunya, Ding Yihui, He Jinhai, et al., 2004: An updating analysis of the climate changes in China in recent 50 years. Acta Meteor. Sinica, 62(2), 228–236. (in Chinese) |
| [47] | —– and —–, 2006: Climate change of the cold wave frequency of China in the last 53 years and the possible reasons. Chinese J. Atmos. Sci., 30(6), 1068–1076. (in Chinese) |
| [48] | Wei Fengying, 1999: The Technologies of Statistics Diagnosis and Forecast in Modem Climate. China Meteorological Press, Beijing, 269 pp. (in Chinese) |
| [49] | Wei Junhong and Lin Zhaohui, 2009: The leading mode of wintertime cold wave frequency in northern China during the last 42 years and its association with Arctic ocillation. Atoms. Oceanic Sci. Lett., 2(3), 130–134. |
| [50] | World Meteorological Organization (WMO), 2004: Guidelines on Quality Control Procedures for Data from Automatic Weather Stations. CBS/OPAG2IOS/ ET AWS23/DOC, 4(1), 1–9. |
| [51] | Wu, L. G., B. Wang, and Scott A. Braun, 2007: Implications of tropical cyclone power dissipation index. Int. J. Climatol., doi: 10.1002/joc.1573. |
| [52] | Xu, M., C. P. Chang, C. B. Fu, et al., 2006: Steady decline of East Asian monsoon winds in 1969–2000: Evidence from direct ground measurements of wind speed. J. Geophys. Res., 111, D24111, doi: 10.1029/2006JD007337. |
| [53] | Yan Zhongwei and Yang Chi, 2000: Geographical patterns of extreme climate changes in China during recent decades. Climatic Environ Res., 5(3), 267–372. (in Chinese) |
| [54] | Yang, H. L., Y. L. Xu, L. Zhang, et al., 2010: Projected change in heat waves over China using the PRECIS climate model. Climate Res., 42(1), 79–88, doi: 10.3354/cr00860. |
| [55] | Zhang Aiying, Ren Guoyu, Guo Jun, et al., 2009: Change trend analyses on upper-air wind speed over China in past 30 years. Plateau Meteor., 28(3), 680–687. (in Chinese) |
| [56] | Zhang Li, Ding Yihui, and Sun Ying, 2008: Test of the East Asian summer monsoon rainfall simulated by global sea-air coupling model. Chinese J. Atmos. Sci., 32(2), 261–270. (in Chinese) |
| [57] | Zhao Ping and Zhou Zijiang, 2005: East Asian subtropical summer monsoon index and its relationships to rainfall. Acta Meteor. Sinica, 63(6), 933–941. (in Chinese) |
| [58] | Zhao Zongci, Luo Yong, Gao Xuejie, et al., 2007: Projections of typhoon changes over the western North Pacific Ocean for the 21st century. Adv. Climate Change Res., 3(3), 158–161. |
| [59] | Zhou, T. J., and R. C. Yu, 2006: Twentieth century surface air temperature over China and the globe simulated by coupled climate models. J. Climate, 19(22), 5843–5858. |
| [60] | Zhou Tianjun, Li Lijuan, Li Hongmei, et al., 2008: Progress in climate change attribution and projection studies. Chinese J. Atmos. Sci., 32(4), 906–922. (in Chinese) |
| [61] | Zhu, J. H., and X. Z. Liang, 2005: Regional climate model simulation of U. S. soil temperature and moisture during 1982–2002. J. Geophys. Res., 110, D24110, doi: 10.1029/2005JD006472. |