 2012, Vol. 26
Article Information
- Xia Rudi, Wang Donghai, Sun Jianhua, WANG Gaili, and XIA Guancong. 2012.
- An Observational Analysis of a Derecho in South China
- J. Meteor. Res., 26(6): 773-787
-
Article History
- Received November 3, 2011
- in final form June 28, 2012


2 Institute of Atmospheric Physics, Chinese Academy of Sciences, Beijing 100029;
3 Zhongshan Meteorological Service, Zhongshan 528400
This derecho event had many similarities with derechos observed in western countries. For example, the windstorm was perpendicular to the mean flow, the gale was located in the bulging portion of the bow echo, and the derecho moved southward along with the surface front. Some differences were observed as well. The synoptic-scale forcing was weak in the absence of an advancing high-amplitude midlevel trough and an accompanying strong surface cyclone; however, the vertical wind shear was very strong, a characteristic typical of derechos associated with strong synoptic-scale forcing. Extremely high values of convective availa- ble potential energy and downdraft convective available potential energy have previously been considered necessary to the formation of weak-forcing archetype and hybrid derechos; however, these values were much less than 2000 J during this derecho event.
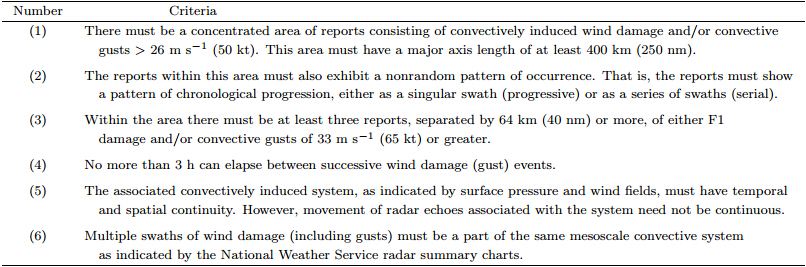
Derecho, a Spanish word introduced as a meteorological term by Hinrichs(1888), refers to a type ofsevere convective events that produce widespread and long-lived straight-line windstorms. Squall lines, bowecho systems, and supercells can all induce derechos.Johns and Hirt(1987)established criteria for distinguishing derechos from other severe windstorms(Table 1). These criteria have since been adopted either directly or with slight adjustment by a number of scholars(Bentley and Mote, 1998; Evans and Doswell III, 2001; Gatzen, 2004; Coniglio and Stensrud, 2004; Ashley et al., 2005).
Johns and Hirt(1987)divided 70 derechos intotwo categories: progressive derechos and serial derechos. Some derechos have characteristics of both typesbut are nevertheless assigned to only one category.The squall line systems that produce progressive derechos are oriented nearly perpendicular to the mean airflow, and often contain downbursts in the bulging partof the squall line system. A series of line-shaped echoesor bow echoes can also induce a progressive derecho.The squall line systems producing serial derechos areoriented at smaller angles relative to the mean airflow, and downbursts are typically located on the northside of the squall line system. The scale of serialderechos is often larger than the scale of progressivederechos.
Evans and Doswell III, 2001 divided derechosinto three categories according to synoptic conditions:weak-forcing, strong-forcing, and hybrid derechos. Astrong-forcing derecho is situated ahead of a middletroposphere trough and accompanied by surface cyclones. A weak-forcing derecho is associated with astronger lower tropospheric inflow and cold pool, similar to a progressive derecho. The convective availablepotential energy(CAPE) and downdraft convectiveavailable potential energy(DCAPE)associated with aweak-forcing derecho are higher than those associatedwith a strong-forcing derecho. The values of CAPE and DCAPE associated with a hybrid derecho are intermediate between the other two types.
Derechos occur frequently in Europe and theUnited States(Gatzen, 2004; Bentley and Mote, 1998;Coniglio and Stensrud, 2004). By contrast, reports ofderechos in China are scarce, although some previousconvective windstorms may have reached the criteria.The reason may simply be that this nomenclature hasnot yet been used in China. A number of studies havefocused on squall lines or bow echoes in China(e.g., Yao et al., 2008; Chen et al., 2009; Sun et al., 2011;Wang et al., 2011), both of which are capable of producing derecho events.
Widespread heavy rainfall, hail, and thunderstorms occurred over Guangdong Province in Chinaduring 0000-0600 UTC 17 April 2011. Hail was observed sequentially in Foshan, Guangzhou, and Zhaoqing in Guangdong Province. Automatic weather stations in both Foshan and Guangzhou recorded windgusts greater than 42 m s-1, the strongest gusts observed since the automatic weather stations began taking measurements in 1994. In this event, gales(windgusts > 17 m s-1)persisted for 6 h between 0000 and 0600 UTC on 17 April, with the major axis lengthmeasuring approximately 350 km(Fig. 1). Note thatthe main echo moved over the ocean after 0700 UTC;due to an inability to obtain additional measurementsover the ocean, it is difficult to determine whetherstrong winds continued, but the weakening of the radarecho after 0700 UTC suggests a weakening of windspeeds. Strong gales(gusts > 23 m s-1)lasted 5 h and traveled approximately 280 km. Whole gales(gusts >26 m s-1)occurred in two time periods with a 1-h interlude, lasting a total of 4 h. Gusts during the firstperiod reached a Fujita class of F0(18-32 m s-1), butthe strongest gusts occurred during the second period(0500-0600 UTC), when winds reached a Fujita classof F1(33-50 m s-1)(Fujita, 1981). The gales progressed in the same direction as the movement of thewindstorm(Fig. 2), and are primarily characterizedby damaging straight-line winds.
 |
| Fig. 1. Radar-observed positions of the central axis(blue line)of the area of strong echo(radar reflectivity factor ≥ 45dBZ)at 30-min intervals between 0000 and 0630 UTC 17 April 2011. The symbols represent gusts(≥ 17 m s-1), with different colors representing different wind speeds and different symbols representing different times. |
 |
| Fig. 2. Distributions of gusts(≥ 17 m s-1)at(a)0300UTC, (b)0400 UTC, and (c)0500 UTC 17 April 2011.The digits represent the occurrence times of the gales tothe nearest minute. |
The windstorm was produced and maintained bythe same mesoscale convective system throughout itsexistence(Fig. 3); this system is called a derechoproducing mesoscale convective system(DPMCS).The magnitude of the strong radar echoes(SRE; radarreflectivity factor > 45 dBZ)that were associated withthe windstorm changed only slightly during its duration, but the morphology of the SRE area experienced a series of substantial changes(Fig. 4). Thewindstorm moved southeastward in t and em with theDPMCS(Figs. 1 and 3). Although this event did notmeet criterion(1)in Table 1(because the path of gustslarger than 26 m s-1 was less than 400 km), it metcriteria(2)through(6)in Table 1 and had the classic characteristics of derechos. We thus consider thiswindstorm to be a derecho event.
 |
| Fig. 3. Visible satellite images from 0000 to 0500 UTC17 April 2011 observed by the FY-2E satellite. GX meansGuangxi Region and GD denotes Guangdong Province. |
 |
| Fig. 4. Composite radar reflectivity factors from 0005 to 0718 UTC 17 April 2011. The first two figures on the toppanel are observed by the radar at Wuzhou; the remainders are observed by the radar at Guangzhou. |
 |
This event affected 2155 people, injured 153 people, and killed 17 people. The characteristics and causes of the DPMCS in this event should be investigated to enrich our knowledge about derechos in China and improve future forecasts of similar events. In thispaper, the characteristics of the derecho on 17 April2011 in South China are studied by analyzing observational data from multiple platforms, with an emphasison the characteristics of the windstorm and the environment in which it formed. This event is compared and contrasted with derechos observed in Europe and the United States.
The data employed in this study include conventional surface and sounding observations, automaticstation observations, Doppler weather radar data, and FY-2E satellite observations. These datasets havebeen provided by the National Meteorological Information Center and the National Satellite Meteorological Center in China. The remainder of this paper isarranged as follows: the characteristics of the DPMCSas observed by the FY-2E satellite and radar stationsin South China are analyzed in Section 2, the formation and maintenance of the gales during differentstages are examined in Section 3, the environmentalconditions contributing to the windstorm are discussedin Section 4, and conclusions and discussion are provided in Section 5.2. Observational characteristics of the DPMCS
Infrared images(figure omitted)illustrate that aDPMCS existed at 1900 UTC 16 April 2011. At thisinitial stage, the DPMCS was located to the north of adecaying meso-ff-scale convective system in the middle and north of Guangxi Region. The horizontal scale ofthe DPMCS was approximately 40 km at this stage.At 2300 UTC 16 April 2011, the cloud top height of theDPMCS increased and its horizontal scale exp and ed toapproximately 200 km.
During the development of the DPMCS, the western edge of the DPMCS had a clear boundary and shadow, while the northeastern edge had thread-likeoutflows(Fig. 3). This phenomenon indicates that thecloud top was higher and the convection was strongerin the western part of the system. The shadow indicates attenuation of solar radiation. The configurationof the system also indicates that the mean flow wassouthwesterly. A clear boundary formed in the opposite direction of the mean flow and thread-like tailsformed in the same direction as the mean flow as thethunderstorm anvil exp and ed. The shadow faded after 0500 UTC 17 April due to a decrease in the heightof the cloud top associated with the weakening of theDPMCS.
The radar-observed echo was concentrated mainlyin the eastern part of the DPMCS. The evolutionof SRE area can be divided into two stages: ahigh-precipitation supercell stage(0005-0442 UTC 17April) and a non-supercell stage(0448-0718 UTC 17April). During the non-supercell stage, the radar echowas sequentially observed to be kidney-shaped, footshaped, and ordinary single cell.2.1 Characteristics of the supercell stage
At 0005 UTC 17 April, several single-cell convective storms formed near Wuzhou in Guangxi Region(Fig. 4). At 0035 UTC, these single-cell stormsmerged to form a line echo with a southwest-northeastorientation. At 0200 UTC, the line echo moved intoGuangdong Province(Fig. 1) and bent into a bowshape. Radar reflectivity in the echo core in the southof the SRE area reached 60 dBZ(Fig. 4). The stronggradient of reflectivity in this area at the 2.4° elevation angle(area indicated by the arrows in Fig. 5a), called the low-level inflow notch, was coincident withradial velocity convergence at the 2.4° elevation angle(Fig. 5c) and the location of the SRE core at the9.9° elevation angle(Fig. 5b). This indicates that anecho was located directly above the weak echo region(WER)at this time. The low-level inflow notch wassustained and accompanied by a mesovortex duringthe evolution stage of the bow-echo configuration supercell. The radial velocity in the SRE core area wasdivergent in the middle troposphere(Fig. 5d), illustrating that the low-level inflow created updrafts thatdiverged upon reaching the middle troposphere. At0312 UTC, an echo vault was observed in the profileacross the SRE area, and the storm top was locatedabove the bounded WER(Fig. 6a). Both of thesefeatures are classic characteristics of supercells.
 |
| Fig. 5. Reflectivity factor(a, b) and radial velocity(c, d)observed by the Guangzhou radar at 0200 UTC 17 April2011.(a, c)2.4° elevation and (b, d)9.9° elevation. Arrows point to the same horizontal position; the altitude of theindicated position is approximately 1.8 km at 2.4° elevation and 6.7 km at 9.9° elevation. See the color bars in Fig. 6. |
 |
| Fig. 6.(a)Cross-section of radar reflectivity factor along L1(see Fig. 4)observed by the Guangzhou radar at 0312UTC 17 April 2011.(b)Cross-section of radial velocity along L2(see Fig. 4)at 0448 UTC 17 April 2011. |
At 0324 UTC, the north part of the bow echo tookthe shape of a left parenthesis(Fig. 4). At 0348 UTC, this left-parenthesis-shaped echo disappeared and theSRE area returned to a bow shape. The north part ofthe bow echo was spiral shaped at this point due tothe influence of a mesovortex. At 0424 UTC, the radial velocity was divergent in the northern part of thebow echo at the 1.5°, 2.4°, and 3.4° elevation angles.This divergence strengthened with time, and a mesoanticyclone appeared in the echo at the 1.5° elevationangle at 0442 UTC. The northern end of the bow echoweakened and disappeared as the divergence strengthened.
Heavy rainfall occurred in the area that the SREpassed during the evolution of the bow-echo configuration supercell(Fig. 7a); this is a classic characteristicof a high-precipitation supercell(Moller et al., 1994).Moreover, frequent lightning occurred in the heavyrainfall area. Previous studies indicate that highprecipitation supercells often induce dangerous hail, gales, and heavy rainfall, but do not generally producesevere tornados(Johns, 1993). High-precipitation supercells can develop in a variety of ways; developmentof a bow-echo configuration high-precipitation supercell often leads to surface gales(> 25 m s-1) and largehail(diameter > 1.9 cm), and such systems alwaysmove along the surface boundaries(front, dry line)(Klimowski et al., 2004). A WER persisted in therear flank of this high-precipitation supercell throughout its evolution(Fig. 4). This WER was related tothe rear inflow in the middle troposphere.
 |
| Fig. 7. Hourly precipitation(crosses of different colors represent different precipitation levels; mm), surface wind(eachfull barb represents 4 m s-1), lighting strikes(yellow dots), and radar reflectivity factor(shadings; dBZ)at 4-km altitude at(a)0300 UTC, (b)0400 UTC, and (c)0500 UTC 17 April 2011. |
At 0448 UTC, the bow echo broke in the middle section(Fig. 4). Mid-altitude radial convergence(MARC)occurred on the profile across line L2(Fig. 6b), which is indicative of the existence of gales atthe ground level(Przybylinski, 1995). At 0500 UTC, the SRE area in the southern part of the system became kidney shaped, with a WER in the rear region and an overhanging echo along the arc-shaped easternedge. Reflectivity factors in this kidney-shaped areawere radialized at the 0.5° elevation angle prior to evolving into a foot-shaped echo at 0530 UTC. Radializedechoes and foot-shaped echoes are both characteristic of downbursts. The foot-shaped echo broke intotwo parts at 0548 UTC. The northern part weakenedgradually while the southern part evolved into an ordinary single cell. The reflectivity of the SRE area inthis ordinary single cell increased at 0618 UTC beforedecreasing at 0630 UTC.3. The formation of gales at ground level during different stages3.1 Supercell stage
The outflow boundary of a convective storm, usually indicated by a fine line on weather radar images, isa storm-scale boundary that separates the storm fromthe surrounding air. The outflow boundary is sometimes very close to the storm. Growing separation between the outflow boundary and the storm indicatesthat the storm is weakening. The outflow boundaryof the storm analyzed here was located very close tothe storm, especially during the supercell stage whena convergence line of radial velocity was located nearthe southeastern leading edge of the SRE area(see examples in Fig. 8c).
The maximum radial velocity in the lower troposphere occurred in the eastern part of the bow echo.Some velocity ambiguity existed at the 0.5° elevationat 0312 UTC(Fig. 8a), when the center of negative velocity reached -31 m s-1 approximately 1.9 km abovethe ground at the apex of the bow. The maximum negative velocity at the 2.4° elevation angle was also -31m s-1, approximately 5.9 km above the ground nearthe rear inflow notch of the bow echo(Fig. 8b). Thisrear inflow jet can dive rapidly toward the ground, creating strong downdrafts and straight-line winds. Theradial velocity convergence line in the middle troposphere was located to the west of the radial velocityconvergence line in the lower troposphere(Figs. 8c and 8d), indicating that the existence of a westward-tiltingupdraft at the eastern leading edge of the bow echo.Starting at 0354 UTC, the convergence line lengthened and departed from the SRE area.
 |
| Fig. 8. Reflectivity factor(a, b) and radial velocity(c, d)observed by the Guangzhou radar at 0312 UTC 17 April2011.(a, c)0.5° elevation angle(the area indicated by the arrow is approximately 112 km from the radar and 1.9 km inaltitude) and (b, d)2.4° elevation angle(the area indicated by the arrow is approximately 116.5 km from the radar and 6 km in altitude). See the color bars in Fig. 6. |
The convergence line to the south of the bow-echoconfiguration supercell approached the SRE beginningat 0430 UTC, while the convergence line to the northof the supercell moved further from the SRE. As indicated in Section 2, the northern part later disappearedwhile the southern part developed into first kidneyshaped and then foot-shaped echoes. The characteristic of the convergence at this time differed from thatduring the previous stage. For example, the convergence line to the south of the SRE was observed onlyat the 0.5° elevation angle at 0430 UTC; the radialvelocity was divergent in the corresponding area atthe 6.0° elevation angle. In fact, this pattern of convergence at low levels and divergence above was firstobserved at 0424 UTC. The radial velocity maximumno longer tilted westward at this time, with maximumnegative velocities of -31 m s-1 at the 0.5° elevationangle(approximately 0.6 km above the ground) and -37 m s-1 at the 1.5° elevation angle(approximately1.3 km above ground). The maximum absolute velocity at immediately subsequent times always exceeded31 m s-1, indicating that ground-level wind speedswere very high(generally, wind speeds in excess of 20m s-1 within 1 km of the ground can be consideredvery high). The SRE was located in a radar blind zoneat 0506 UTC. From 0512 to 0606 UTC, the maximumradial velocity near 1-km altitude was 23 m s-1. After0612 UTC, the radar echo of the SRE was located morethan 60 km from the radar; accordingly, the characteristics of the system at 1-km altitude were not capturedby the radar at the 0.5° elevation angle. Based on theapparent decay of the SRE at this time, it is likelythat the surface wind speed was decreasing.
From 0524 to 0536 UTC, the retrieved radial velocities were ambiguous to the southeast of the SREcore at the 0.5° elevation angle(approximately 0.5km), with a maximum outflow speed of 31 m s-1. At0530 UTC, the flow to the northwest of the SRE corewas oriented towards the radar(Fig. 9a), indicatingdivergence of radial velocity near the SRE core. Thisdivergence was distributed vertically between the 0.5° and 2.4° elevation angles; that is, the flow near theSRE core was divergent below 1.2-km altitude. Meanwhile, the flow was convergent at approximately 5-kmaltitude(Fig. 9b). Review of the radar images fromearlier in the day indicates that this pattern of divergence in the boundary layer and convergence in themiddle troposphere began at 0500 UTC. The divergence in the boundary layer was strongest at 0530UTC. The horizontal distance between the positive and negative velocity centers was approximately 8 km, with a difference in velocity of 43 m s-1(Fig. 9a).The boundary layer divergence weakened and the divergent area departed from the SRE core after 0530UTC, disappearing altogether after 0548 UTC. Theconvergence in the middle troposphere disappeared ater 0536 UTC. The intensification of the divergence inthe boundary layer from 0500 to 0530 UTC accompanied a growth and strengthening of the SRE core atthe 0.5° elevation angle. These characteristics indicatethe occurrence of a downburst between 0500 and 0548UTC along with the sinking of the SRE core.
 |
| Fig. 9. Radial velocity observed by the Guangzhou radar at 0530 UTC 17 April 2011 along(a)the 0.5° elevationangle(the area indicated by the arrow is approximately 0.5 km in altitude) and (b)the 9.9° elevation angle(the areaindicated by the arrow is approximately 5.4 km in altitude). The arrows in(a) and (b)indicate the same horizontalposition approximately 30 km from the radar. See the color bar in Fig. 6b. |
The SRE area evolved into an ordinary single cellstorm by 0600 UTC. The core of this storm was stilllocated in the southern portion of the SRE area. Anarea of divergence developed again around the SREcore at approximately 1-km altitude. The differencein azimuth angle between the positive and negativevelocity centers was approximately 2°, while the difference in velocity was approximately 30 m s-1. Thissame horizontal area contained convergence between2- and 4-km altitude. Relative to the first downburst, the level of the convergence was lower and the magnitude of the divergence was smaller. The area of negative velocity grew in size after 0600 UTC but themagnitude of the divergence did not change, implyingthat an outward spread of the downdraft at lower levels. At 0630 UTC, the radar reflectivity in the echocore at the 0.5° elevation angle increased suddenly tomore than 65 dBZ. The layer of divergence extendedupward to approximately 2.7 km at this time, indicating that a weaker downburst and a deeper divergentlayer accompanied the sinking of the core. The singlecell echo weakened and split into several smaller single cells at 0642 UTC. The maximum single cell echo(53 dBZ)was located in the south, and the maximumhorizontal scale was approximately 15 km.
At 0648 UTC, the maximum reflectivity of thebiggest single cell increased to 57 dBZ. Divergencewas observed around the SRE area; however, the areaof this divergence was smaller than the two previousdownbursts. The difference between the centers of positive and negative velocity near 1.5 km altitude wasapproximately 14 m s-1. Convergence was observedat 3.5 and 5 km altitude. The divergence observedat the 0.5° elevation angle weakened at subsequentobservation times. After 0706 UTC, the SRE was located more than 110 km from the radar; thus the radarobservations could not capture the wind distributionbelow 1 km.
Above all, the causes of the gale can be dividedinto two stages. The first stage corresponded to thebow-echo configuration supercell stage, in which thegale was mainly attributable to a sinking rear inflow jet. The second stage corresponded to the nonsupercell stage, in which the gale was mainly attributable to downbursts. Three downbursts could beidentified in the radar images.
Previous research has indicated that straight-linewindstorms can be related to mesovortices(Trapp and Weisman, 2003). As mentioned in Section 2, twoclasses of mesovortex occurred during the bow-echoconfiguration supercell stage. One mesovortex was related to the low-level inflow notch while the other wasrelated to the spiral-shaped echo in the northern partof the supercell. However, the gale was observed primarily at the eastern bulge of the bow echo. The differences in the locations of the mesovortices and the galeimply that the gale was independent of the mesovortices.
The two categories of gale can also be differentiated in the satellite images(Fig. 3). From 0000to 0300 UTC 17 April, several b and s of arc cloudswere observed to the south of the DPMCS. Thesearc clouds were most prominent at 0300 UTC, whenthey were located in the area corresponding to theradar echoes(figure omitted). The arc clouds were related to the outflow boundary of the bow echo. Thearc clouds weakened and disappeared starting at 0400UTC, likely due to downbursts, and were replaced byless-organized clouds.4. Environmental conditions
A low-level cyclonic shear line oriented in thesouthwest-northeast direction(Figs. 10a and 10b)contributed to the convergence and upward motion ofairflow. There was no obvious trough at 500 hPa, norwas there a synoptic-scale cyclone at the surface(Figs.10 and 11), indicating that the synoptic-scale forcingwas not strong(Evans and Doswell III, 2001). Theconditions that led to the windstorm are discussed inthe following sections.
 |
| Fig. 10. Geopotential height(10 gpm), temperature(℃), wind field(each barb on a bar represents 4 m s-1), and dew point depression(℃)at 0000 UTC 17 April 2011 at(a)925 hPa, (b)850 hPa, (c)700 hPa, and (d)500 hPa. Theshaded areas represent convective cloud clusters. The lines at 925 and 850 hPa indicate shear lines of horizontal wind.GX means Guangxi Region and GD denotes Guangdong Province. |
 |
| Fig. 11. Sea-level pressure(grey contours; hPa), surfacewinds(each barb on a bar represents 4 m s-1), temperature(digits; ℃), radar reflectivity factor at 4 km(blackcontours; 45 dBZ), and convective cloud clusters(shadedarea)at(a)0100 UTC, (b)0300 UTC, and (c)0500 UTC17 April 2011. |
The DPMCS covered Wuzhou in Guangxi Regionat 0000 UTC 17 April. A sounding(Fig. 12)takenby Wuzhou station at this time shows the existenceof a dry layer in the middle troposphere. The convective available potential energy(CAPE)was 1184J, and the convective inhibition(CIN)was 0 J. Bothof these values indicate a favorable environment forconvection. The 0℃ temperature level was located at600 hPa. This vertical location was lower than 12 hbefore and indicates favorable conditions for hail tofall to the ground. The horizontal wind rotated clockwise with increasing height, implying the existence ofwarm thermal advection and increasing unstable energy of the air column. The vertical wind shear between 0- and 3-km altitude was approximately 22 ms-1, while that from 0- to 6-km altitude was approximately 31 m s-1. These strong vertical wind shearssupported the formation of supercell storm, bow echo, low-level mesovortex, and strong outflow at lower levels(Gilmore and Wicker, 1998; Trapp and Weisman, 2003).
 |
| Fig. 12. Skew T-logp diagram observed by Wuzhou station(23.48°N, 111.30°E)at 0000 UTC 17 April 2011. Thered and green curves are the profiles of environmental temperature and dew-point temperature, respectively. Theblue curve is the temperature profile of an air parcel liftedadiabatically. The black curve is the profile of relative humidity. |
The closest sounding station to the windstorm in Guangdong was Qingyuan station(23.70°N, 113.08°E); however, this station was located 100 kmfrom the DPMCS at 0000 UTC 17 April. The sounding at Qingyuan station also indicated a dry layer inthe middle troposphere and strong vertical wind shear, but the CAPE was 553 J, much smaller than that observed at Wuzhou station.4.2 Initiation effect of surface boundaries
From 2300 UTC 16 April to 0300 UTC 17 April, the 1010-hPa isobar at sea level gradually movedsouthward(Fig. 11). Northerly winds were dominantto the north of the 1010-hPa isobar, while southerlywinds were dominant approximately 50 km south ofthis isobar. The temperature difference between thenorth and the south was apparent. The southwardmotion of northerly winds indicates that the cold airmass was stronger than the warm air mass. The isobar ceased its southward progression after 0300 UTC17 April, indicating that a balance was established between the cold and warm air masses. A persistentlow was observed in the western part of the DPMCSthroughout the development of the bow-echo configuration supercell(from 0000 to 0300 UTC 17 April).The storm moved southward with the southward progression of the cold front, a classic characteristic ofhigh precipitation supercells(Klimowski et al., 2004).The uplift induced by the front may be the mainmechanism underlying the development of the bowecho configuration supercell. The front and the bowecho configuration supercell both weakened after 0300UTC.
A surface wind convergence line was maintainedduring the derecho event at the front area of the SRE(Fig. 7)in the western part of the DPMCS(Fig. 11).At 0100 and 0200 UTC 17 April, there was convergence of northerly wind and southerly wind along thesoutheastern edge of the SRE area. This convergencearea extended between 0300 and 0400 UTC, and waslocated in the northern part of the SRE at 0600 UTC.4.3 The dry layer in the middle troposphere
The dew point depressions at 925 and 850 hPawere approximately 1 to 2℃, which is near saturation(Fig. 10). Westerly winds were dominant at 700hPa in the area close to the DPMCS. The atmospherein the vicinity of the DPMCS was near saturation, while the atmosphere along the coast of Guangdong and Guangxi was very dry. The dew point depressionin this latter region was higher than 8℃, indicating astrong contrast between wet and dry air to the southof the DPMCS. At 500 hPa, the atmosphere to thewest and south of the DPMCS was very dry, with amaximum dew point depression of 42℃. In summary, the atmosphere was very wet in the boundary layerbut very dry in the middle and upper troposphere tothe west and south of the DPMCS. This moisture configuration was beneficial to the formation of stronglow-level outflow(Gilmore and Wicker, 1998).4.4 Downdraft convective available potential energy
Downdraft convective available potential energy(DCAPE)is the maximum increase in kinetic energythat can result from evaporative cooling of the airwithin a hypothetical parcel as it descends from somesource height to the ground(Gilmore and Wicker, 1998). This index has some limitations; for example, the air mass is assumed not to mix with the surrounding environment during its descent, but the index hasbeen widely used in research and operational work.DCAPE has been defined as(Gilmore and Wicker, 1998):

At 0000 UTC, the temperature profile below 650hPa in Wuzhou was steeper than the wet adiabaticlapse rate(Fig. 12). The temperature of a descendingair parcel was therefore lower than that of the environmental atmosphere, which contributed to maintainingthe negative buoyancy of downdraft.5. Conclusions and discussion
In this paper, radar, satellite, and surface observation data were used to analyze a derecho event inGuangdong Province on 17 April 2011. The main conclusions are as follows.
(1)The derecho can be divided into two stages according to differences in the characteristics of the radarecho: a supercell stage and a non-supercell stage. Thesupercell in the first stage was a high-precipitation supercell in a bow-echo configuration. During this stage, high precipitation in the SRE area was accompaniedby frequent lightning, while precipitation was relatively light in the associated stratiform precipitationarea. A mesovortex formed at the weak echo regionin the lower troposphere associated with the low-levelinflow notch; this mesovortex was enclosed withinthe area of high precipitation. Another mesovortexformed in a spiral-shaped echo area in the northernpart of the bow echo. A V-shaped notch was observedin the rear region, which was associated with a downdraft. The high-precipitation supercell occurred in anenvironment with ample water vapor in the lower layers and a low lifting condensation level, and moved int and em with the surface front. All of these characteristics are classically associated with high-precipitationsupercells(Moller et al., 1994).
(2)The causes of the gales that occurred duringthe two stages were also different. The sinking rearinflow jet led to the gale in the first stage; this gale wasweaker than the gales induced by downbursts duringthe second stage. The SRE core sank in conjunctionwith the occurrence of the downbursts, and the windfield was divergent in the lower troposphere and convergent in the middle troposphere.
(3)A dry layer in the middle troposphere, moderate values of DCAPE and CAPE, strong verticalwind shear, a steep temperature lapse rate relative tothe moist adiabat, and horizontal wind shear in thelower troposphere all promoted the initiation of theDPMCS.
(4)The causes and structure of this derecho hadmany similarities with previously observed progressivederechos in Europe and North America. For example, the storm moved in t and em with a front, the bow echowas oriented nearly perpendicular to the mean flow, and the gales were distributed in the bulging portionof the bow echo(Johns and Hirt, 1987). The thermalboundaries also contributed significantly to the derecho, which was similar to some previous studies(Bentley et al., 2000). Not all of the characteristics of thisderecho were similar to those observed in Europe and North America, however. The synoptic-scale forcingwas not strong according to the classification of Evans and Doswell III (2001) , since the system lacked bothan advancing high-amplitude midlevel trough and anaccompanying strong surface cyclone; however, thevertical wind shear was very strong, a characteristictypical of strong-forcing archetype derechos(DoswellIII and Evans, 2003). Weak-forcing archetype and hybrid derechos are typically associated with very highvalues of CAPE and DCAPE, but CAPE and DCAPEin this case were both much less than 2000 J. A moredetailed and accurate comparison between derechosin China and those in other parts of the world willrequire the study and statistical analysis of additionalcases.
| [1] | Ashley, W. S., T. L. Mote, and M. L. Bentley, 2005: On the episodic nature of derecho-producing convective systems in the United States. Int. J. Climatol., 25, 1915-1932. |
| [2] | Bentley, M. L., and T. L. Mote, 1998: A climatology of derecho-producing mesoscale convective systems in the central and eastern United States, 1986-1995. Part I: Temporal and spatial distribution. Bull. Amer. Meteor. Soc., 79, 2527-2540. |
| [3] | --, --, and S. F. Byrd, 2000: A synoptic climatology of derecho producing mesoscale convective systems in the north-central plains. Int. J. Climatol., 20, 1329-1349. |
| [4] | Chen Yeguo, Nong Mengsong, Huang Haihong, et al., 2009: Numerical simulation and analysis on a strong squall line in South China. Meteor. Mon., 35(9), 29-37. (in Chinese) |
| [5] | Coniglio, M. C., and D. J. Stensrud, 2004: Interpreting the climatology of derechos. Wea. Forecasting, 19, 595-605. |
| [6] | Doswell III, C. A., and J. S. Evans, 2003: Proximity sounding analysis for derechos and supercells: An assessment of similarities and differences. Atmos. Res., (67-68), 117-133. |
| [7] | Evans, J. S., and C. A. Doswell III, 2001: Examination of derecho environments using proximity soundings. Wea. Forecasting, 16, 329-342. |
| [8] | Fujita, T. T., 1981: Tornadoes and downbursts in the context of generalized planetary scales. J. Atmos. Sci., 38(8), 1511-1534. |
| [9] | Gatzen, C., 2004: A derecho in Europe: Berlin, 10 July 2002. Wea. Forecasting, 19, 639-645. |
| [10] | Gilmore, M. S., and L. J. Wicker, 1998: The influence of midtropospheric dryness on supercell morphology and evolution. Mon. Wea. Rev., 126, 943-958. |
| [11] | Hinrichs, G., 1888: Tornadoes and derechos. Amer. Meteor. J., 5, 306-317, 341-349. |
| [12] | Johns, R. H., 1993: Meteorological conditions associated with bow echo development in convective storms. Wea. Forecasting, 2, 32-49. |
| [13] | --, and W. D. Hirt, 1987: Derechos: Widespread convectively induced windstorm. Wea. Forecasting, 2, 32-49. |
| [14] | Klimowski, B. A., M. R. Hjelmfelt, and M. J. Bunkers, 2004: Radar observations of the early evolution of bow echoes. Wea. Forecasting, 19, 727-734. |
| [15] | Moller, A. R., C. A. Doswell III, M. P. Foster, et al., 1994: The operational recognition of supercell thunderstorm environments and storm structures. Wea. Forecasting, 9, 327-347. |
| [16] | Przybylinski, R. W., 1995: The bow echo: observations, numerical simulations and severe weather detection methods. Wea. Forecasting, 10, 203-218. |
| [17] | Sun Hulin, Luo Yali, Zhang Renhe, et al., 2011: Analysis on the mature-stage feature of the severe squall line occurring over the Yellow River and Huaihe River basins during 3-4 June 2009. Chinese J. Atmos. Sci., 35(1), 105-120. (in Chinese) |
| [18] | Trapp, R. J., and M. L. Weisman, 2003: Low-level mesovortices within squall lines and bow echoes. Part II: Their genesis and implications. Mon. Wea. Rev., 131, 2804-2823. |
| [19] | Wang Jun, Gong Dianli, Diao Xiuguang, et al., 2011: Case study of bow echo, severe convective storm and merger process. Part I: Taking single Doppler radar data as a case. Plateau Meteor., 30(4), 1067-1077. (in Chinese) |
| [20] | Yao Yeqing, Yu Xiaoding, Zhang Yijun, et al., 2008: Analysis on a typical squall line case with Doppler weather radar data. Plateau Meteor., 27(2), 373-381. (in Chinese) |