 2012, Vol. 26
Article Information
- Zhuang Wei and Liu Liping. 2012.
- A Reflectivity Climatology Algorithm for Hybrid Scans and Its Application to Radar Coverage over the Tibetan Plateau
- J. Meteor. Res., 26(6): 746-757
-
Article History
- Received December 9, 2011
- in final form September 7, 2012


2 Nanjing University of Information Science and Technology, Nanjing 210044
Radar beam blockage reduces the quality of radardata and restricts its applications over complex terrains(Pellarin et al., 2002); accordingly, beam blockage is one of the problems that must be consideredin determining the optimal locations of weather radarsites(Bandalo, 1992). Complex terrain introduces inevitable blockages around the radar site, affecting thequality of radar data at lower elevations. The radarreflectivity at these lower elevations is the most usefulinformation for estimating surface precipitation, especially in areas of complex terrain(Joss and Waldvogel, 1990; Sauvageot, 1994). Hybrid radar scans includeonly the lowest radar bins that do not have significantblockages(O'Bannon, 1997). These radar bins, whichmay result from different tilts at different locations, consist of two-dimensional polar coordinate grids. Hybrid scans play an important role in reducing the impacts of radar beam blockages and improving radarestimates of precipitation(Chang et al., 2009). Thesescans are also highly useful for analyzing the spatialcoverage of weather radar networks(Maddox et al., 2002).
The NOAA National Severe Storms Laboratory(NSSL)developed an automatic hybrid scan algorithm(O'Bannon, 1997). It is based on the terrain, radarbeam model(or power density function), and propagation path of a radar beam. This algorithm calculatesthe beam blockage rate and hybrid scan angle of elevation, and depends on terrain data rather than theradar mode and scan strategy. Hybrid scans using thisalgorithm have been widely used in WSR-88D operational radar networks over st and ard terrains(Fulton et al., 1998), and have improved quantitative estimatesof precipitation in regions of complex terrain(Morin and Gabella, 2007).
Chinese scientists have evaluated hybrid scans bycalculating beam blockage rate(Yang et al., 2009; Xiao et al., 2008a, b); however, the beam blockage information in these algorithms is determined under theassumption of st and ard beam propagation and onlyaccounts for major blockages. The actual blockages and clutter distributions can deviate from these assumptions due to anomalous beam propagation, clutter contamination from side lobes, and blockage bytrees and buildings that are not included in terraindata.
Reflectivity climatologies have been used to studythe distributions of precipitation in a variety of geographical regions(Kuo and Orville, 1973; Steenburgh et al., 2000; Heinselman and Schultz, 2006). Thismethod has also been used to build rainfall detectionmaps that account for beam blockages not representedunder st and ard propagations(e.g., Krajewski and Vignal, 2001). These studies suggest that reflectivityclimatologies can provide useful information in areasof complex terrain, where quantitative precipitationestimates based on radar observations are often problematic due to signal blockage.
The Tibetan Plateau, which is over 4500 m abovesea level, greatly affects the weather and climate ofsoutheastern China, eastern Asia, and even the world(Xu and Chen, 2006). The objective of the third Tibetan Plateau atmospheric science experiment is toclarify the mechanisms that control the energy and water cycles of the Tibetan Plateau and surrounding areas, as well as the effects of these cycles on regional and global climate. This experiment requires a variety ofdata, including a reanalysis platform, satellite remotesensing observations, and comprehensive surface observations. Weather radar observations are an important component of the surface observational network, and are useful for underst and ing the role of cloud and precipitation processes in the water cycle over the Tibetan Plateau(Liu et al., 2002). However, the application of radar observations over the Tibetan Plateauis limited by severe beam blockage associated with thecomplex terrain. To present, little research has beendone to examine this problem. Hybrid scans can minimize the impact of terrain on radar observation data;however, the hybrid scan elevations calculated usingthe traditional terrain-based algorithm are often inaccurate because st and ard terrain data do not accountfor trees, buildings, and other surface objects(Chang et al., 2009). Therefore, one important step toward developing a more useful radar network is to constructa hybrid scan algorithm that does not rely on terraindata and radar location. Such an algorithm would reduce the impact of terrain on radar data, enhancingthe utility of the new-generation weather radar network to studies of cloud and precipitation processesover the Tibetan Plateau.
In this study, three months of radar data fromMay to July 2010 are analyzed to investigate thecharacteristics of the beam blockage distributions forradars over the Tibetan Plateau. A new hybrid scanalgorithm based on the reflectivity climatology is developed. Section 2 describes the data used to derivethe reflectivity climatology. Section 3 describes themethodology used to identify blockages in the reflectivity climatology and the derivation of the hybridscan algorithm based on this climatology. Section 4presents a comparison of hybrid scans made using thenew reflectivity climatology-based algorithm to scansmade using the traditional terrain-based algorithm.Section 5 provides an analysis of the radar coverageover the Tibetan Plateau. The results are summarizedin Section 6.2. Data2. Data2.1 Radar and terrain data
The radar data used in this paper are from two operational Doppler radars in the Qinghai weather radarnetwork. One of the radars is located in Xining whilethe other is located in Haibei. Both radars operate ona 5.5-cm wavelength(C b and )with a beam width of1°. Both radars also share the same scan mode, with avolume coverage pattern(VCP)of 21 with 9 elevationangles(0.5°, 1.5°, 2.4°, 3.4°, 4.3°, 6.0°, 9.9°, 14.6°, and 19.5°). A single scan takes 5-6 min to complete.Table 1 lists the radar parameters, including mode, longitude, latitude, elevation, and gate number.

The terrain data are 1/250-K digital elevation model(DEM)data with a resolution of0.0008333°×0.0008333°, and are provided by the StateBureau of Surveying and Mapping of China.2.2 Frequency of occurrence of reflectivity
The radar reflectivity climatology is defined as thefrequency of occurrence of reflectivity(FOR)that exceeds a certain threshold. The climatology is calculated on a pixel-by-pixel basis in(spherical)coordinates(similar to Krajewski and Vignal, 2001).
where N is the number of total volume scans, n isthe number of scans with reflectivity higher than thethreshold, and i, j, and k indicate the ordinal numbersof the radar bins in the azimuthal, range, and elevationdirections, respectively. The values of FOR range from0 to 1, with 0 indicating that no radar echoes higherthan the threshold are detected(e.g., the location isobscured by an object that completely blocks the radarbeam) and 1 indicating that echoes are detected forall scans(e.g., power return from a stationary object, such as a tall building or mountain). Approximately21600 volume scans have been obtained from the Xining radar over the three continuous months from Mayto July 2010. These volume scans are used to analyze the relationship between FOR and beam blockage.Figures 1a1-1f1 show maps of FOR(> -32 dBZ)forthe first through sixth tilts of the Xining radar, whileFigs. 1a2-1f2 show the radar reflectivity of a precipitation event at 0340 UTC 16 July 2010 observed bythe first through sixth tilts of the Xining radar.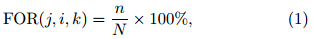
 |
| Fig. 1.(a1-f1)FOR of reflectivity > -32 dBZ from the first tilt(a1)to the sixth tilt(f1)of the Xining radar;(a2-f2)radar reflectivity observed by the Xining radar at 0340 UTC 16 July 2010 from the first tilt(a2)to the sixth tilt(f2). |
The frequency of occurrence of reflectivity and thehybrid scan reflectivity(Fig. 1)are strongly correlated, with the lowest five tilts of the Xining radarblocked to varying degrees. The radar reflectivity ismissing and the value of FOR is 0 when the radarbeam is completely blocked. The value of reflectivity is lower in partially blocked radial sectors than inadjacent unblocked radial sectors. The reflectivity iscontinuous when the radar beam is unblocked, and thevalue of FOR exceeds that of blocked areas at the sameradial distance. The purposes of this paper are(1)toidentify sectors that have no blockages and (2)to determine the lowest unblocked tilt angle of the radar forsectors with blockages(i.e., the hybrid scan elevation).3. Construction of hybrid scans by reflectivity climatology3.1 Blockage discrimination method3.1.1 Discrimination parameters
To calculate hybrid scans, it is first necessary toidentify blockage. This paper suggests the use of threeparameters to identify blockages. These parameterscan be deduced by analyzing the sample distributionfunctions derived from the calibration dataset(whereall FOR values have been manually labeled as blocked, partially blocked or unblocked). The three relevant parameters comprise the relative frequency of occurrenceof reflectivity(RFOR), the azimuthal variety of frequency of occurrence of reflectivity(AVFOR), and thevertical variety of frequency of occurrence of reflectivity(VVFOR). Calculation of these three parameters isconducted in a polar coordinate system, with determination of each azimuthal direction and the slant-rangeof every elevation angle. The resolution is 1°×0.25km(radial resolution × gate width)with a horizontalrange of 250 km. The parameters are determined asfollows.
1)Relative frequency occurrence of reflectivity(RFOR)
FOR is the frequency of occurrence of reflectivity(seeEq.(1)). FOR is more representative when moreradar volume scans are used. MFOR is the mean valueof FOR at the same range distance from the radar(Eq.(3)). The indices i, j, and k indicate the ordinal numbers of the radar bins in the azimuthal, range, and elevation directions, respectively, and Na st and s forthe total number of azimuthal bins.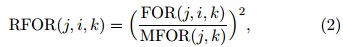
The relative frequency of occurrence of reflectivity(RFOR)accounts for the fact that if some azimuthsare partly blocked and other azimuths are unblocked, FOR will generally be higher in the unblocked areasthan MFOR at the same range from the radar site.By contrast, FOR in partially blocked areas will generally be lower than MFOR at the same range fromthe radar site.
2)Azimuthal variation of frequency of occurrenceof reflectivity(AVFOR)
AVFOR accounts for the fact that the boundaryregions between completely blocked and unblocked regions have evident gradients in FOR along the tangential direction. The tangential gradient in FOR istypically smaller in uniformly unblocked regions.
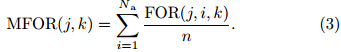
3)Vertical variation of frequency of occurrence ofreflectivity(VVFOR)
where HEIGHT indicates the vertical distance between the radar bin and the ground. The height difference between beams at two elevation angles increaseswith distance from the radar. VVFOR accounts forthe fact that, in unblocked regions, FOR is typicallylarger at lower elevations than at higher elevations. Inpartially blocked areas, the opposite is typically true:FOR is generally less at lower elevations than at higherelevations.3.1.2 Statistical features of blockage identification parameters
The ideal statistical characteristics should be derived from numerous samples that cover actual unblocked and partially blocked areas, including samplesthat encompass a variety of ranges and elevation angles. Partially blocked and unblocked areas at eachelevation are discriminated by artificial determinationthrough analysis of the FOR and reflectivity for alarge-scale precipitation case(Fig. 1). The three discrimination parameters RFOR, AVFOR, and VVFORare calculated from the FOR values for the unblocked and partially blocked areas. Figure 2 shows the distribution frequencies of RFOR, AVFOR, and VVFOR.The partially blocked areas have lower values of RFORbut higher values of AVFOR and VVFOR. Furthermore, the spatial variability tends to be greater in partially blocked sections than in unblocked sections.
 |
| Fig. 2. Probability densities of(a)RFOR, (b)AVFOR, and (c)VVFOR in unblocked(solid) and partially blocked(dashed)regions. |
The distribution frequency density curves of theparameters for discrimination between the unblocked and partially blocked sections intersect; accordingly, unblocked and partially blocked areas cannot be completely discriminated using fixed parameter thresholds. We therefore suggest using a fuzzy logic method(FLM)to distinguish the unblocked areas from thepartially blocked areas. The most relevant characteristic of FLM is that it does not require detailed quantitative values of discrimination parameters; rather, it divides the parameters into various categories and then applies loose classification rules to determine anoptimal result. This approach is characterized by goodextensibility and compatibility. The traditional FLM(Mendel, 1995; Zadeh, 1965)covers four stages: fuzziness, rule judgment, integration, and de-aliasing. Inthis paper, concrete system structures are constructedby taking the three discrimination parameters RFOR, AVFOR, and VVFOR as input parameters. The output parameters then indicate whether a region is partially blocked or unblocked. Triangular membershipfunctions with a basic trigonometric form are used todeal with the fuzziness of the three discrimination parameters. The formula is given by
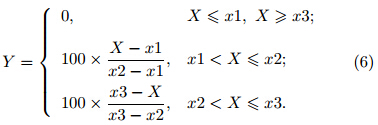
The distribution frequency density of each parameter in Fig. 2 is used to determine the membership function thresholds for unblocked and partiallyblocked areas. Fuzziness is accounted for by usingthe membership function to turn the input parame-ters into a fuzzy base. Figure 3 presents the fuzzybase for unblocked areas that accords with the membership functions for the three discrimination parameters discussed above. Rule deduction is equivalent tothe calculation of the conditional probability functionsfor the unblocked and partially blocked regions:
 |
| Fig. 3. Membership functions for(a)RFOR, (b)AVFOR, and (c)VVFOR. |
 = 1. P isthe conditional probability that an area is unblocked.If P ≥ 0.5, the area is classified as unblocked, while ifP < 0.5, it is classified as partially blocked. This classification is applied to the full three-dimensional distribution of conditional probabilities P(j; i; k)(evaluatedfor each combination of radar range bin j, azimuthaldirection bin i, and elevation bin k)to determine thelowest unblocked elevation angle at each horizontal location, Elemin(j, i). This information can then be usedto construct hybrid scans.3.2 Construction of hybrid scans algorithm
The unblocked conditional distribution P(j; i; k)allows us to evaluate whether the radar beam ispartially blocked or not at elevation k, azimuth i, and range j. Proceeding from low elevations to high elevations, identification of the first P(j; i; k) ≥ thresholdin a radar bin establishes the lowest elevation anglefor which the radar beam is unblocked. By contrast, identification of P(j; i; k) < threshold indicates an elevation angle that is partially blocked; the conditionP(j; i; k + 1)of the next lowest elevation angle mustthen be examined. This procedure is iterated until thelowest unblocked elevation angle Elemin(j, i)is identified for all radar bins(j; i). Hybrid scans can then beconstructed using this information.
Figure 4a shows the hybrid scan elevations theXining determined from reflectivity climatology usingblockage discrimination and radar FOR from continuous volume radar scans at Xining between May and July 2010. This figure shows that the radar in isseverely affected by blockage. The radar coverage ofall but the eastern and northwestern areas requires elevation angles greater than 2.4°. The blockage is mostsevere in the southern azimuthal direction, with radarcoverage blocked at elevation angles below 6.0°.
 |
| Fig. 4.(a)The hybrid scan elevation(m)for the Xining radar and (b)the hybrid scan reflectivity(dBZ)observed bythe Xining radar at 0340 UTC 16 July 2010. |
The hybrid scan reflectivity(HSR)is defined asthe reflectivity factor that corresponds to the hybridscan elevation for each radar bin. Figure 4b shows theHSR derived using volume scan data from the Xining radar at 0340 UTC 16 July 2010. Comparison tothe radar reflectivity evaluated at each elevation angle between the first and sixth tilts(Figs. 1a2-1f2)indicates that the HSR is unaffected by discontinuities while retaining the spatial scope of the originaldata. This improvement indicates that the hybrid scanmethod introduced above can effectively discriminatebetween the partially blocked and unblocked sectionsof the Xining weather radar, that the identified hybridscan elevations are reliable, and that the hybrid scanreflectivity can be used for quantitative precipitationestimation(QPE).4. Evaluation of the hybrid scan method4.1 Comparison and analysis of two methods of hybrid scans
The traditional algorithm for obtaining hybridscans uses st and ard terrain DEM data along with thelatitude, longitude and altitude of radar stations tocalculate the radar beam blockage rate. The rationality of this hybrid scans algorithm is reflected in theresulting HSR, which is continuous and effective overa large spatial range. In this section, the HSR generated by the traditional terrain-based hybrid scan algorithm is compared with that generated by the reflectivity climatology-based algorithm described above. Thiscomparison is performed in the context of a large-scalestratiform precipitation event.
Figure 5 shows the hybrid scan elevations for theterrain-based and reflectivity climatology-based hybrid scans along with the corresponding HSR. Terrainbased hybrid scans for the Xining radar are completelyfree from blockage at the fifth tilt(Fig. 5a1), whereasthe reflectivity climatology-based hybrid scans are notfree from blockage until the sixth tilt(Fig. 5a2).
 |
| Fig. 5. Hybrid scan elevations according to(a1)the terrain-based algorithm and (a2)the re°ectivityclimatology-based algorithm; terrain-based hybrid scan reflectivity observed by the(b1)Xining, (c1)Haibei, (d1)Naqu, and (e1)Linzhi radars; reflectivity climatologybased hybrid scan reflectivity observed by the(b2)Xining, (c2)Haibei, (d2)Naqu, and (e2)Linzhi radars. |
Comparison of the HSR obtained from the Xining radar by hybrid scans based on the two differentalgorithms(Figs. 5b1 and 5b2)indicates that theterrain-based algorithm potentially creates three Vshaped gaps in HSR. For the first gap(solid arrow), the reflectivity climatology-based algorithm indicatesthat the hybrid scan elevation is the third tilt, whilethe terrain-based algorithm determines that the hybrid scan elevation is the second tilt. For the secondgap(dashed arrow), the reflectivity climatology-basedalgorithm indicates that the hybrid scan elevation isthe fourth tilt, while the terrain-based algorithm identifies the third tilt. For the third gap(dashed circle), the reflectivity climatology-based algorithm identifiesthe sixth tilt, while the terrain-based algorithm identifies the fifth tilt. These three V-shaped gaps are created because the terrain-based hybrid scan elevationsin these locations are lower than the actual lowest unblocked elevation angle. These gaps do not appear inthe HSR calculated using the reflectivity climatologybased algorithm.
Gaps in HSR can also be created by the identification of hybrid scan elevations that are higher thanthe lowest unblocked tilt, because radar coverage athigher tilts is not so extensive as radar coverage atlower tilts.
The advantage of the reflectivity climatologymethod is that it can accurately calculate the lowestunblocked elevation for use in hybrid scans. The identification of hybrid scan elevations that are lower orhigher than the actual lowest unblocked elevation bythe terrain-based method can lead to V-shaped gapsin HSR or discontinuous reflectivity. Areas experiencing precipitation may be mistakenly judged to beprecipitation-free. The results are similar in analysesof HSR observed by the radars at Haibei, Naqu, and Linzhi.4.2 Statistic analysis method
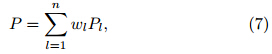
A statistical averaging method is now developedto further evaluate the effectiveness of the different hybrid scan algorithms. This method is based on the factthat the frequency of precipitation echoes at differentunblocked azimuths on the same elevation and at asame range from the radar should not differ greatly.Furthermore, the average reflectivity of different azimuths at the same distance remains roughly constantover su°ciently long periods of time. By contrast, theaverage reflectivity of azimuths that are partially orcompletely blocked at the same elevation and rangeis typically lower than the average reflectivity of unblocked azimuths.
The statistical averaging is performed by accumulating the reflectivity at a given elevation over time, then divided by the number of radar scans included, according to the following formula:
where zl(j; i; k) is the reflectivity observed in the jthradar bin along the ith azimuth on the kth elevationduring the lth of n volume scans, and z(j; i; k) is theaverage reflectivity over those n volume scans. Whenthe value of k is 1, z(j; i; 1) is the average reflectivityon the first elevation. The index k can be replacedby the terrain-based hybrid scan elevation kd(j; i), inwhich case z(j; i; kd(i; j)) is the average of terrainbased HSR. Likewise, k can be replaced by the reflectivity climatology-based hybrid scan elevation kc(j; i), in which case z(j; i; kc(j; i)) is the average of the corresponding reflectivity climatology-based HSR.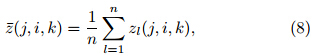
The average reflectivity of the Xining radar at different elevations and the averages of HSR using bothhybrid scan algorithms are calculated from 2034 radarvolume scans taken during the 13 large-scale stratiform precipitation events observed at Xining between2008 and 2010. The results show that the average reflectivity z(80; i; 5)along the fifth tilt at a location 20km from the radar(for which the length of the rangebin is 0.25 km)changes with the variation of the azimuth(Fig. 6a), as does the average reflectivity at thesame range in the sixth tilt(z(80; i; 6); Fig. 6b). Theterrain-based(z(80; i; kd(80; i)); Fig. 6c) and reflectivity climatology-based(z; Fig. 6d)average HSR valuesalso change with the variation of azimuth.
 |
| Fig. 6. The dependence of average reflectivity on azimuth according to(a)the fifth tilt, (b)the sixth tilt, (c)theterrain-based HSR, and (d)the climatology-based HSR at a distance of 20 km from the radar site. |
The frequency of occurrence of reflectivity(FOR;Fig. 1f1) and the reflectivity(Fig. 1f2)at the sixth tiltindicate that the radar beam on this elevation is notblocked; however, the average reflectivity at this elevation changes with the variation of the azimuth(Fig. 6b), with a range of 20 to 30 dBZ. The variations onthe fifth tilt are much larger, consistent with the indication from the FOR and reflectivity at this level thatthe radar beam is partially blocked near 180°. The average reflectivity near the 180° azimuth drops sharplyto less than 10 dBZ(Fig. 6a). This observed reflectivity is substantially weaker than the average reflectivityat the unblocked azimuths on the same tilt, and thedifference in reflectivity with azimuth is much largeron the fifth tilt than on the sixth.
These results can be used to analyze the effectiveness and reliability of the two hybrid scan algorithms.The variation of the terrain-based average HSR withazimuth(Fig. 6c)indicates sharp drops to lower than10 dBZ near the 5°, 45°, and 180° azimuths, suggesting that the radar beams are either completely or partially blocked at these azimuths. This result is consistent with the three V-shaped gaps in the Xiningradar observations of terrain-based HSR(Fig. 5b1).The climatology-based average HSR also varies withazimuth, but within the range of 20 to 30 dBZ(Fig. 6d). This result indicates that the climatology-basedhybrid scan radar beams are unblocked, and is consistent with the continuous spatial coverage providedby the climatology-based HSR observed by the Xiningradar(Fig. 5b2).
Overall, the application of the reflectivity climatology algorithm provides more accurate calculationsof the lowest unblocked elevation and maximizes theutility of radar data within the spatial coverage of theradar. The hybrid scan reflectivity calculated according to the reflectivity climatology algorithm can beused for radar-based quantitative precipitation estimation(QPE), diminishing the impact of terrain blockage and improving the accuracy of QPE.5. Doppler weather radar coverage over the Tibetan Plateau
Given appropriate hybrid scan elevations, thebeam height H can be calculated with the radar beamheight formula under the condition of st and ard atmospheric propagation. The formula is as follows:
where h is the altitude of the radar station, r is theslant range, Re is the equivalent earth radius, and elvis the hybrid elevation angle.
The hybrid scan beam heights from the twoDoppler weather radars(Xining and Haibei)are mosaicked to assess radar coverage over the TibetanPlateau, including Qinghai Province. Observationsfrom the radar with the lower hybrid scan beam heightare adopted in cases of coverage overlap. Figure 7ashows the mosaic hybrid scan beam heights above sealevel over Qinghai. Most of the radar coverage areasare more than 4000 m above sea level. The altitude ofthe Xining radar station(2445 m)is lower than that ofthe Haibei radar station(3123 m); the mosaic hybridscan beam heights are therefore also reported relativeto the altitude of the Xining radar station(Fig. 7b).Figure 7b shows that the areas to the south and northeast of the Xining radar station and to the west ofthe Haibei radar station have particularly high beamheights. The hybrid scan beam heights of many areas exceed 8 km, where precipitation echoes cannotbe detected. The non-uniform distribution of reflectivity vertical profiles is an influential error in radarQPE; thus, the coverage of the Doppler weather radarnetwork in Qinghai is extremely limited. Additionalradar or observation data are needed to fill gaps inthese regions and minimize the impact of topographyto radar QPE.
 |
| Fig. 7. Mosaic hybrid scan beam heights(×103 m)relative to(a)sea level and (b)the altitude of the Xining radarstation over Qinghai. |
Three months of radar reflectivity data fromradars in an area of complex terrain(the TibetanPlateau)from May to July 2010 were used to developa reflectivity climatology. This climatology was thenapplied to the construction of a new hybrid scan algorithm, with the aim of minimizing the impacts ofbeam blockages. The new hybrid scans were thenused to examine the spatial coverage provided by theoperational Doppler weather radar network over theTibetan Plateau. The performance of the reflectivityclimatology-based hybrid scans was evaluated relativeto the performance of traditional terrain-based hybridscans. The conclusions can be summarized as follows.
(1)The use of reflectivity climatology in the development of the new hybrid scan algorithm reducedthe impacts of beam blockages. Hybrid scans requirethe accurate identification of radar coverage. A flexible algorithm based on fuzzy logic concepts was usedto discriminate between areas of partial blockage and areas of no blockage. This new hybrid scan method isbased on a large volume and long period of radar data, and is independent of both the radar mode and thescan mode. Hybrid scan reflectivity during a largescale precipitation event was used to validate the newhybrid scan algorithm. The results show that the reflectivity climatology-based algorithm is both effective and reliable, and can be applied to other radars.
(2)Comparison of the reflectivity climatology-based hybrid scan algorithm with the traditionalterrain-based algorithm suggests that misidentification of the actual lowest unblocked elevation by theterrain-based algorithm can lead to the V-shaped gapsin the hybrid scan reflectivity. In such cases, areaswith active precipitation are mistakenly judged tohave no precipitation. The reflectivity climatologybased algorithm provides a more accurate characterization of the lowest unblocked elevation. Furtherexamination of both sets of hybrid scans using a statistical averaging method yielded the same conclusions as the case study. The time-mean terrain-basedHSR is substantially lower at some azimuths than atother nearby azimuths. These sharp drops in average HSR are caused by beam blockages. By contrast, the time-mean climatology-based HSR varies muchless with azimuth because all azimuths are unblocked.The climatology-based hybrid scan method providesa more accurate measure of reflectivity and enhancesthe utility of radar data within the radar coveragearea.
(3)The coverage of the current weather radarnetwork in Qinghai is extremely limited, as the mosaic hybrid scan heights are high above the ground inmost areas. The non-uniformity of vertical reflectivityprofiles has long been recognized as a major sourceof error in radar QPE. Additional radar or other observational data are needed to fill in the gaps in thisregion, so as to minimize the impact of topography onradar QPE.
Acknowledgments: The authors wish to thankMs. Liu Hua for translation assistance.
| [1] | Bandalo, S., 1992: An Analytic Method for Radar Horizon Computation: International Weather Radar Networking. Kluwer Academic Publishers, 75-79. |
| [2] | Chang, P. L., P. F. Lin, B. J. D. Jou, et al., 2009: An application of reflectivity climatology in constructing radar hybrid scans over complex terrain. J. Atmos. Oceanic Technol., 26(7), 1315-1327. |
| [3] | Fulton, R. A., J. P. Breidenbach, D. J. Seo, et al., 1998: The WSR-88D rainfall algorithm. Wea. Forecasting, 13, 377-395. |
| [4] | Heinselman, P. L., and D. M. Schultz, 2006: Intraseasonal variability of summer storms over central Arizona during 1997 and 1999. Wea. Forecasting, 21, 559-578. |
| [5] | Joss, J., and A. Waldvogel, 1990: Precipitation measurement and hydrology. Radar in Meteorology: Battan Memorial and 40th Anniversary Radar Meteorology Conference, Arizona, Amer. Meteor. Soc., 577-606. |
| [6] | Krajewski, W. F., and B. Vignal, 2001: Evaluation of anomalous propagation echo detection in WSR-88D data: A large sample case study. J. Atmos. Oceanic Technol., 18, 807-814. |
| [7] | Kuo, J. T., and H. D. Orville, 1973: A radar climatology of summertime convective clouds in the Black Hills. J. Appl. Meteor., 12, 359-368. |
| [8] | Liu Liping, Feng Jinming, and Chu Rongzhong, 2002: The diurnal variation of precipitation in monsoon season over the Tibetan Plateau. Adv. Atmos. Sci., 19(2), 365-378. |
| [9] | Maddox, R. A., J. Zhang, J. J. Gourley, et al., 2002: Weather radar coverage over contiguous United States. Wea. Forecasting, 17, 927-934. |
| [10] | Mendel, J. M., 1995: Fuzzy logic systems for engineering: A tutorial. Proc. IEEE, 83, 345-377. |
| [11] | Morin, E., and M. Gabella, 2007: Radar-based quantitative precipitation estimation over Mediterranean and dry climate regimes. J. Geophys. Res., 112, 1-13. |
| [12] | O'Bannon, T., 1997: Using a "terrain-based" hybrid scan to improve WSR-88D precipitation estimates. Preprints, 28th Int. Conf. on Radar Meteorology, Austin, TX, Amer. Meteor. Soc., 506-507. |
| [13] | Pellarin, T., G. Delrieu, G. M. Saulnier, et al., 2002: Hydrologic visibility of weather radar systems operating in mountainous regions case study for the Ardμeche Catchment (France). J. Hydrometeor., 31(5), 539-555. |
| [14] | Sauvageot, H., 1994: Rainfall measurement by radar. Atmos. Res., 35, 27-54. |
| [15] | Steenburgh, W. J., S. F. Halvorson, and D. J. Onton, 2000: Climatology of lake-effect snowstorms of the Great Salt Lake. Mon. Wea. Rev., 128, 709-727. |
| [16] | Xiao Yanjiao, Liu Liping, and Yang Hongping, 2008a: Technique for generating hybrid reflectivity field based on 3-D mosaicked reflectivity of weather radar network. Acta Meteor. Sinica, 66(3), 470-473. (in Chinese) |
| [17] | --, --, and Shi Yan, 2008b: Study of methods for three-dimensional multiple-radar reflectivity mosaics. Acta Meteor. Sinica, 22(3), 351-361. |
| [18] | Xu Xiangde and Chen Lianshou, 2006: Advances of the study on Tibetan Plateau experiment of atmospheric sciences. J. Appl. Meteor. Sci., 17(6), 756-772. (in Chinese) |
| [19] | Yang Hongping, Zhang Peiyuan, and Cheng Minghu, 2009: The valid mosaic data region of the CINRAD network. J. Appl. Meteor. Sci., 20(1), 47-55. (in Chinese) |
| [20] | Zadeh, L. A., 1965: Fuzzy set. Inf. Control, 8(3), 338-353. |