 2012, Vol. 26
Article Information
- Wu Lu and Zhai Panmao. 2012.
- Validation of Daily Precipitation from Two High-Resolution Satellite Precipitation Datasets over the Tibetan Plateau and the Regions to Its East
- J. Meteor. Res., 26(6): 735-745
-
Article History
- Received March 5, 2012
- in final form October 12, 2012


2 Henan Climate Center, Zhengzhou 450003;
3 Chinese Meteorological Society, Beijing 100081
The availability of long time series of meteorological data with accuracy, integrity, and at leastdaily-scale resolution is extremely important for studies of climate change and extreme events(Jones et al., 1999; Folland et al., 2000). Precipitation is animportant part of the global water and energy cycle and a major aspect of climate change. The WorldClimate Research Programme(WCRP)is implementing the Global Energy and Water Cycle Experiment(GEWEX)to improve the underst and ing of long-termchanges in the hydrological cycle and the determination of precipitation-relevant parameters in weather and climate models. Reliable precipitation datasetsare therefore necessary to provide st and ards againstwhich models and parameterization schemes can bevalidated.
Concerns about climate change and extremeevents have motivated a number of studies on improving the accuracy and homogeneity of rain gaugedata in China(Ren et al., 2003, 2010; Li et al., 2005; Jiang et al., 2008). Rain gauge observationsare normally regarded as the most reliable precipitation data, particularly when compared with satelliteprecipitation products. However, the spatial distribution of stations entails certain limitations, especiallyin marine areas and regions of complex terrain. Highresolution satellite precipitation data provide substantial improvements in spatial distribution relative tostation data. Satellite products and in-situ observations are derived according to different principles and are biased against each other(Dai et al., 2007; Zhou et al., 2008; Xie et al., 2007). Satellite products musttherefore be validated against rain gauge data to better underst and their capability for accurately reflecting the characteristics of precipitation. Previous assessments of daily satellite precipitation products(e.g., Dinku et al., 2008; Tian et al., 2007)have revealed thatthe CMORPH(Climate Prediction Center MorphingTechnique) and TRMM(Tropical Rainfall MeasuringMission)3B42 products provide better estimates ofprecipitation than any other satellite products, especially in regions of complex terrain.
The Tibetan Plateau comprises the highest and most complex terrain in the world. It extends into themiddle troposphere with a mean altitude of more than4000 m above sea level, and its terrain is closely relatedto both the arid climate of northwestern China and the formation of the Asian monsoon. L and -air physical processes over the Tibetan Plateau have extremelyimportant impacts on global climate, the atmosphericcirculation in East Asia, and the occurrence of severeweather and climate events in China(Xu et al., 2001).
The Tibetan Plateau and Sichuan basin are geographically adjacent but entirely different in topography and elevation. The in-situ observations aresparse and their distribution is uneven over the Tibetan Plateau, with effectively no observations overthe northwestern Tibetan Plateau. This lack of in-situobservations makes it di°cult to study precipitationin that region. By contrast, dense in-situ observationsexist over the relatively flat region in eastern China.A sudden occurrence of extreme heavy precipitationin Zhouqu, Gansu Province on 7 August 2010 resultedin a major l and slide, which caused huge casualties and substantial economic loss. Since Zhouqu is located onthe northeastern side of the Tibetan Plateau, we include it in our study.
This study provides a focused analysis of satellitederived precipitation products in the regions of theTibetan Plateau, the northeastern Tibetan Plateau, the Sichuan basin, and the mid-lower reaches of theYangtze River. These regions vary substantially withrespect to the altitude and intensity of in-situ observations, and together represent four types of geographical regions, i.e., a plateau region, a plateau-plain transitional region, a basin region, and a plain region.The widely-used CMORPH and TRMM 3B42 satellite daily precipitation products will be quantitativelyvalidated relative to rain gauge observations of precipitation in each geographical region in this study.The results are expected to reveal the capability ofthese satellite products to detect daily precipitationfrequencies and amounts, especially in regions of complex terrain, and to assist in the design of the in-situobservation network for TIPEX III(the third TibetanPlateau Experiment). This study lays a foundationfor underst and ing and improving the performance ofthe satellite products, thus enhancing the utility ofsatellite precipitation data in research and operationalapplications.2. Data and method2.1 Data
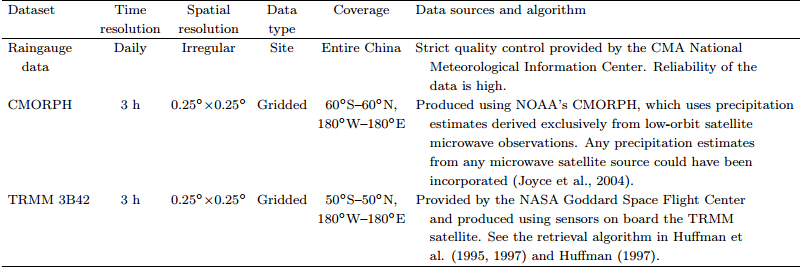
We use rain gauge data, CMORPH, and TRMM3B42 products for the precipitation analysis in thisstudy. Details of the data are given in Table 1.CMORPH precipitation data are available from December 2002 to present while TRMM 3B42 precipitation data are available from December 1997 to present.To ensure consistency in the length of each data timeseries, we restrict the data comparison to the period2003-2008. Statistical results indicate that warm season(May-September)precipitation accounts for morethan 60% of the annual precipitation in the full studydomain, with a maximum of 90% over the TibetanPlateau. We focus on the ability of the two satelliteprecipitation products in accurately detecting dailyprecipitation in regions of complex terrain.
 |
| Fig. 1. Topography(shadings)of the study domain and distribution of surface in-situ observation stations. The terraindata are from the GTOPO30 Global Digital Elevation Model, and are provided by the US Geological Survey's EMROSData Center. The purple grid indicates resolution of the satellite products. Red boxes indicate grid cells that containin-situ observation stations. The analysis domain is divided into four sub-regions as indicated by the black solid boxes:(a)the Tibetan Plateau(27°-40°N, 80°-102°E; H ≥ 3000 m);(b)the northeastern Tibetan Plateau(35°-40°N, 102°-110°E; 1000 m 6 H ≤ 3000 m), (c)the Sichuan basin(28°-32°N, 103°-108°E; H < 1000 m), and (d)the mid-lowerreaches of the Yangtze River valley(28°-33°N, 111°-122°E). |
To reach a comprehensive underst and ing of thecapabilities of the two satellite precipitation productsover the Tibetan Plateau and the regions to its east, we analyze satellite data performance over four geographically distinct sub-regions, i.e., the TibetanPlateau, northeastern Tibetan Plateau, Sichuan basin, and mid-lower reaches of the Yangtze River. Our analysis proceeds with four steps. First, we perform apoint-by-point comparison of precipitation amountsbetween the satellite data and the rain gauge data.Second, we examine how well satellite estimates ofdaily precipitation amount and frequency reflect theamount and frequency of precipitation as observed byrain gauges. Third, we use a percentile method to rankdaily precipitation amounts and study the ability ofsatellite precipitation products to accurately captureprecipitation events of various intensities. Finally, wecheck whether the satellite precipitation datasets accurately reflect the gamma distribution of precipitationin the various sub-regions of the analysis domain.
The satellite precipitation products are gridded, while the rain gauge data are irregularly distributed.It is therefore not possible to compare these two typesof precipitation data directly. Taking into account thecomplex terrain of the Tibetan Plateau and the sparsedistribution of in-situ observations in this region, interpolating rain gauge data into a grid will introduce falseinformation and biases into the rain gauge data. Wewill therefore limit our comparison to only those gridboxes with both satellite and in-situ observations. Weaverage all valid observations inside any 0.25°×0.25°grid box that contains at least one observational station. This so-called "Frozen Grid" technique(Jones et al., 1986a, b; Zhai and Ren, 1997)allows us to validatesatellite precipitation data while limiting possible errors due to evenly spatial sampling. Grid boxes without valid in-situ observations are marked as missingdata points and are not compared with satellite data.This comparison method also ensures consistency between the rain gauge and satellite precipitation grids, and gives a more accurate reflection of the capabilityof these two types of satellite products to detect precipitation. We apply a threshold of 0.1 mm day-1, exactly equivalent to that for the rain gauge observation, in satellite precipitation detection. This threshold ensures that the occurrence of daily precipitationis deβned consistently for all the three datasets.
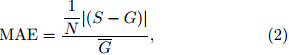
We apply and improve the statistics developedby Wilks(2006)for use in validating satellite observations of daily precipitation amount and frequency.These statistics include linear correlation coefficient(CC), mean error(ME), mean absolute error(MAE), and bias(BIAS)of satellite-derived daily precipitationamounts relative to rain gauge observations. The biascalculation is revised from that used by Wilks(2006)to more clearly reflect relative deviations. We evaluate satellite observations of precipitation frequencyusing probability of correct detection of precipitationoccurrence(POD), false alarm ratio of detection ofprecipitation occurrence(FAR), probability of correctdetection of no precipitation occurrence(PODN), and false alarm ratio of detection of no precipitation occurrence(FARN). PODN and FARN are included to assess the ability of satellite products to correctly detectoccurrences without precipitation. The expressions forthese statistics are as follows.
In Eqs.(1)-(3), S is the satellite estimate of daily precipitation amount, G is the rain gauge observation ofdaily precipitation amount, G is the time-average dailyprecipitation amount according to rain gauge data, and N is the number of samples. In Eqs.(4)-(7), A + C is the total number of days on which precipitation exceeds the minimum threshold according tothe rain gauge data, A+B is the total number of dayson which precipitation exceeds the minimum thresholdaccording to the satellite precipitation data, B + D isthe total number of days on which precipitation fails toexceed the minimum threshold according to the raingauge data, and C + D is the total number of dayson which precipitation fails to exceed the minimumthreshold according to the satellite precipitation data.See Table 2 for more details on the variables used inEqs.(4)-(7). Note that the uint of ME is mm day-1 and the other statistics are all dimensionless.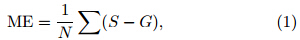


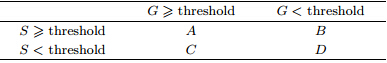 |
Figure 2 provides a comparison of average dailyprecipitation amounts over the four sub-regions duringthe warm season as observed by the satellites and therain gauges. The comparison is restricted to grid cellswith valid in-situ observations. TRMM 3B42 average daily precipitation amounts are closer to those observed by rain gauge stations than CMORPH averagedaily precipitation amounts. The TRMM 3B42 datasystematically underestimate daily mean precipitationover the Tibetan Plateau but perform well in the otherthree regions. The CMORPH data are largely consistent with the rain gauge data over the northeastern Tibetan Plateau, but differ from the rain gaugedata over the other three regions. CMORPH underestimates average daily precipitation amounts in regionswith precipitation lower than 3 mm day-1 but overestimates precipitation in regions with precipitationhigher than 3 mm day-1 over the Tibetan Plateau.Tian et al.(2007)reported similar differences betweenthe CMORPH and TRMM 3B42 satellite precipitationproducts over the southeastern United States. This islikely due to the application of a GPCC(Global Precipitation Climatological Center)based monthly amplitude adjustment algorithm in the TRMM 3B42, which helps reduce the biases in long-term aggregations in this dataset(Huffman et al., 2007).
 |
| Fig. 2. Scatter plots of 5-yr(2003-2008)average warm season daily precipitation amounts(mm day-1)from CMORPH and rain gauge data(a1, b1, c1, d1) and TRMM 3B42 and rain gauge data(a2, b2, c2, d2)in valid grids over(a1, a2)the Tibetan Plateau, (b1, b2)the northeastern Tibetan Plateau, (c1, c2)the Sichuan basin, and (d1, d2)the mid-lowerreaches of the Yangtze River. |
We use the validation statistics as described inSection 2.2 to test the ability of the two satellite precipitation products to reliably detect daily precipitation amounts and frequencies. The results(Fig. 3)show that the reliability of satellite-based daily precipitation amounts is related to the topography. TRMM3B42 consistently performs better than CMORPH.Both satellite datasets are more reliable over the relatively flat mid-lower reaches of the Yangtze River thanover the Tibetan Plateau. The correlation coefficientbetween satellite and rain gauge estimates of daily precipitation amount are approximately 0.70, 0.57, 0.51, and 0.40 over the mid-lower reaches of the YangtzeRiver, Sichuan basin, northeastern Tibetan Plateau, and Tibetan Plateau, respectively. The mean errors ofthe two satellite products are small relative to me and aily precipitation amounts over the four sub-regions(the mean daily precipitation amount is 3.1, 2.3, 5.8, and 5.5 mm over the Tibetan Plateau, northeastern Tibetan Plateau, Sichuan basin, and mid-lowerreaches of the Yangtze River, respectively). RelativeMAE values are about 1.0 in all four sub-regions. Bothsatellite precipitation products underestimate me and aily precipitation amounts over the Tibetan Plateau(biases of approximately -0.4 mm)but are similarto rain gauge observations over the other three regions(where the absolute values of the biases are typically less than 0.15). Dinku et al.(2010)analyzedseven types of satellite precipitation products, including CMORPH and TRMM 3B42, and reported thatsatellite estimates of rainfall amount are often poor inregions of complex terrain. This is consistent with ourβndings for CMORPH and TRMM 3B42 over the Tibetan Plateau.
 |
| Fig. 3. Validation statistics for daily precipitation amount and frequency as observed by the two satellite precipitationproducts relative to rain gauge data for(a)the Tibetan Plateau, (b)the northeastern Tibetan Plateau, (c)the Sichuanbasin, and (d)the mid-lower reaches of the Yangtze River. |
We next validate the ability of the two satelliteproducts to accurately reflect the frequency of dailyprecipitation occurrence. We focus on the frequencies of days with and without detectable precipitation. The POD is approximately 0.72 for TRMM3B42 and 0.85 for CMORPH. These results reveal thatboth satellite products perform well in detecting precipitation events, with CMORPH performing betterthan TRMM 3B42. However, the CMORPH FAR isapproximately 0.37, and is higher than the TRMM3B42 FAR in all sub-regions. The FARs of both satellite precipitation products are the highest over thenortheastern Tibetan Plateau, with an FAR of 0.4for TRMM 3B42 and 0.52 for CMORPH. However, the PODN is the lowest over the Tibetan Plateau, with values of 0.61 for TRMM 3B42 and 0.45 forCMORPH. The values of PODN over the other threeregions are approximately 0.78 for TRMM 3B42 and 0.6 for CMORPH. In this respect, TRMM 3B42 performs better than CMORPH. The FARN is approximately 0.3 over the Tibetan Plateau regardless of thesatellite dataset used. This value is higher than thosecalculated for the other three sub-regions, where values of FARN are approximately 0.15. These resultsshow that the two satellite precipitation products aregenerally able to differentiate days with precipitationfrom days without precipitation. The performance ofthe satellite precipitation products is worse over theTibetan Plateau than over the other sub-regions.
The ability of the satellite products to correctlydetect daily precipitation amounts appears to be dependent on topography. TRMM 3B42 underestimateswarm season mean daily precipitation amounts overthe Tibetan Plateau but provides estimates that areclose to the rain gauge amount over the other threesub-regions. CMORPH performs well over the northeastern Tibetan Plateau but is less consistent with therain gauge data over the other three sub-regions. Bothsatellite products perform more poorly in regions ofcomplex terrain, especially in terms of precipitationamounts over the Tibetan Plateau. The two satellite products perform well in detecting whether precipitation has occurred on a given day, particularly inthe relatively flat regions of the northeastern TibetanPlateau, Sichuan basin, and mid-lower reaches of theYangtze River.4. Distribution of precipitation by intensity
Precipitation intensity can be classiβed into ranksaccording to either the βxed quantity of precipitationthat accumulates over 24 h(e.g., Shou et al., 2002)or the percentiles of precipitation intensity(e.g., Karl and Knight, 1998; Zhai et al., 2005; Zhang and Zhai, 2011). Relative intensity ranks by percentiles of dailyprecipitation are more appropriate in this case because daily precipitation amounts vary substantiallywithin our study domain. We sort daily precipitationdata into four intensity ranks(weak, moderate, heavy, and intense)for each sub-region. The boundaries ofthese intensity ranks are set at the 25th, 50th, and 75th percentiles of precipitation intensity based on insitu rain gauge observations. For the Tibetan Plateau, weak precipitation includes rain rates of 0.1-0.8 mmday-1, moderate precipitation includes rain rates of0.8-2.7 mm day-1, heavy precipitation includes rainrates of 2.7-6.7 mm day-1, and intense precipitationincludes all rain rates that exceed 6.7 mm day-1. Forthe northeastern Tibetan Plateau, the respective ranksare 0.1-0.7, 0.7-2.8, 2.8-8.1, and > 8.1 mm day-1; forthe Sichuan basin, the respective ranks are 0.1-0.9, 0.9-4.2, 4.2-13.8, and > 13.8 mm day-1; and for themid-lower reaches of the Yangtze River, the respectiveranks are 0.1-0.9, 0.9-4.6, 4.6-15.7, and > 15.7 mmday-1, respectively. Figure 4 shows the distributionsof precipitation amount and frequency over these fourintensity ranks based on both satellite and rain gaugedata in each sub-region. This comparison allows usto validate the ability of the satellite products to accurately capture the occurrence of daily precipitationevents in different intensity categories.
 |
| Fig. 4. Distributions of precipitation amount(solid lines) and frequency(dashed lines)by intensity over(a)the TibetanPlateau, (b)the northeastern Tibetan Plateau, (c)the Sichuan basin, and (d)the mid-lower reaches of the Yangtze River.Distributions are shown for rain gauge(red), TRMM 3B42(dark blue), and CMORPH(light blue)data. |
The intensity distributions of precipitationamount based on TRMM 3B42 are similar to thosebased on the rain gauge data, while those based onCMORPH differ more substantially. For example, CMORPH overestimates the amount of precipitationassociated with intense precipitation events over themid-lower reaches of the Yangtze River by 9.6%, butunderestimates the amount of precipitation associatedwith heavy precipitation events by 8.8%. In theother three sub-regions, CMORPH underestimates theamount of precipitation associated with intense precipitation events(by 9.1% over the Tibetan Plateau, 13.5% over the northeastern Tibetan Plateau, and 13.0% over the Sichuan basin), while overestimatingthe amount of precipitation associated with weak, moderate, and heavy precipitation events.
Figure 4 also shows the relative frequencies ofdaily precipitation events with different intensity ranksfor each of the four representative sub-regions. Thefrequency distributions based on TRMM 3B42 aregenerally consistent with those based on rain gaugedata, although TRMM 3B42 underestimates the frequency of weak precipitation events over the Sichuanbasin(by 8.4%) and the mid-lower reaches of theYangtze River(by 9.4%). CMORPH overestimatesthe frequencies of weak and intense precipitation overthe mid-lower reaches of the Yangtze River by 5.5% and 8.7%, respectively, while underestimating the frequencies of moderate and heavy precipitation by 6.4% and 7.8%. Over the other three regions, CMORPHoverestimates the frequency of weak precipitation by5.0%-8.5% and underestimates the frequency of intense precipitation by 8.7%-9.4%.
TRMM 3B42 provides better agreement with raingauge observations than CMORPH, with respect toboth warm season average precipitation amount and daily precipitation amount. TRMM 3B42 also provides a good estimate of the amount of precipitationthat occurs during events of different intensity ranks;however, it underestimates the frequency of weak precipitation events in the Sichuan basin and the midlower reaches of the Yangtze River. CMORPH substantially overestimates the amount of precipitationassociated with intense precipitation events and underestimates the amount of precipitation associatedwith other events in the mid-lower reaches of theYangtze River. By contrast, CMORPH underestimates the amount of precipitation associated with intense events and overestimates the amount of precipitation associated with other events over the otherthree regions. CMORPH overestimates the frequencies of intense and weak precipitation events and underestimates the frequencies of other events in themid-lower reaches of the Yangtze River. In the othersub-regions, CMORPH overestimates the frequency ofweak precipitation events and underestimates the frequency of intense precipitation events.5. The gamma distribution
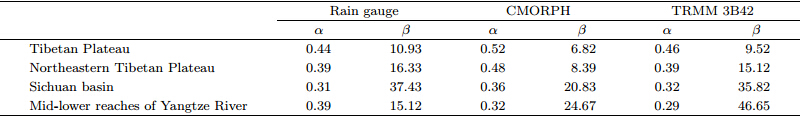
The distribution of daily precipitation is typically right-skewed and asymmetric. In particular, thegamma distribution can often well describe the distribution of daily precipitation(Groisman et al., 1999).Figure 5 shows probability density functions(PDFs) and cumulative distribution functions(CDFs)of dailyprecipitation amount over the four sub-regions as observed by the rain gauge data and the two satelliteprecipitation products. The shapes of the PDFs basedon the two satellite precipitation datasets are generally consistent with the shape of the PDF based onthe rain gauge data. The CDFs based on TRMM3B42 also match those based on the rain gauge data, though those based on CMORPH differ some-what.The shape(α) and scale(β)parameters of the derived gamma distributions are also much closer tothose based on rain gauge data when the distribution is based on TRMM 3B42 rather than CMORPH(Table 3). These results support the conclusions obtained in Sections 3 and 4: TRMM 3B42 agrees betterwith rain gauge observations than CMORPH over theTibetan Plateau and the regions to its east in China.
 |
| Fig. 5. Characteristic probability density functions(PDFs) and cumulative distribution functions(CDFs)over(a1, a2)the Tibetan Plateau, (b1, b2)the northeastern Tibetan Plateau, (c1, c2)the Sichuan basin, and (d1, d2)the mid-lowerreaches of the Yangtze River according to daily precipitation amount from rain gauge observation(black), CMORPHdata(red), and TRMM 3B42 data(blue). |
 |
The CMORPH and TRMM 3B42 precipitationproducts are validated for four regions of China withdifferent geographical characteristics: the TibetanPlateau, northeastern Tibetan Plateau, Sichuan basin, and mid-lower reaches of the Yangtze River. The validation is performed against daily rain gauge observations of warm season(May-September)precipitationbetween 2003 and 2008. The conclusions are as follows.
1)The reliability of the daily precipitationamount provided by the two satellite products dependson the underlying topography. The TRMM 3B42product underestimates daily precipitation amountsover the Tibetan Plateau but is very similar to therain gauge data in the other three sub-regions. TheCMORPH product performs better than the TRMM3B42 product over the northeastern Tibetan Plateau, but worse over the other three sub-regions. Both satellite precipitation products perform more poorly overthe regions of more complex terrain, particularly theTibetan Plateau.
2)Both satellite precipitation products are able toaccurately differentiate between days with precipitation and days without detectable precipitation. Theirperformance is better over relatively flat regions thanover the complex terrain of the Tibetan Plateau.
3)TRMM 3B42 is able to capture the subregional distributions of precipitation amount by precipitation intensity, although it underestimates the frequency of weak precipitation events over the Sichuanbasin and the mid-lower reaches of the Yangtze River.
4)The CMORPH product overestimates theamount of precipitation associated with intense precipitation events over the mid-lower reaches of theYangtze River while underestimating the amount ofprecipitation associated with other events. In theother three regions, the CMORPH product underestimates the amount of precipitation associated withintense precipitation events while overestimating theamount of precipitation associated with other events.CMORPH overestimates the frequency of weak and heavy precipitation events over the mid-lower reachesof the Yangtze River while underestimating the frequency of other events. In the other three regions, CMORPH overestimates the frequency of weak precipitation events but underestimates the frequency ofheavy precipitation events.
5)The gamma distribution of daily precipitationamount based on TRMM 3B42 data is very similarto that based on rain gauge observations. The cumulative distribution function(CDF)of the CMORPHgamma distribution is biased toward lighter precipitation events.
Both the TRMM 3B42 and CMORPH precipitation products have inherent weaknesses. Both satelliteproducts are less capable of detecting daily precipitation amount than daily precipitation frequency, especially in regions of complex terrain. This weaknessmay be due to the fact that these satellite precipitation estimates are based mainly on passive microwave(PMW)retrievals, which provide good estimates ofstrong convective precipitation but are less reliable forshallow convection or warm precipitation processes.Luo et al.(2011)reported that convective activity isweak over the Tibetan Plateau. The discrepancy between satellite and rain gauge observations may alsobe related to the sparse and irregular spatial distribution of in-situ observations on the Tibetan Plateau.Improvements of the in-situ precipitation observationnetwork would strongly support further improvementsin satellite precipitation retrieval methods.
Acknowledgments: We thank the two anonymous reviewers for their helpful comments and suggestions.
| [1] | Dai, A., X. Lin, and K. Hsu, 2007: The frequency, intensity, and diurnal cycle of rainfall in surface and satellite observations over low and mid latitudes. Climate Dyn., 29, 727-744. |
| [2] | Dinku, T., S. Chidzambwa, P. Ceccato, et al., 2008. Validation of high-resolution satellite rainfall products over complex terrain. Int. J. Remote Sens., 29(14), 4097-4110. |
| [3] | --, F. Ruiz, S. J. Connor, et al., 2010: Validation and intercomparison of satellite rainfall estimate over Colombia. J. Appl. Meteor. Climatol., 49(5), 1004-1014. |
| [3] | Folland, C., P. Frich, T. Basnett, et al., 2000: Uncertainties in climate datasets-A challenge for WMO. WMO Bulletin, 49(1), 59-68. |
| [4] | Groisman, P. Y., T. R. Karl, D. R. Easterling, et al., 1999: Changes in the probability of heavy precipitation: Important indicators of climatic change. Climatic Change, 42, 243-283. |
| [5] | Huffman, G. J., 1997: Estimates of root-mean-square random error for finite samples of estimated precipitation. J. Appl. Meteor., 36, 1191-1201. |
| [6] | --, R. F. Adler, B. Rudolf, et al., 1995: Global precipitation estimates based on a technique for combining satellite-based estimates, rain gauge analysis, and NWP model precipitation information. J. Climate, 8, 1284-1295. |
| [7] | --, --, P. Arkin, et al., 1997: The Global Precipitation Climatology Project (GPCP) combined precipitation dataset. Bull. Amer. Meteor. Soc., 78, 5-20. |
| [8] | --, D. T. Nolvin, E. J. Nelkin, et al., 2007: The TRMM multisatellite precipitation analysis (TMPA): Quasiglobal, multiyear, combined-sensor precipitation estimates at fine scales. J. Hydrometeor., 8, 38-55. |
| [9] | Jiang Zhihong, Huang Qun, and Li Qingxiang, 2008: Study of precipitation series homogeneous adjustment and their correction over China in the last 50 years. Climatic Environ. Res., 13(1), 67-74. (in Chinese) |
| [10] | Jones, P. D., S. C. B. Raper, R. S. Bradley, et al., 1986a: Northern Hemisphere surface air temperature variations: 1851-1984. J. Climate Appl. Meteor., 25, 161-179. |
| [11] | --, --, and T. M. L. Wigley, 1986b: Southern Hemisphere surface air temperature variations: 1851-1984. J. Climate Appl. Meteor., 25, 1213-1230. |
| [12] | --, E. B. Horton, C. K. Folland, et al., 1999: The use of indentify changes in climatic extremes. Climatic Change, 42, 131-149. |
| [13] | Joyce, R. J., J. E. Janowiak, P. A. Arkin, et al., 2004: CMORPH: A method that produces global precipitation estimates from passive microwave and infrared data at high spatial and temporal resolution. J. Hydrometeor., 5, 487-503. |
| [14] | Karl, T. R., and R. W. Knight, 1998: Secular trends of precipitation amount, frequency, intensity in the United States. Bull. Amer. Meteor. Soc., 79(2), 231-241. |
| [15] | Li Qingxiang, Matthew J. Menne, Claude N. Williams Jr., et al., 2005: Detection of discontinuities in Chinese temperature series using a multiple test approach. Climatic Environ. Res., 10(4), 736-742. (in Chinese) |
| [16] | Luo, Y. L., R. H. Zhang, W. M. Qian, et al., 2011: Intercomparison of deep convection over the Tibetan Plateau-Asian monsoon region and subtropical North America in boreal summer using CloudSat/CALIPSO data. J. Climate, 24, 2164-2177. |
| [17] | Ren Zhihua, Wang Gaili, Zou Fengling, et al., 2003: The research of precipitation measurement errors in China. Acta Meteor. Sinica, 61(5), 621-627. (in Chinese) |
| [18] | --, Zhao Ping, Zhang Qiang, et al., 2010: Quality control procedures for hourly precipitation data from automatic weather stations in China. Meteor. Mon., 36(7), 123-132. (in Chinese) |
| [19] | Shou Shaowen, Li Shenshen, Wang Shaohua, et al., 2002: Synoptic Analysis. China Meteorological Press, 333 pp. (in Chinese) |
| [20] | Tian, Y., C. D. Peters-Lidard, B. J. Choudhury, et al., 2007: Multitemporal analysis of TRMM-based satellite products for land data assimilation applications. J. Hydrometeor., 8, 1165-1183. |
| [21] | Wilks, D. S., 2006: Statistical Methods in the Atmospheric Science. Academic Press, 627 pp. |
| [22] | Xie, P., A. Yatagai, M. Chen, et al., 2007: A gauge-based analysis of daily precipitation over East Asia. J. ydrometeor., 8, 607-626. |
| [23] | Xu Xiangde, Zhou Mingyu, Chen Jiayi, et al., 2001: A comprehensive physical pattern of land-air dynamic and thermal structure on the Qinghai-Xizang Plateau. Sci. China (Ser. D), 45(7), 577-594. |
| [24] | Zhai Panmao and Ren Fumin, 1997: On changes of China's maximum and minimum temperatures in the recent 40 years. Acta Meteor. Sinica, 55(4), 418-429. (in Chinese) |
| [25] | --, X. B. Zhang, H. Wan, et al., 2005. Trends in total precipitation and frequency of daily precipitation extremes over China. J. Climate, 18, 1096-1107. |
| [26] | Zhang Huan and Zhai Panmao, 2011: Temporal and spatial characteristics of extreme hourly precipitation over eastern China in the warm season. Adv. Atmos. Sci., 28(5), 1177-1183. |
| [26] | Zhou, T. J., R. C. Yu, H. M. Chen, et al., 2008: Summer precipitation frequency, intensity, and diurnal cycle over China: A comparison of satellite data with rain gauge observations. J. Climate, 21, 3997-4010. |