 2012, Vol. 26
Article Information
- Wang Qin, Li Shuanglin, Fu Jianjian, and LI Guoping. 2012.
- Formation of the Anomalous Summer Precipitation in East China in 2010 and 1998: A Comparison of the Impacts of Two Kinds of El Niño
- J. Meteor. Res., 26(6): 665-682
-
Article History
- Received June 13, 2012
- in final form July 7, 2012


2 Nansen-Zhu International Research Centre, Institute of Atmospheric Physics, Chinese Academy of Sciences, Beijing 100029;
3 Civil Aviation Flight University of China, Guanghan 618307
The summer flood of 2010 in the Yangtze Rivervalley(YRV)was the severest one since 1998, and itcaused great economic losses and casualty. According to one disaster report released by the State FloodControl and Drought Relief Headquarters(SFDH), thefloods in the upper YRV reached the warning levelthree times, and were record-breaking in several subvalleys like the Han-Jiang River valley and the PoyangLake basin. It cost an economic loss of nearly 125 billion RMB(~20 billion US dollars), affected 100.4 million people with 2027 deaths(SFDH, 2011). Despitea similarity to the 1998 case, difference in rainfall inthe YRV in 2010 is distinct(Fig. 1).
 |
| Fig. 1. Summer(July-August)rainfall anomalies over China in(a)2010 and (b)1998.(c, d)as(a, b)but for therainfall anomaly percentage, and (e)seasonal evolution of rainfall anomalies in the middle and lower reaches of theYangtze River. Contour interv als are 30 mm mon-1in(a, b) and 30% in(c, d). Shading indicates the area with rainfallanomaly percentage greater than 100%. |
By examining the lower boundary condition, particularly the sea surface temperatures(SSTs), wefound that the two summer floods both followed anEl Niño event, which peaked in the previous winter and waned in the spring and summer of the same year.However, one substantial difference is that the 1997/98event was a typical El Niño event with the maximumwarm SST anomaly(SSTA)occurring in the tropicaleastern Pacific(Li et al., 2001), whereas the 2009/10event was an El Niño Modoki with the maximum warmSSTA showing up in the tropical central Pacific as described in Ashok et al.(2007). Comparing these twocases helps us underst and the flood formation mechanisms and the perhaps different impacts of the twotypes of El Niño events, and provide clues to improving short-term climate prediction.
As the strongest signal of interannual climatevariability, El Niño/Southern Oscillation(ENSO)exerts significant impacts on regional climate anomalies.It was found that the impacts of ENSO on the EastAsian summer monsoon(EASM)depend on its phases(Huang and Wu, 1989; Zhang et al., 1996). In thesummer of El Niño's decaying year, the Indian summer monsoon weakens while the EASM strengthens.This causes less rainfall in the Huaihe River valleybut more rainfall in the YRV and northeastern China.Correspondently, there is often severe flooding occurring in the YRV(Fu and Teng, 1988; Liu and Ni, 1998;Zhang et al., 1999; Chen, 2002; Huang et al., 2004).In the recent years, this El Niño-EASM relationshiphas become unstable(e.g., Wang, 2002; Zong et al., 2010). The effect of El Niño on the EASM variesdepending not only on the location of the maximumwarm SSTA featuring the event(Zhang and Huang, 2008; Feng et al., 2010), but also its intensity(Xue and Liu, 2007). Fu et al.(1986)noted that the maximumwarm SSTA featuring an El Niño event is not alwaysin the eastern Pacific, but sometimes in the centralPacific. The latter occurred more frequently in recent decades, and has received increasing attentions(Yeh et al., 2009; Lee and McPhaden, 2010). Ashoket al.(2007)termed this El Niño with the maximumwarm SSTA in the tropical central Pacific as "El NiñoModoki"(Modoki hereafter)to distinguish it from atypical one. Several recent studies have shown thatModoki is different from a typical El Niño with respect to its evolution and climate impact(Zhang and Chang, 2007; Kao and Yu, 2009; Kug et al., 2009;Weng, 2007; Feng et al., 2010). Following a Modokilike the 2002/03 one, intensified summer rainfall appeared in the Huaihe-Yellow River along with a northward shift of the climatological rainb and and less rainfall in the southern YRV. This is in contrast with atypical El Niño like the 1997/98, following which intensified summer rainfall emerged in the YRV.
Several studies have explored the causes of the1998 flooding, and most of them pointed to the El Niñoevent in the preceding winter(1997/98 winter)(Li et al., 2001; Arthur et al., 2003; Chen, 2001; Ding and Hu, 2003). For example, Huang et al.(1998)showedthat the flood was directly caused by the anomalousEASM linked to the decaying phase of El Niño. Tao etal.(1998)illustrated that the climate background ofdecayed El Niño was in favor of an anomalous southwestward shift of the western Pacific subtropical high(WPSH), which caused the occurrence of the secondperiod of Meiyu and increased rainfall in the YRV.Consistent with Tao et al.(1998), Shen et al.(2001)suggested that the SSTA in the Pacific and IndianOceans can explain the anomalous activities of theWPSH. Furthermore, Guo et al.(2002) and Sun and Ma(2003)confirmed the influence of the 1997/1998 ElNiño through atmospheric general circulation model(AGCM)experiments. As for the 2010 YRV flooding, no study to date has investigated the impacts of theModoki, although Ratnam et al.(2011)found its significant effect on summer climate in North America and Europe.
In this paper, we compare the characteristics ofrainfall anomalies and the associated atmospheric circulations between the two flooding years, analyze theEl Niño-related SSTA evolution from the precedingwinters, and investigate the influences of low-middle-latitudional SSTA(including those in the tropicalcentral-East Pacific, the western Pacific, and the Indian Ocean)by performing AGCM experiments. Finally, we discuss the impacts of the two types of ElNiño events through observational composites and acomparison of two cases.2. Data and methods2.1 Data
The primary datasets used in this paper include:(1)monthly precipitation at 160 stations within mainl and China, and the intensity, ridge line, area, and westernmost ridge line point index of the WPSH chosen from 74 circulation indices. Both the station precipitation and the WPSH index were provided by theNational Climate Center of the China Meteorological Administration;(2)monthly atmospheric circulation variables, such as 850-hPa horizontal wind, 500 and 850-hPa geopotential height, and vertical velocity and specific humidity at a multiple of isobaric levels, which all have a horizontal resolution of 2.5°×2.5° and are from the NCEP/NCAR reanalysis(Kalnay et al., 1996); and (3)monthly SST with a horizontal resolution of 2°×2° from the extended reconstruction seasurface temperature(ERSST)data provided by theUS National Oceanic and Atmospheric Administration(Smith and Reynolds, 2003). For all the datasetsabove, only the data in the period from January 1970to December 2010 are used in this study.
To underst and the connection of El Niño with theEASM, several indices are adapted or defined. TheNiño3.4 index is defined as the area-averaged SSTanomalies over 5°S-5°N, 120°-170°W as usual. TheIndian Ocean Basin Mode(IOBM)index is definedas the time series of the first empirical orthogonalfunction(EOF)of monthly SST in the tropical IndianOcean. As demonstrated by Yang and Liu(2008), thedefined IOBM index has a high correlation coefficientof 0.9989 with the area-averaged SST anomalies overthe tropical Indian Ocean. A rainfall index used todescribe the rainfall in the middle-lower YRV is defined as the mean of observed rainfall at 17 stationsincluding Yichang, Changde, Zhongxiang, Nanyang, Yueyang, Xinyang, Hankou, Jiujiang, Fuyang, Anqing, Hefei, Bangbu, Tunxi, Nanjing, Qingjiang, Hangzhou, and Dongtai.2.2 Model and experimental design
To investigate the influence of SST anomalieson atmospheric circulations, we used an AGCM, the GFDL(Geophysical Fluid Dynamics Laboratory)AM2.1(Atmospheric Model; AM2.1 in brief), to conduct sensitivity experiments. AM2.1 uses the ArakawaB grid with a horizontal resolution of 2.5°×2.0° and a hybrid coordinate grid with 24 vertical levels fromthe surface to approximately 3 hPa. More detailscan be found from the GMAT paper(Global Atmospheric Model Development Team, 2004). Fu et al.(2009)suggested that the model simulates the variation of the EASM well and thus is appropriate for ourstudy.
We performed three sets of ensembles with threemembers each. The first ensemble, referred to asthe control ensemble(CTL), used the climatologicalmonthly SST to drive the model, whose three members started from different initial fields and have anintegration period of 21 yr. The second set, referredto as the sensitivity ensemble(hereafter E98), was carried out in the same way except that the observed historical SST anomalies from September 1997 to August1998 were used over 55°S-55°N. The third set(hereafter E10)was the same as the second set except thatthe historical SST was from September 2009 to August2010. The difference of the second or third set minusthe first set represents the atmospheric response to thetwo types of El Niño events.
Given the air-sea coupled signals in the observedSST in July and August, it is unclear whether theabove AGCM result is a response to the precedingSST or to the simultaneous SST in the above twosensitivity experiments. To address the issue, basedon an assumption that SST in June can persist untilAugust, we performed two additional sets of sensitiveensembles, persistent ensemble E98Jun and E10Jun.In E98Jun, the added SSTs from September 1997 toJune 1998 were the same as in E98, but for July and August, we added the SST in June 1998 instead ofthe observed SSTs in those two months. E10Jun issimilar to E98Jun but only the SST in June 2010 waskept for persistence. As such, the influence of prior-tosummer SSTs can be verified by comparing these twopersistent-SST ensembles(E98Jun and E10Jun)withthe above historical-SST ensembles(E98 and E10), respectively.3. Large-scale atmospheric circulations
Because severe floods occurred primarily in July and August 2010, the summer mean discussed in thispaper is referred to as the July-August mean. Figures1a and 1c show that rainfall anomalies in China werecharacterized by a pattern of "+ - +" from south tonorth in the summer of 2010. Positive rainfall anomalies appeared in the middle and lower reaches of theYangtze River, the Huaihe-Yellow River, the southernpart of the Yangtze-Huaihe River basins, and southcentral Northeast China. At the same time, two rainfall anomaly centers that received more than 100% ofthe normal rainfall amount were observed over thenorthern middle and lower reaches of the YangtzeRiver. In contrast, in 1998, negative rainfall anomaliesappeared in North China, south of the upper reachesof the Yangtze River, and northern Yangtze-HuaiheRiver basin; most notable among these negative rainfall anomalies indicate the severe droughts in Yunnan and Guizhou. Remarkable differences exist in rainfallanomalies in the lower reaches of the Yangtze River, the area from the Huaihe River to the Yellow River and northern Southwest China between 2010 and 1998(Figs. 1b and 1d). To explain these rainfall anomalies and differences, we analyzed the associated anomalouslarge-scale circulations.
As abundant water vapor and steady atmosphericcirculation are two favorable conditions for continuous heavy rainfall, a comparison of seasonal meanwind anomalies at 850 hPa and integrated water vapor fluxes between 2010 and 1998 is shown in Fig. 2.In 2010, a large-scale anomalous anticyclone was observed over the region between the South China Sea and Japan, with two centers located at the southerncoast of China and the Sea of Japan. Influenced by theanomalous southwesterly wind over the western side ofthe northern anticyclone, strengthened summer monsoon winds stretched northward to the Huaihe-YellowRiver basin. Corresponding to the anomalous circulations, moisture convergence occurred to the north ofthe upper and middle reaches of the Yangtze River, while divergence occurred over the southern reaches, according to the integrated water vapor analysis shownin Fig. 2c. At the same time, the anomalous southerlywind over the western side of the anticyclone in theSea of Japan brought more water vapor from the western Pacific Ocean to eastern and northeastern China, which is consistent with the converged water vaporfrom the east coast to the lower reaches of the YangtzeRiver.
 |
| Fig. 2. July-August averaged 850-hPa anomalous wind(vector; m s-1) and geopotential height(contour; gpm)in(a)2010 and (b)1998; integrated water vapor flux from surface to 300 hPa(vector; 0.1 kg m-1s-1) and divergence(shaded; 10-4 kg m-2 s-1)in(c)2010 and (d)1998. Anomalous southerlies are shaded, vectors less than 0.6 m s-1are omitted, and divergences less than -5 and more than 0 are shaded. |
Previous studies have suggested that the El Niñorelated anomalous low-level anticyclone often occursover the western North Pacific Ocean(hereafter WNPAC)during the peak of El Niño and persists untilthe following spring or summer(Huang and Wu, 1989).Zhang and Sumi(2002)observed that this anticyclone, as the key system connecting the SST over the Pacific and the climate of East Asia, has an important impact on East Asian summer monsoons and water vaportransport during the decaying years of El Niño events.It can be seen from Figs. 2a and 2b that the WNPACin 2010 extended westward and northward relative tothe WNPAC in 1998. Influenced by the anomalouseasterly wind over the southern flank of the WNPAC, the summer monsoon was weaker in 2010 than in 1998, and the water vapor transport by the monsoonal flowsfrom the Indian Ocean and the South China Sea wascorrespondingly reduced. Moreover, the anomalousdescending flow related to the WNPAC, together withreduced moisture, caused negative rainfall anomaly tothe south of the upper reaches of the Yangtze River, including Yunnan and Guizhou provinces. Meanwhile, in 2010, the summer monsoon extended northward and caused positive centers of rainfall anomalies to shiftnorthward as well. Consequently, the rainfall amountin the upper reaches of the Yangtze River was greaterin 2010 than in 1998.
Because the western Pacific subtropical high(hereafter WPSH)is one of the most important systems influencing the East Asian summer monsoon, theaforementioned WNPAC can influence summer rainfall by modulating the WPSH(Chang et al., 2000;Wang et al., 2000). We were therefore interested in determining whether there was any difference in the activity of the WPSH between 2010 and 1998. To answerthis question, we conducted a quantitative analysis ofthe WPSH by choosing the intensity, area, westernmost point, and ridge line indices of the WPSH from74 circulation indices of the National Climate Centerof China(Figs. 3a-3d). It is clear that in the summer of 2010, relative to 1998, the WPSH was steadier, shifted farther northward and extended farther westward with stronger intensity. These differences in theWPSH are also consistent with those of the WNPACbetween the two years. With regard to spatial distributions(Figs. 3e and 3f), we can clearly see that theridge line of the WPSH stretched northwestward to themiddle reaches of the Yangtze River and resulted inwarm moist flow from the south and cold dry air fromthe north meeting at the northwest flank of the WPSHwhere the rainstorms occurred. Thus, the anomalousactivities of the WPSH in 2010 partially explain thepositive rainfall anomalies to the north of the middle and lower reaches of the Yangtze River. Moreover, theWPSH intensity in the area west of 150°E was strongerthan normal; the WPSH was steadier because the areawas larger in 2010 than in 1998, which favored continuous rain.
 |
| Fig. 3.(a)Latitude of ridge line, (b)area index, (c)longitude of westernmost ridge line point, and (d)intensity ofthe WPSH in 1998 and 2010(dot-dashed lines indicate the climatological mean while the lines with closed and opencircles denote values in the years 1998 and 2010, respectively). Geopotential height anomalies at 500 hPa during thesummer of(e)2010 and (f)1998. The thick solid contour denotes the July-August mean of the "5880 gpm" line, the thickdashed contour denotes the climatological July-August mean of the "5880 gpm" line, and the anomaly contour interv al is15 gpm. |
It was suggested in the previous section that theWNPAC in 2010 located over the northwestern side ofthat in 1998 may explain the differences in the summermonsoons, WPSH, and rainfall anomaly between thetwo years. It is unclear why the location of the WNPAC differs between the two years. To answer thisquestion, the evolution of the preceding SST and circulation anomalies was investigated. We observed thatthe WNPAC is established after the El Niño breaks out and lasts for months after El Niño decays. Thus, twodifferent mechanisms are proposed to explain these observations. Wang et al.(2000)attributed the development and persistence of the WNPAC to the in-situ airsea interaction stimulated by El Niño over the westernPacific Ocean. On interannual timescale, there is anopposite sign of the SST between the tropical western and eastern Pacific Ocean. In response to the coolingrelated to El Niño in the western North Pacific, convective heating is suppressed, and precipitation is reduced, exciting a Rossby wave response on the westside of the cooling. The associated anomalous easterly wind then results in decreased SST by enhancingevaporation and forcing a negative geopotential heightresponse at the low level. When El Niño decays and the SST in the central-eastern Pacific normalizes, theWNPAC can persist for 3-5 months because of thepositive thermodynamic feedback between sea surfacecooling and anomalous northeasterly wind over theeast side of the WNPAC(Wang et al., 2000; Wang and Zhang, 2002). Another mechanism proposed by Yang et al.(2007)is the influence of the Indian Ocean.As discussed in that study, the Indian Ocean acts asa "capacitor" that stores the signal of El Niño and releases it when El Niño decays. Thus, the WNPACcan persist because the Indian Ocean basin warmingprolongs the influence of El Niño by forcing a Kelvinwave response and in-situ air-sea feedback(Yang et al., 2007; Li et al., 2008; Huang and Hu, 2008; Wu et al., 2010). These two mechanisms are both related to theevolution of the preceding SST and circulation anomalies; therefore, analyses of these mechanisms may becrucial to the underst and ing of the differences in theWNPAC between 2010 and 1998.
Figures 4a and 4b depict the evolution of theanomalous SST in the equatorial Indian-Pacific Ocean(averaged between 5°S and 5°N)during 2009/10 and 1997/98, respectively. As shown in the figures, thecase of 2009/10 is an El Niño Modoki, and the caseof 1997/98 is a typical El Niño. First, in the caseof 2009/10, we can see that the El Niño event burstout in June 2009, with SST anomalies above 0.5℃in the entire region of the central-eastern equatorialPacific. Also seen is the overlain anomalous westerlywind, which favors the development of warm water bydepressing the upwelling of cold water. In September 2009, the SSTA over the eastern Pacific did notincrease continuously like the SSTA over the centralPacific, which may be related to the extension of thenegative SST anomaly from higher latitudes to theequator. In November 2009, the El Niño Modoki eventreached its peak with a maximum SST anomaly of 2℃over the central Pacific, and the Niño3.4 index was1.9℃(Fig. 5). Following the appearance of anomalous easterly wind in the west-central Pacific in February 2010, the warm SST anomaly propagated eastward and decreased rapidly in the central Pacific, which indicated the start of the decay period. When the SSTanomaly with the opposite sign to that in June 2009appeared in June 2010, the warm event ended and a cold event began. The evolution during 1997/98was distinctly different from that in 2009/10. In May1997, anomalous westerly wind appeared in the western Pacific and resulted in the eastward propagationof warm water by exciting the eastward-propagatingKelvin wave, after which the typical El Niño eventbroke out(Huang et al., 2000; Yue and Lu, 2009). Afterward, the event peaked in the winter of 1998/98 and then decayed rapidly. We find that the typical ElNiño event of 1997/98 decayed more slowly than theEl Niño Modoki event of 2009/10 because the positiveSSTA remained in the eastern Pacific in July and August 1998.
 |
| Fig. 4. Time-longitude sections of the sea surface temperature anomalies(℃; contour interv al: 0.5℃; shadings denoteareas with SST A greater than 0.5℃)within 5°S-5°N for(a)2009/10 and (b)1997/98; and time-longitude sections ofzonal wind anomalies(m s-1; contour interv al: 2 m s-1)at 850 hPa within 5°S-5°N for(c)2009/10 and (d)1997/98. |
The Indian Ocean is one of the most importantsources of water vapor for East Asia, and its thermalstate is closely related to that of the equatorial Pacific.Thus, the SSTA evolutions in the Indian Ocean duringthe two El Niño cases were compared and significantdifferences were found. As seen in Fig. 4, during1997/98, the dipole mode appeared in autumn and then changed into a basin warming mode in winter.Unlike in 1997/98, the SSTA in much of the tropicalIndian Ocean was positive in the beginning of 2009 and developed together with the El Niño Modoki event.The maximum SSTA was in excess of 1.5℃ in 2010.Generally, the El Niño Modoki event of 2009/10 hadthe characteristics of later onset, weaker intensity, and shorter persistence, and it developed more slowly, and decayed more rapidly relative to the 1997/98 El Niñoevent. Additionally, the Indian Ocean basin warmingappeared earlier, lasted longer, and was stronger during 2009-2010 than that during 1997-1998.
Figure 5 shows the evolutions of the Niño3.4 index and the IOBM index. The characteristics mentioned above can also be seen in the two indices. Theonset of the 1997/98 El Niño was earlier(the valueof the Niño3.4 index was 0.5℃ or more greater thanthe st and ard). This event burst out in May 1997, peaked in November 1997, and decayed in May 1998.However, the onset and peak times in the case of the2009/10 event were one month later than those of the1997/98 event, and the time of its decaying was onemonth earlier. During 2009/10, the IOBM event occurred earlier but decayed at almost the same time asthe 1997/98 event; furthermore, there was no apparent dipole mode in the autumn. The spatial distributions of SSTA in the preceding winter and the following summer are shown in Fig. 6. In summer 2010, SSTA exhibited a La Niña pattern of heating anomalyin the western Pacific and cooling anomaly in the eastern Pacific. Meanwhile, two cold tongues stretchedwestward along the equatorial and Northwest Pacific;the latter cold tongue cooled the western North Pacificto below-normal temperatures. In contrast, SSTA insummer 1998 followed a warm-cold-warm pattern, and the western North Pacific was warmer relative to 2010, whereas an opposite trend was observed in the IndianOcean.
 |
| Fig. 5. Evolution of the Niño3.4 and IOBM indices during 1997/98 and 2009/10. The numbers 0 and 1 denote thedeveloping and decaying years of El Niño, respectively . |
 |
| Fig. 6. October-December mean sea surface temperature anomalies(SST As; ℃)in(a)2009 and (b)1997; and July-August mean SST As in(c)2010 and (d)1998. Contour interv al is 0.5℃, and areas with SST As greater than 0.15℃ areshaded. |
It is suggested that the evolution of the SSTA canexplain the differences of WNPAC(the western NorthPacific anticyclone)between the two years. Based onthe analysis of circulation anomalies over 850 hPa, thedevelopment of the WNPAC occurred one month laterin 2009/10 than in 1997/98. As shown in Fig. 7a, inOctober 2009, although an anomalous anticyclone existed in the east of the Philippine Sea, the cyclonicanomaly was also found over the northern part of theSouth China Sea. In November(Fig. 7c), an anticyclonic anomaly appeared in the entire western Pacific, meaning that the WNPAC did not develop fully until November. However, the evolution of WNPAC wasdifferent in 1997: the WNPAC was already fully developed by October of that year(Figs. 7b and 7d).The differences in the WNPAC development time correspond well to the differences in the maturation timebetween the two El Niño cases, further supporting theidea that El Niño plays an important role in WNPACformation.
 |
| Fig. 7. Streamfunction anomalies at 850 hPa in(a)October and (c)November 2009, as well as in(b)October and (d)November 1997. Contour interv al is 0.1×10⁻⁶ m2 s-1. |
The role of tropical SSTs can be explained byWalker circulation. A comparison of the anomalousvelocity potential and divergent wind at 200 hPa during the peak phase(October-December mean)of thetwo El Niño events is shown in Fig. 8. An anomalousascending motion was observed west of the date line(~170°E)in 2009, which is consistent with the location of the maximum warm SST anomaly. Correspondingly, convergence occurred over high level and divergence appeared over low level near the Philippine Sea, and rainfall was depressed due to the associated anomalous sinking motion(figure omitted).However, an anomalous ascending motion appearedeast of the date line(~150°W)in 1997, and an anomalous descending motion simultaneously moved southeastward relative to that in 2009(Fig. 8b). This suggests that in 2009 relative to 1997, the northwestwardshifted anomalous descending motion was associatedwith anomalous warm SSTs in the eastern equatorialPacific, and the relative change occurred in the regionof depressed convection. This explains why the WNPAC was further northwestward in 2009 relative to1997.
 |
| Fig. 8. The 200-hPa velocity potential(contour; ×10-6 m2 s-1) and divergent winds(vector; contour interv al is 1×10⁻⁶ m2 s-1)in October-December of(a)2009 and (b)1997. |
As previously discussed, analysis of the monthlyevolution of circulations revealed that the WNPACwas further northwestward in 2009/10 relative to1997/98, especially during the summer months(Fig. 2). This difference cannot be fully attributed to thedifferences in preceding SSTs between the two El Niñoevents because both events started decaying during thespring(Fig. 4). It is inferred that the delayed effect ofthe Indian Ocean mentioned above may provide additional explanation for this difference. Although the ElNiño event was weaker in 2009/10 than in 1997/98, theIndian Ocean basin warming was stronger(Figs. 5 and 6). The SST in the Indian Ocean plays a role in prolonging the WNPAC by emanating an eastward propagating Kelvin wave along with induced anomalouseasterly wind in the western tropical Pacific(Yang et al., 2007; Xie et al., 2009). Corresponding to the SSTdistribution in the Indian Ocean, the easterly windanomaly had a larger latitudinal extension across thewestern tropical Pacific in 2010 than in 1998(Fig. 2), which confirms our previous analysis.
Additionally, the difference in the in-situ air-seainteraction cannot be neglected. During 1997/98, theWNPAC was farther southeastward(Fig. 7b), and the northeasterly wind anomaly over its east side wasstronger. Then, the climatological northeast tradewind intensified, resulting in decreased SSTs due toevaporation. As a result of the wind-evaporation-SST feedback, an anomalous anticyclone developed and moved eastward along with the propagating cooling effect. However, due to the further northwesternlocation of the WNPAC during 2009/10, the easterlywind anomaly over the east side of the WNPAC wasnot so strong as in 1997/98, such that the climatological northeast trade wind was only slightly altered.Therefore, the eastward propagation of the WNPAC and the cooling was not apparent due to the weakwind-evaporation-SST feedback. It is suggested thatdifferent positions of the WNPAC during the peakphase of different types of El Niño events result in differences in the in-situ air-sea feedback and differencesin the later evolution of the WNPAC.4.2 Numerical simulation results
The observational analysis above suggests thatdifferences in preceding SSTAs and associated evolutions may be the cause of differences in large-scalecirculations between 2010 and 1998. To confirm thishypothesis, we designed the experiments described inSection 2 using the observed SSTs over middle and lowlatitudes in 1997/98 and 2009/10 to force the AGCM.
Based on the simulation for 2010(Figs. 9a and 9c), a low-level anticyclone response was found overthe western North Pacific. Due to the anomalouseasterly wind over the southern flank and southerlywind over the western flank, the monsoon in the SouthChina Sea became weaker than normal, while the eastern China monsoon became stronger. In responseto the observed SSTs, anomalous northerly wind appeared in middle to high latitudes. In the 500-hPageopotential height field, a positive anomaly was foundover the western North Pacific, which corresponded tothe low-level anticyclone. Thus, the WPSH apparentlygrew stronger and extended further westward thannormal. Relative to the simulation for 1998(Figs. 9c and 9d), the WNPAC in 2010 was stronger and spreadfurther northwestward; the summer monsoon correspondingly strengthened and moved further north. Inmiddle to high latitudes, the response of the anomalous northerly wind was not so strong as in 1998, sothe cold air was weaker. The simulated WPSH wasstronger in 2010 than in 1998; furthermore, the WPSHarea was larger and the ridge line stretched furthernorthwest to the mainl and of China.
 |
| Fig. 9. July-August mean of the simulated 500-hPa anomalous geopotential height for(a)2010 and (b)1998(contourinterv al is 10 gpm; thick line denotes climatological mean); and 850-hPa anomalous geopotential height(contour; gpm) and wind fields(vector; m s-1; areas with values at the 90% significance level are shaded)for(c)2010 and (d)1998. |
Figure 10 shows the simulated anomalous vertical velocity during the peak phase of the two El Niñoevents. The anomalous ascending flow moved furtherwestward in 2009 than in 1998, and the associatedanomalous descending flow on the northwestern sidefollowed a similar pattern. Compared with observational data, the model adequately simulated key features of the anomalous circulations related to summerrainfalls in 2010 and 1998. However, there are stillsome differences in the WNPAC between simulations and observations. These discrepancies could be causedby a systematic bias of the model or other factors besides the SST.
 |
| Fig. 10. Simulated anomalous vertical pressure velocity at 500 hPa in December 2009(contour) and 1997(shaded).Anomalous vertical velocities greater than 0.03 Pa s-1 and less than -0.06 Pa s-1are light-shaded and dark-shaded, respectively . |
The two simulations discussed above were carriedout based on the addition of SST anomalies over 55°S-55°N from September 1997 to August 1998. Becausethe observed SSTs in July and August include contributions from the air-sea interaction, it is di°cult to ascertain the influence of preceding SSTs on the climateanomalies formed in July and August. Therefore, wedesigned two additional experiments with the assumption that the SST in June can persist until August.The results from these two experiments are shown inFig. 11. At 500 hPa, the simulated WPSH extendedfurther northwestward in 2010 than in 1998. At thesame time, the WNPAC was captured by the modelin both years and stretched further westward in 2010than in 1998. This indicates that the results of E98Jun and E10Jun are consistent with observational data, and we can confirm that the preceding SSTs indeedplayed a crucial role in the formation of anomalouscirculations in the summers of 2010 and 1998. Additionally, when Figs. 9 and 10 are compared, thesecond two experiments differ in certain respects fromthe first two sensitivity experiments. In the simulatedwind fields of E10Jun, there were two anomalous anticyclones at 850 hPa: one over eastern Japan and theother over the l and around 110°E. This further confirms that the simulated circulation anomalies actuallycontain the simultaneous air-sea interaction signal inJuly and August in both years; therefore, these anomalies cannot be attributed solely to the preceding SST.
 |
| Fig. 11. As in Fig. 9, but for the E98Jun and E10Jun experiments. Contour interv als in(a) and (c)are 5 gpm; contourinterv als in(b) and (d)are 10 gpm. |
The results of these experiments show that, forcedby the observed monthly SSTAs during 1997/98 and 2009/10, the main features of circulations related tothe summer rainfall anomalies are well reproduced.Therefore, it is proposed that the two types of El Niñoevents have substantial influences on summer rainfallanomalies and associated circulation anomalies.5. Comparison with composites: influence of two types of El Niño events
Although the severe floods that occurred duringsummers of 1998 and 2010 are related to abnormal atmospheric circulations, and both occurred in the timefollowing El Niño events, distinct differences exist between the two flood events. In this study, the caseof 1997/98 is classified as a typical El Niño event(oreastern El Niño), and the case of 2009/10 is classifiedas an El Niño Modoki event(or central El Niño). Inthis section, we investigate whether these two particular cases reflect differences between common El Niñoevents and El Niño Modoki events. For this purpose, we will perform a comparison between single cases and the composite of each type of cases.
El Niño events are identified by a Niño3.4 index exceeding 0.5℃ and lasting for 5 months. Basedon this metric, 11 events in 1970-2010, 1972/1973, 1982/1983, 1986/1987, 1987/1988, 1991/1992, 1994/1995, 1997/1998, 2002/2003, 2004/2005, 2006/2007, and 2009/2010 are identified. Here, weexclude the 1986/1987 event because the SSTA in thetropical Pacific presents the pattern of El Niño in thesummer of 1987, and it therefore cannot be classifiedas the decaying phase of an El Niño event. Furthermore, according to the El Niño Modoki index(EMI)developed by Ashok et al.(2007), 5 of the remaining10 El Niño events are Modoki events. Table 1 showsthe characteristics of the 10 El Niño events. The2009/10 El Niño Modoki and the 1997/98 typical ElNiño represent the strongest events of their respectivetypes since 1970.
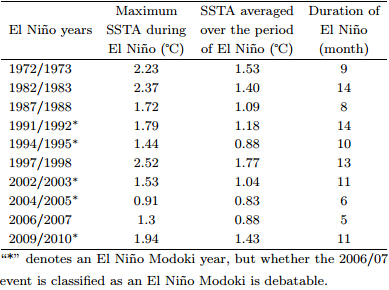
Figure 12 shows the composite rainfall anomalies in the decaying summer for El Niño Modoki and typical El Niño events. The years used in the composite analysis are taken from Feng et al.(2010), and the climatological mean period is 1971-2000. Forthe following summer of Modoki events, the rain beltwas located in northern YRV, and the positive centerwas found over the region between the middle-lowerreaches of the Yangtze and Yellow Rivers; additionally, the southern YRV was covered by negative rainfall anomalies. Compared with typical El Niño events, the rain belt associated with Modoki events shiftednorthward; thus, positive rainfall anomalies appearedin the Huaihe River, while droughts appeared in southwestern China.
 |
| Fig. 12. Summer(July-August)rainfall anomalies over China for(a)composite El Niño Modoki and (b)traditionalEl Niño decaying years. Contour interv al is 10 mm mon-1; areas with values at the 90% signi¯cance level are shaded. |
A comparison of the composite Modoki event withthe single case in 2010(Figs. 12 and 1a)reveals thatthe rainfall anomalies are opposites of one another inthe Huaihe River and lower reaches of the YangtzeRiver and its south. In contrast, these anomalies areconsistent to the north of the middle reaches of theYangtze River and in southwestern China. This suggests that the anomalous situation in 2010 is not fullyinfluenced by Modoki and that the influence of El NiñoModoki on summer rainfall in China is more complicated than previously understood.6. Summary and discussion
In this investigation, different datasets were firstused to compare rainfall anomalies and associatedcirculation anomalies in the two flooding years 2010 and 1998. Then, AGCM experiments were conductedto investigate the influence of the preceding SSTA inmid-low latitudinal oceans, particularly those associated with the 1997/98 typical El Niño and the 2009/10El Niño Modoki. The primary results are summarizedas follows.
(1)Except for a similar intensification in theYRV, rainfall anomalies in a wide domain were significantly different in 2010 and 1998. In 2010, increasedrainfall were seen in the middle and lower reaches ofthe Yangtze River, the Huaihe-Yellow River valley, and the northern part of the Yangtze-Huaihe Riverbasin, along with decreased rainfall in southern China and the southern side of the upper reaches of theYangtze River. In contrast, intensified rainfall wasfound in the entire Yangtze River basin in 1998.
(2)In comparison with the case in 1998, the lower-level western North Pacific anticyclone(WNPAC)in2010 was stronger and shifted northwestward, causingweakened southwesterly from the Bay of Bengal to theSouth China Sea but intensified southerly in easternChina. This resulted in less water vapor transportfrom the tropical Indian Ocean and the South ChinaSea but more from the western subtropical Pacifictoward East Asia. Subsequently, the summertimerainb and in 2010 shifted northward.
(3)The difference in the maximum warming locations of the two types of El Niño events can explain theanomalous rainfall and atmospheric circulations. Relative to a typical El Niño, Modoki features anomalouswestward-shifted ascent in the equatorial Pacific together with anomalous descent in the western Pacific, which cause a northwestward shift of the WNPAC and bring warm moist flow to further north and induce more rainfall in the Huaihe River valley ratherthan in the YRV.
(4)The 2010 case was compared with the composite of historical El Niño Modoki events and a substantial difference was found. The result indicatesthat the impact of El Niño Modoki is more complicated than previously understood, and a case-to-casedifference may exist.
It is important to note that the difference in rainfall anomalies between early summer(June) and latesummer(July-August)in the middle-lower reaches ofthe Yangtze River is evident. Figure 1e displays astrong decrease in 2010 but increase in 1998. This difference may be related to the different climatologies inearly and late summer. Moreover, rainfall anomaliesbecame weak from July to August in both 1998 and 2010. We attribute this to two causes: the reducedrainfall due to the rapid northward shift of the rainbelt in July and the weakening of the influence of thepreceding SST because of the air-sea feedback. However, the mechanisms for these noticeable phenomenaneed further investigations.
This study compared the influence of an El NiñoModoki(2009/10)with that of a typical El Niño(1997/98)on large-scale summer rainfall distributionin East China. In fact, differences in the meso- and micro-scale rainfall are also evident, which cannot befully explained by the influence of large-scale SSTAs.Other factors such as the thermal state of the TibetanPlateau, Arctic sea ice, and mesoscale l and forms mayalso play important roles. Therefore, this study isof deficiency because of its exclusive consideration ofSST. This topic needs to be further studied by usingnested mesoscale regional climate models. Additionally, only a brief discussion about the mechanismfor the development and persistence of the WNPACis provided here. Obvious differences are seen between the simulated and the observed anomalies inthe WPSH and the WNPAC, which may be related tothe model's systematic bias.
Acknowledgments: The authors sincerely appreciate the valuable suggestions and comments fromthe anonymous reviewers.
| [1] | Arthur, N. S., and X. Z. Liang, 2003: Understanding relationships between the 1998 Yangtze River flood and Northeast Eurasian blocking. Climate Res., 23, 149-158. |
| [2] | Ashok, K., S. K. Behera, S. A. Rao, et al., 2007: El Niño Modoki and its possible teleconnection. J. Geophys. Res., 112, C11007. |
| [3] | Chang, C. P., Y. S. Zhang, and T. Li, 2000: Interannual and interdecadal variations of the East Asian summer monsoon and tropical Pacific SST. Part I: Roles of the subtropical ridge. J. Climate, 13, 4310-4325. |
| [4] | Chen Lieting, 2001: The role of the anomalous snow cover over the Qinghai-Xizang Plateau and ENSO in the great floods of 1998 in the Changjiang River valley. Chinese J. Atmos. Sci., 25(2), 184-192. (in Chinese) |
| [5] | Chen Wen, 2002: Impacts of El Niño and La Niña on the cycle of the East Asian winter and summer monsoon. Chinese J. Atmos. Sci., 26(5), 595-610. (in Chinese) |
| [6] | Ding Yihui and Hu Guoquan, 2003: A study on water vapor budget over China during 1998 severe flood periods. Acta Meteor. Sinica, 61(2), 129-145. (in Chinese) |
| [7] | Feng, J., W. Chen, C. Y. Tam, et al., 2010: Different impacts of El Niño and El Niño Modoki on China rainfall in the decaying phases. Int. J. Climatol., doi: 10.1002/joc.2217. |
| [8] | Fu, C., H. F. Diaz, and J. O. Fletcher, 1986: Characteristics of the response of sea surface temperature in the central Pacific associated with warm episodes of the Southern Oscillation. Mon. Wea. Rev., 114(9), 1716-1738. |
| [9] | Fu Congbin and Teng Xinglin, 1988: Climate anomalies in China associated with El Niño/Southern Oscillation. Chinese J. Atmos. Sci., 22 (special issue), 133-141. (in Chinese) |
| [10] | Fu Jianjian, Li Shuanglin, and Luo Dehai, 2009: Impact of global SST on decadal shift of East Asian summer climate. Adv. Atmos. Sci., 26(2), 192-201. |
| [11] | GAMT (The GFDL Global Atmospheric Model Development Team), 2004: The new GFDL global atmosphere and land model AM2/LM2: Evaluation with prescribed SST simulations. J. Climate, 17, 4641-4673. |
| [12] | Guo Yufu, Zhao Yan, and Wang Jia, 2002: Numerical simulation of the relationships between the 1998 Yangtze River valley floods and SST anomalies. Adv. Atmos. Sci., 19(3), 391-404. |
| [13] | Huang Gang and Hu Kaiming, 2008: Impact of North Indian Ocean SSTA on Northwest Pacific lower layer anomalies anticyclone in summer. J. Nanjing Institute Meteor., 31(6), 749-757. (in Chinese) |
| [14] | Huang Ronghui and Wu Yifang, 1989: The influence of ENSO on the summer climate change in China and its mechanism. Adv. Atmos. Sci., 6(1), 21-32. |
| [15] | --, Xu Yuhong, Wang Pengfei, et al., 1998: The features of the catastrophic flood over the Changjiang River basin during the summer of 1998 and cause exploration. Climatic Environ. Res., 3(4), 300-312. (in Chinese) |
| [16] | --, Zhang Renhe, and Zhang Qinyun, 2000: The 1997/98 ENSO cycle and its impact on summer climate anomalies in East Asia. Adv. Atmos. Sci., 17(3), 348-362. |
| [17] | --, Chen Wen, Yang Bangliang, et al., 2004: Recent advances in studies of the interaction between the East Asian winter and summer monsoons and ENSO cycle. Adv. Atmos. Sci., 21, 407-424. |
| [18] | Kalnay, E., M. Kanamitsu, R. Kistler, et al., 1996: The NCEP/NCAR 40-year reanalysis project. Bull. Amer. Meteor. Soc., 77, 437-470. |
| [19] | Kao, H. Y., and J. Y. Yu, 2009: Contrasting eastern-Pacific and central-Pacific types of ENSO. J. Climate, 22, 615-632. |
| [20] | Kug, J. S., F. F. Jin, and S. I. An, 2009: Two types of El Niño events: Cold tongue El Niño and warm pool El Niño. J. Climate, 22, 1499-1515. |
| [21] | Lee, T., and M. J. McPhaden, 2010: Increasing intensity of El Niño in the central-equatorial Pacific. Geophys. Res. Lett., 37, L14603, doi: 10.1029/2010GL044007. |
| [22] | Li Shuanglin, Ji Liren, and Lin Wantao, 2001: The maintenance of the blocking over the Ural Mountains during the second Meiyu period in the summer of 1998 floods year. Adv. Atmos. Sci., 18(1), 87-105. |
| [23] | --, J. Lu, G. Huang, et al., 2008: Tropical Indian Ocean basin warming and East Asian summer monsoon: A multiple AGCM study. J. Climate, 21, 6080-6088. |
| [24] | Liu Ying and Ni Yunqi, 1998: Diagnostic research of the effects of ENSO on the Asian summer monsoon circulation and the summer precipitation in China. Acta Meteor. Sinica, 56(6), 681-691. (in Chinese) |
| [25] | Ratnam, J. V., S. K. Behera, Y. Masumoto, et al., 2011: Anomalous climatic conditions associated with El Niño Modoki during boreal winter of 2009. Climate Dyn., doi: 10.1007/s00382-011-1108-z. |
| [26] | Shen, X. S., K. Masahide, and S. Akimasa, 2001: Simulation of the 1998 East Asian summer monsoon by the CCSR/NIES AGCM. J. Meteor. Soc. Japan, 75(3), 741-757. |
| [27] | Smith, T. M., and R. W. Reynolds, 2003: Extended reconstruction of global sea surface temperatures based on COADS data (1854-1997). J. Climate, 16, 1495-1510. |
| [28] | Sun Shuqing and Ma Shujie, 2003: Analysis and numerical experiment on the relationship between the 1998 summer monsoon activities and SSTA in tropical regions. Chinese J. Atmos. Sci., 27(1), 36-52. (in Chinese) |
| [29] | SFDH (The State Flood Control and Drought Relief Headquarters), 2011: Chinese flood disaster in 2010. China Flood & Drought Management, 1, 1-3. (in Chinese) |
| [30] | Tao Shiyan, Zhang Qingyun, and Zhang Shunli, 1998: The great flood in the Changjiang River valley in 1998. Climatic Environ. Res., 3(4), 291-298. (in Chinese) |
| [31] | Wang, B., R. G. Wu, and X. H. Fu, 2000: Pacific-East Asian teleconnection: How does ENSO affect East Asian climate? J. Climate, 13, 1517-1536. |
| [32] | --, and Q. Zhang, 2002: Pacific-East Asian teleconnection. Part II: How the Philippine Sea anticyclone established during development of El Niño. J. Climate, 15, 3252-3265. |
| [33] | Wang Huijun, 2002: The instability of the East Asian summer monsoon-ENSO relations. Adv. Atmos. Sci., 19(1), 1-11. |
| [34] | Weng, H. Y., 2007: Impacts of recent El Niño Modoki on dry/wet conditions in the Pacific during boreal summer. Climate Dyn., 29(2), 113-129. |
| [35] | Wu, B., T. Li, and T. J. Zhou, 2010: Relative contribution of the Indian Ocean and local SST anomalies to the maintenance of the western North Pacific anomalous anticyclone during the El Niño decaying summer. J. Climate, 23, 2974-2986. |
| [36] | Xie, S. P., K. Hu, J. Hafner, et al., 2009: Indian Ocean capacitor effect on Indo-western Pacific climate during the summer following El Niño. J. Climate, 22, 730-747. |
| [37] | Xue Feng and Liu Changzheng, 2007: The influence of moderate ENSO on summer rainfall in eastern China and its comparison with strong ENSO. Chinese Sci. Bull., 52(23), 2798-2805. (in Chinese) |
| [38] | Yang, J. L., Q. Y. Liu, S. P. Xie, et al., 2007: Impact of the Indian Ocean SST basin mode on the Asian summer monsoon. Geophys. Res. Lett., 34, L02708, doi: 10.1029/2006GL028571. |
| [39] | Yang Jianling and Liu Qinyu, 2008: The "charge/discharge" roles of the basin-wide mode of the Indian Ocean SST anomaly-influence on the South Asian high in summer. Acta Oceanologica Sinica, 30(2), 12-19. (in Chinese) |
| [40] | Yeh, S. W., J. S. Kug, B. Dewitte, et al., 2009: El Niño in a changing climate. Nature, 461, 510-514. |
| [41] | Yue Caijun and Lu Weisong, 2009: Further study on possible mechanism for genesis and development of 1997/1998 El Niño event. Transactions Atmos. Sci., 32(4), 513-521. (in Chinese) |
| [42] | Zhang, R. H., A. Sumi, and M. Kimoto, 1996: Impact of El Niño on the East Asian monsoon: A diagnostic study of the 1986/87 and 1991/92 events. J. Meteor. Soc. Japan, 74(1), 49-62. |
| [43] | --, Akimasa Sumi, and Masahide Kimoto, 1999: A diagnostic study of the impact of El Niño on the precipitation in China. Adv. Atmos. Sci., 16, 229-241. |
| [44] | --, and A. Sumi, 2002: Moisture circulation over East Asia during El Niño episode in northern winter, spring and autumn. J. Meteor. Soc. Japan, 80, 213-227. |
| [45] | Zhang Qingyun and Chang Rui, 2007: A study of anomalous atmospheric-ocean currents and the propagation mechanism for warm signal of sea temperature during El Niño events. Chinese J. Atmos. Sci., 31(6), 1160-1170. (in Chinese) |
| [46] | Zhang Zhihua and Huang Gang, 2008: Different types of El Niño events and their relationships with China summer climate anomaly. J. Nanjing Institute Meteor., 31(6), 782-789. (in Chinese) |
| [47] | Zong Haifeng, Chen Lieting, and Zhang Qingyun, 2010: The instability of the interannual relatonship between ENSO and the summer rainfall in China. Chinese J. Atmos. Sci., 34(1), 184-192. (in Chinese) |