 2012, Vol. 26
The Chinese Meteorological Society
Article Information
- Dai Tie, Shi Guangyu, Zhang Xingying, and XU Na. 2012.
- Influence of HITRAN Database Updates on Retrievals of Atmospheric CO2 from Near-Infrared Spectra
- J. Meteor. Res., 26(5): 629-641
- http://dx.doi.org/10.1007/s13351-012-0507-3
-
Article History
- Received November 4, 2011
- in final form March 12, 2012


2 National Satellite Meteorological Center, Beijing 100081
The emission of CO2 has increased remarkablyover the past century due to mass consumption of fossilfuels and the expansion of industrial activities. Anincrease of atmospheric CO2 is expected to lead tosignificant future climate change because of its poweras a greenhouse gas. The reliable prediction of futureatmospheric CO2 concentration and associated globalclimate changes requires an adequate underst and ing ofthe sources and sinks of CO2; unfortunately,this underst and inghas significant gaps and uncertainties arelarge(Stephens et al., 2007). The persistence of largeuncertainties is in part due to the sparseness and inhomogeneousgeographical distribution of the approximately180 CO2 measurement sites that constitute thecurrent observing system(Globalview-CO2,2010).
Theoretical studies have shown that satellite measurementsof CO2 in combination with atmospherictransport models could be used to significantly reduceuncertainties in surface CO2 fluxes(Rayner and O’Brien,2001; Houweling et al., 2004). Satellite-basedremote sensing of CO2 can be accomplished by measuringradiances in either the thermal infrared(IR)spectral region(Chédin et al., 2002,2003a,b; Engelen et al., 2004; Aumann et al., 2005; Strow et al., 2006)or the near-infrared(NIR)region(Tolton and Plouffe, 2001; O’Brien and Rayner, 2002; Mao and Kawa, 2004,Buchwitz et al., 2005a,b,2006,2007; Houweling et al., 2005; Bösch et al., 2006; Barkley et al., 2006a,b,c,2007). With respect to CO2 column-average values,retrievals using measurements from the NIR regionslightly outperform those using measurements fromthe IR region(Christi and Stephens, 2004). TheSCanning Imaging Absorption spectroMeter for AtmosphericCHartographY(SCIAMACHY)is the firstsatellite instrument to measure reflected solar radiationin the NIR spectral region that contains theCO2 absorption b and s. SCIAMACHY near-infrarednadir measurements have been used to retrieve verticalcolumns of CO2 from the 1.58-μm absorptionb and (Schneising et al., 2008). With the aim of makingglobal space-based measurements of atmosphericCO2 at the spatial resolution and accuracy needed tocharacterize surface sources and sinks,the NationalAeronautics and Space Administration(NASA)selectedthe Orbiting Carbon Observatory(OCO)asthe fifth mission in Earth System Science Pathfinder(ESSP)Program(Crisp et al., 2004). The OCO wasunfortunately lost due to launch failure in February2009; nevertheless,its successors and the GreenhouseGases Observatory Satellite(GOSAT)use the CO2vibration-rotation transition b and s in the 2.06- and 1.61-μm(or alternatively 1.58-μm)regions to makespace-based measurements of CO2 with the precision,resolution, and coverage needed to characterize CO2sources and sinks on regional scales.
The High Resolution Transmission(HITRAN)database is a recognized international st and ard usedfor a vast array of applications including atmosphericradiation transmission simulations and atmosphericremote sensing. Feng et al.(2007) and Feng and Zhao(2009)have previously analyzed the effects of improvementsto the HITRAN 2004 database(Rothman et al., 2005)on radiative transfer and transmittance calculations.A large number of experimental and theoreticalinvestigations of CO2 spectra have been undertakensince the release of HITRAN 2004. The HITRAN2008 CO2 line lists in the NIR region from 4300 to7000 cm−1 completely replace HITRAN 2004 data inthis spectral range(Rothman et al., 2009). This studyprovides a comparison of the simulated transmissionspectra and sensitivity to changes in CO2 amount usingline parameters from the HITRAN 2004 and HITRAN2008 databases. The purpose of this comparisonis to investigate the effects of the modifications ofline parameter data on retrievals of CO2 atmosphericamount by NIR reflected sunlight. Three spectral regionsare selected that cover the CO2 b and s used bythe SCIAMACHY and GOSAT instruments,as wellas the eventual successor to the OCO.2. Outline of the calculation
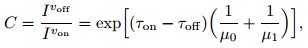
In practice,the retrieval of atmospheric CO2 fromdifferential absorption of reflected sunlight is undertakenby using the ratio of measured radiances ata weak absorption channel(called an off-line) and a strong absorption channel(called an on-line)toestimate column CO2 without retrieving surface reflectance(O’Brien and Rayner, 2002; Mao and Kawa, 2004). In a clear atmosphere,this ratio can be expressedas
The Line-by-Line Radiative Transfer Model(LBLRTM),developed by Atmospheric and EnvironmentalResearch,Inc.(Clough et al., 1992,1995),isused to simulate the transmission spectra in this study.The LBLRTM is an accurate,efficient, and wellvalidated line-by-line code that can be used over thefull spectral range from the microwave to the ultraviolet.This model provides the foundation for manyradiative transfer applications. The model uses aVoigt line shape with a line cutoff of 25 cm−1 fromthe line center at all atmospheric levels with an algorithmbased on a linear combination of approximatingfunctions. This approach allows the inclusion of bothcollision- and Doppler-broadening processes. The HITRANdatabase is used as input to LBLRTM. Themain features of LBLRTM are described in Clough etal.(2005).
The 1976 United States(U.S.)st and ard atmosphereis used for atmospheric profiles up to 120-km altitude.The model atmosphere is assumed to be planeparallel and divided into 50 total layers. The verticalresolutions of the layers of 0–25,25–50, and 50–120km are 1,2.5, and 5 km,respectively. Each layer isconsidered as a homogeneous path in the calculations.The spectral regions used in this study are “B and -1”(4810–4890 cm−1),“B and -2”(6195–6255 cm−1), and “B and -3”(6315–6375 cm−1). These three b and s correspondto the CO2 vibration-rotation transition b and sin the 2.06-,1.61-, and 1.58-μm regions,which are usedby current or near-future satellite instruments that retrieveCO2 using nadir observations. Absorption byonly six major species(H2O,CO2,O3,N2,CO, and CH4)is included in the calculations, and the atmosphericprofiles used are representative of the defaultvalues in the U.S. st and ard model atmosphere exceptfor CO2. The influences of aerosols on the transmittancecalculations are not considered here.
The reference transmittance spectra are computedassuming a CO2 concentration of 379 ppmv.This value is equal to the global mean atmosphericmixing ratio of CO2 in 2005(Forster et al., 2007). Atriangle scanning function for simulating the instrumentslit function is used to convolve the line-by-linecalculated monochromatic transmittance and estimatethe effects of changes in spectral resolution on transmittance and transmittance sensitivity. The same calculationsare carried out at two spectral resolutions(0.2 and 1.0 cm−1)at Full Width at Half-Maximum(FWHM)in B and -1. These simulated spectral resolutionsare approximately equal to the spectral resolutionsof GOSAT and OCO,respectively. One additionalspectral resolution(5.8 cm−1)is applied atFWHM in B and -2 and B and -3,which is representativeof the spectral resolution realized by channel-6(5710–10000 cm−1)of the SCIAMACHY spectrometer usedto retrieve CO2. The output spectral sampling step is0.1 cm−1 for all of the spectral resolutions.3. Results3.1 Sensitivity to changes in CO2 concentrations
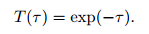
Table 1 summarizes the updates that have beenmade to the near-infrared spectral portion(4300–7000cm−1)of the HITRAN 2004 and HITRAN 2008 databases. These updates include changes to the totalnumber of line transitions,total line intensities,averageline intensities, and average air-broadened linehalf-widths for the species H2O,CO2,O3,N2,CO, and CH4. The line parameters for CO2 and O3 haveundergone major updates,the line parameters for H2O and CH4 have undergone minor updates, and the lineparameters for N2 and CO remain the same as in HITRAN2004. The number of line transitions compiledfor CO2 has increased by a factor of 7.9 from 9237transitions in the 2004 database to 72886 transitionsin the 2008 database. The sum of the CO2 line intensitiesin HITRAN 2008 is less than that in HITRAN2004,indicating that most of the added CO2 lines areweak absorption lines.
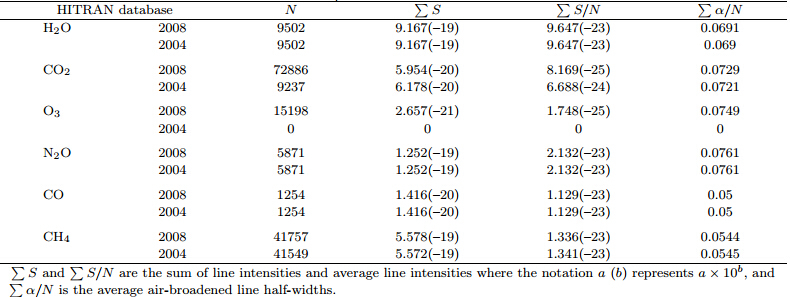 |
Figure 1 shows the calculated transmittancespectra in B and -1,B and -2, and B and -3 at differentspectral resolutions using the HITRAN 2008database. The CO2 absorption in B and -1 is considerablystronger than that in B and -2 or B and -3. Inaddition,the transmission spectra in B and -2 are verysimilar to those in B and -3.
 |
| Fig. 1. Total transmission spectra in the(a)2.06-μm,(b)1.61-μm, and (c)1.58-μm regions for the 1976 U.S. st and ardatmosphere using the HITRAN 2008 database. |
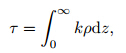
Transmittance sensitivity describes the effects ofperturbations to atmospheric composition on the atmospherictransmittance calculation. In this paper,itis defined as
where T is the transmittance and x is the concentrationof atmospheric gases. Figure 2 shows relativechanges in the transmittance spectra that correspondto a 1-ppmv CO2 column mixing ratio increase in thewhole atmosphere. These relative changes are calculatedat different spectral resolutions over the chosenthree b and s using line parameters from the HITRAN2008 database. When the atmospheric CO2 mixingratio increases uniformly by 1 ppmv throughout thewhole column,the resulting change in transmittance isnegative because an increase in the amount of CO2 inthe atmosphere increases absorption. Transmittancenear the absorption lines at a higher spectral resolutionindicates a higher sensitivity to changes in CO2concentration. In addition,the transmittance sensitivity to atmospheric CO2 change in B and -1 is aboutfour times higher than that in B and -2 or B and -3,becausethe transmission change is proportional to absorptionby CO2. The transmittance in B and -1 decreasesup to 0.45% at 0.2-cm−1 spectral resolution;when the spectral resolution is 1.0 cm−1,the maximumdecrease of the transmittance is around 0.11%,as shown in Fig. 2a. In addition,the spectral dependenceof the sensitivity to changes in CO2 concentrationsis similar to that of the transmittance,withpeaks near the centers of the absorption b and s. Thetransmittance changes in B and -2 and B and -3 appearvery similar since these vibration-rotation transitionshave very similar spectral structures and integratedintensities(Predoi-Cross et al., 2007). The transmittancein B and -2 decreases by up to 0.10% at 0.2-cm−1spectral resolution; when the spectral resolutions is 1.0cm−1,the maximum decrease of the transmittance isaround 0.02%. For the 5.8-cm−1 spectral resolution,the maximum decrease of the transmittance is around0.02%(Fig. 2b).
 |
| Fig. 2. Sensitivity tests of transmittance changes over the three spectral b and s given a 1-ppmv increase in CO2concentration distributed evenly throughout the atmospheric column.(a)B and -1,(b)B and -2, and (c)B and -3. |
Figure 3 illustrates the relative differences betweenthe calculated transmittance sensitivity to a 1-ppmv change in CO2 mixing ratio using the HITRAN2004 and HITRAN 2008 databases. The HITRAN2008 database results are used as the reference. Whenthe spectral resolution in B and -1 is 0.2 cm−1,the maximumrelative difference is about 54.6% and the meanrelative difference is about 7.0%; when the spectralresolution is 1.0 cm−1,the maximum relative differenceis about 10.4% and the mean relative difference isaround 3.1%. When the spectral resolution in B and -2is 0.2 cm−1,the maximum relative difference is around18.8% and the mean difference is around 2.1%; whenthe spectral resolution is 1.0 cm−1,the maximum relativedifference is around 13.3% and the mean differenceis about 2.3%,while a spectral resolution of 5.8 cm−1yields a maximum relative difference of around 11.9% and a mean difference of about 2.2%. When the spectralresolution in B and -3 is 0.2 cm−1,the maximumrelative difference is about 9.1%, and the mean relativedifference is around –1.7%; when the spectral resolutionis 1.0 cm−1,the maximum relative difference isabout 4% and the mean difference is about –1.0%, and when it is 5.8 cm−1,the maximum relative differenceis around 3.0% and the mean difference is around–1.0%. These results indicate that using the HITRAN2004 database in B and -1 or B and -2 could result inoverestimates of the sensitivity of atmospheric transmissionto atmospheric CO2 change,while using theHITRAN 2004 database could lead to underestimatesof the transmission sensitivity in B and -3.
 |
| Fig. 3. Relative differences between the calculated transmittance sensitivity to a 1-ppmv CO2 mixing-ratio changeusing the HITRAN 2004 and HITRAN 2008 databases(HITRAN 2004–HITRAN 2008).(a)B and -1,(b)B and -2, and (c)B and -3. |
Figure 4 shows relative differences between calculatedtransmittance using the HITRAN 2004 and HITRAN 2008 databases in the three NIR b and s atdifferent spectral resolutions. As above,the HITRAN2008 database is used as the reference.
 |
| Fig. 4. Relative differences between calculated transmittance spectra using the HITRAN 2004 and HITRAN 2008databases(HITRAN 2004–HITRAN 2008).(a)B and -1,(b)B and -2, and (c)B and -3. |
The transmittance differences in B and -1 are negativefor all the cases,indicating that use of theHITRAN 2004 database leads to underestimates oftransmittance and overestimates of CO2 absorption.The most prominent differences between the calculatedtransmission spectra occur in the absorptionbranch centers. The maximum decrease is approximately22% at the 0.2-cm−1 spectral resolution(Fig. 4a). This decrease is approximately equivalent to a49-ppmv change in the CO2 column mixing ratio ifthe transmittance sensitivity to the CO2 concentrationchange is taken as that shown in Fig. 2 and transmittance changes are assumed to be a linear functionof CO2 concentration changes. The maximumdecrease is about 5% when the spectral resolution is1.0 cm−1; this decrease is roughly equivalent to a 45-ppmv change in the CO2 column mixing ratio. Themost prominent differences in B and -2(Fig. 4b)occurin the spectral region 6235–6250 cm−1. As withB and -1,the differences are negative. When the spectralresolution is 0.2 cm−1,the maximum decrease isapproximately 2.6%,roughly equivalent to a 26-ppmvchange in the CO2 column mixing ratio. The maximumdecreases are 0.6% and 0.5% when the spectralresolutions are 1.0 and 5.8 cm−1,respectively. Thesechanges are approximately equivalent to a 25-ppmvchange in the CO2 column mixing ratio. The updatesto the HITRAN database have the smallest effecton transmittance in B and -3,relative to the effectson transmittance in B and -1 and B and -2. Thedifferences in B and -3 are only relatively large in thespectral region 6330–6340 cm−1. The differences arepositive for most of B and -3,rather than negative asfor B and -1 and B and -2. When the spectral resolutionis 0.2 cm−1,the maximum change is about 1.5%.This change is approximately equivalent to a 15-ppmvchange in CO2 column mixing ratio. The maximumchange is about 0.3% for the 1.0-cm−1 spectral resolution and about 0.2% for the 5.8-cm−1 spectral resolution.These changes are roughly equivalent to a10-ppmv change in CO2 column mixing ratio.3.3 Simulated satellite retrievals
Column CO2 abundance is typically retrieved byusing the radiance ratio between an off-line channel and an on-line channel. This ratio is often taken tobe the transmittance ratio,eliminating the need toperform complicated retrievals of surface reflectance.Accordingly,the accuracy of off-line to on-line transmittanceratio calculations has important effects onthe retrieval results. In this paper,the off-line frequenciesare chosen to be 4810.5,6196.4, and 6315.5cm−1 in B and -1,B and -2, and B and -3,respectively.Absorption is relatively weak at these frequencies.
Figure 5 shows relative differences in off-lineto on-line transmittance ratio when the HITRAN2004 database is used instead of the HITRAN 2008database. The results are presented for all three b and sat different spectral resolutions. The updates to theHITRAN database have the largest impact on thetransmittance ratio in B and -1. The ratio differencesare positive for most cases in B and -1. When the spectralresolution is 0.2 cm−1,the maximum ratio differencebetween the two HITRAN databases is approximately28%; when this spectral resolution is reducedto 1.0 cm−1,the maximum difference is approximately5%. The discrepancy is relatively large in B and -2 inthe spectral region 6235–6250 cm−1. When the spectralresolution is 0.2 cm−1,the maximum relative differences are around 2.6%. The maximum difference isabout 0.57% for the 1.0-cm−1 spectral resolution and 0.44% for the 5.8-cm−1 spectral resolution. The effectsof the updates to the HITRAN database on the transmittanceratios in B and -3 are relatively small,withthe largest discrepancy in the spectral region 6330–6340 cm−1. The ratio differences in B and -3 are negativefor most of the cases,which is opposite in sign tothe differences in B and -1 and B and -2. The maximumdecreases in the ratio are 1.5%,0.39%, and 0.24% atthe 0.2-,1.0-, and 5.8-cm−1 spectral resolutions,respectively.
 |
| Fig. 5. Relative differences between calculated off-line to on-line transmittance ratios using HITRAN 2004 and HITRAN2008 databases(HITRAN 2004–HITRAN 2008).(a)B and -1,(b)B and -2, and (c)B and -3. |
Figures 6a–6d show the relative changes in offlineto on-line transmittance ratio in B and -1 for increasesof 5,15,25, and 50 ppmv in CO2 columnmixing ratio. The results are presented for each ofthe different spectral resolutions using the HITRAN2008 database. The ratios for points far from the absorptionlines are almost unchanged by perturbationsin the CO2 mixing ratio. Changes in the ratios atpoints near the absorption lines are positive becausean increase in the amount of CO2 in the atmosphereacts to decrease atmospheric transmittance near theselines. When the spectral resolution is 0.2 cm−1,themaximum ratio changes are 2.24% for a 5-ppmv increasein CO2 column mixing ratio,6.81% for a 15-ppmv increase,11.56% for a 25-ppmv increase, and 24.15% for a 50-ppmv increase. When the spectralresolution is 1.0 cm−1,these maximum ratio changesare approximately 0.47%,1.41%,2.35%, and 4.72%,respectively. A comparison of Figs. 5 and 6 indicatesthat the updates to the HITRAN database have animpact on transmittance ratios in the narrow spectralregion 4855–4880 cm−1 that is roughly equivalent toa 50-ppmv CO2 increase. The effect in the spectralregion 4820–4850 cm−1 is equivalent to an increaseof more than 25 ppmv. In addition,the results indicatethat use of the HITRAN 2004 database in B and -1could result in underestimates of the CO2 amount.
 |
| Fig. 6. Response of simulated off-line to on-line transmittance ratio in B and -1 to increases in CO2 column mixing ratioof(a)5 ppmv,(b)15 ppmv,(c)25 ppmv, and (d)50 ppmv. |
The results presented in Fig. 7 reveal the effect ofCO2 increases on the off-line to on-line ratio in B and -2.When the spectral resolution is 0.2 cm−1,the maximumratio changes are 0.46% for a 5-ppmv increase inCO2 column mixing ratio,1.40% for a 15-ppmv increase,2.33% for a 25-ppmv increase, and 4.67% for a50-ppmv increase. When the spectral resolution is 1.0cm−1,the maximum ratio changes are approximately0.11%,0.32%,0.53%, and 1.06%,respectively. Whenthe spectral resolution is 5.8 cm−1,the maximum ratiochanges are approximately 0.07%,0.21%,0.35%, and 0.69%,respectively. A comparison of Figs. 5 and 7 indicates that the differences in the line parametersbetween the HITRAN 2004 and HITRAN 2008databases have an effect on the ratios in the narrowspectral region 6195–6225 cm−1 that is roughly equivalentto a 10-ppmv increase in CO2 column mixing ratio.The effect is equivalent to an increase of morethan 25 ppmv in the spectral region bounded by 6235 and 6255 cm−1. As with B and -1,use of the HITRAN2004 database would likely lead to an underestimateof the CO2 amount.
 |
| Fig. 7. As in Fig. 6,but for B and -2. |
Figure 8 presents the results of a similar analysisfor B and -3. When the spectral resolution is 0.2 cm−1,the maximum ratio changes are 0.47% for a 5-ppmvincrease,1.40% for a 15-ppmv increase,2.33% for a25-ppmv increase, and 4.67% for a 50-ppmv increase.When the spectral resolution is 1.0 cm−1,the maximumratio changes are approximately 0.09%,0.28%,0.47%, and 0.92%,respectively. When the spectralresolution is 5.8 cm−1,the maximum ratio changesare approximately 0.08%,0.23%,0.39%, and 0.77%,respectively. A comparison of Figs. 5 and 8 indicatesthat the differences in the line parameters between theHITRAN 2004 and HITRAN 2008 databases have aneffect on the ratios in the narrow spectral region 6325–6345 cm−1 that is roughly equivalent to a 25-ppmvdecrease in CO2. The effect in the spectral region6350–6375 cm−1 is equivalent to a change of less than10 ppmv. These results indicate that the amount ofCO2 may be overestimated when the HITRAN 2004database is used to perform retrievals in B and -3.
 |
| Fig. 8. As in Fig. 6,but for B and -3. |
The line parameters included in the latest editionof the HITRAN database have been modified since theprevious release in 2004. The HITRAN 2008 databaseprovides a complete replacement of the HITRAN 2004CO2 line parameters in the NIR region from 4300 to7000 cm−1. A series of sensitivity studies have beenperformed to evaluate the effects of these updates inthe HITRAN database on retrievals of atmosphericCO2 from near-infrared spectra.
Our comparisons of transmittance sensitivity toa change of 1 ppmv in CO2 mixing ratio using theHITRAN 2004 and HITRAN 2008 databases indicatemaximum relative differences of up to 54.6% at a spectralresolution of 0.2 cm−1. Use of the HITRAN 2004database in the 2.06- and 1.61-μm regions could resultin an overestimate of the transmittance sensitivity toatmospheric CO2 changes; use of the HITRAN 2004database in the 1.58-μm region could result in an underestimateof the transmittance sensitivity.
The updates to the HITRAN database have thelargest impact on transmittance and the off-line to onlinetransmittance ratio in the 2.06-μm spectral region and the smallest impact on these parameters in the1.58-μm spectral region. The influence of the updatesto the HITRAN database on the off-line to on-line ratiocalculation in the narrow spectral region 4855–4880cm−1 in B and -1 appears to be roughly equivalent to achange in CO2 of more than 50 ppmv. This influenceis approximately three times larger than that of cirrusclouds and bright maritime aerosols,both of whichare considered influential factors in the retrieval ofatmospheric CO2 using NIR reflected sunlight(Mao and Kawa, 2004). Using the HITRAN 2004 databasein B and -1 or B and -2 leads to an underestimate ofthe column CO2 abundance,whereas using the samedatabase in B and -3 leads to an overestimate of thecolumn CO2 abundance. These findings suggest thatinadequacies in the forward model could be a majorsource of error in measurements of CO2 from space.Additional studies are needed to properly evaluatethe impact of uncertainties in the forward radiativetransfer model on the accuracy of CO2 retrievals. Simulatedretrievals have been performed using optimalestimation theory to examine the effects of the updatesto the HITRAN database on retrievals of CO2vertical columns; the results have been reported inanother paper(Dai et al., 2012).
These results highlight that careful attentionmust be paid to changes in spectroscopic parametersto minimize systematic errors and improve theaccuracy of retrievals of atmospheric CO2 using NIRreflected sunlight.
Acknowledgments. We thank the relevant PIs and their staff for establishing and maintaining theHITRAN database used in this investigation. We alsoacknowledge the useful comments by two anonymousreviewers that helped to improve this paper.
| [1] | Aumann, H. H., D. Gregorich, and S. Gaiser, 2005: AIRS hyperspectral measurements for climate research: Carbon dioxide and nitrous oxide effects. Geophys. Res. Lett., 32, L05806, doi: 10.1029/2004GL021784. |
| [2] | Barkley, M. P., U. Frieß, and P. S. Monks, 2006a: Measuring atmospheric CO2 from space using Full Spectral Initiation (FSI)WFM-DOAS. Atmos. Chem. Phys., 6, 3517–3534. |
| [3] | —–, P. S. Monks, U. Frieß, et al., 2006b: Comparisons between SCIAMACHY atmospheric CO2 retrieved using (FSI) WFM-DOAS to ground based FTIR data and the TM3 chemistry transport model. Atmos. Chem. Phys., 6, 4483–4498. |
| [4] | —–, —–, and R. J. Engelen, 2006c: Comparison of SCIAMACHY and AIRS CO2 measurements over North America during the summer and autumn of 2003. Geophys. Res. Lett., 33, L20805, doi: 10.1029/2006GL026807. |
| [5] | —–, —–, A. J. Hewitt, et al., 2007: Assessing the near surface sensitivity of SCIAMACHY atmospheric CO2 retrieved using (FSI) WFM-DOAS. Atmos. Chem. Phys., 7, 3597–3619. |
| [6] | Bösch, H., G. C. Toon, B. Sen, et al., 2006: Space-based near-infrared CO2 measurements: Testing the Orbiting Carbon Observatory retrieval algorithm and validation concept using SCIAMACHY observations over Park Falls, Wisconsin. J. Geophys. Res., 111, D23302, doi: 10.1029/2006JD007080. |
| [7] | Buchwitz, M., R. de Beek, J. P. Burrows, et al., 2005a: Atmospheric methane and carbon dioxide from SCIAMACHY satellite data: Initial comparison with chemistry and transport models. Atmos. Chem. Phys., 5, 941–962. |
| [8] | —–, —–, S. Noël, et al., 2005b: Carbon monoxide, methane, and carbon dioxide retrieved from SCIAMACHY by WFM-DOAS: Year 2003 initial data set. Atmos. Chem. Phys., 5, 3313–3329. |
| [9] | —–, —–, —–, et al., 2006: Atmospheric carbon gases retrieved from SCIAMACHY by WFM-DOAS: version 0. 5 CO and CH4 and impact of calibration improvements on CO2 retrieval. Atmos. Chem. Phys., 6, 2727–2751. |
| [10] | —–, O. Schneising, J. P. Burrows, et al., 2007: First direct observation of the atmospheric CO2 year-toyear increase from space. Atmos. Chem. Phys., 7, 4249–4256. |
| [11] | Chédin , A., A. Hollingsworth, N. A. Scott, et al., 2002: Annual and seasonal variations of atmospheric CO2, N2O, and CO concentrations retrieved from NOAA/TOVS satellite observations. Geophys. Res. Lett., 29(8), 1269, doi: 10.1029/2001GL014082. |
| [12] | —–, R. Saunders, A. Hollingsworth, et al., 2003a: The feasibility of monitoring CO2 from high-resolution infrared sounders. J. Geophys. Res., 108(D2), 4064, doi: 10.1029/2001JD001443. |
| [13] | —–, S. Serrar, N. A. Scott, et al., 2003b: First global measurement of midtropospheric CO2 from NOAA polar satellites: Tropical zone. J. Geophys. Res., 108(D18), 4581, doi: 10.1029/2003JD003439. |
| [14] | Christi, M. J., and G. L. Stephens, 2004: Retrieving profiles of atmospheric CO2 in clear sky and in the presence of thin cloud using spectroscopy from the near and thermal infrared: A preliminary case study. J. Geophys. Res., 109, D04316, doi: 10.1029/2003JD004058. |
| [15] | Clough, S. A., M. J. Iacono, and J.-L Moncet, 1992: Line by line calculation of atmospheric fluxes and cooling rates: Application to water vapor. J. Geophys. Res., 97, 15761–15785. |
| [16] | —–, C. P. Rinsland, and P. D. Brown, 1995: Retrieval of tropospheric ozone from simulations of nadir spectral radiances as observed from space. J. Geophys. Res., 100(D8), 16579–16593. |
| [17] | —–, M. W. Shephard, E. J. Mlawer, et al., 2005: Atmospheric radiative transfer modeling: A summary of the AER codes. JQSRT, 91, 233–244. |
| [18] | Crisp, D., R. M. Atlas, F.-M. Br′con, et al., 2004: The Orbiting Carbon Observatory (OCO) mission. Adv. Space Res., 34, 700–709. |
| [19] | Dai Tie, Shi Guangyu, and Zhang Xingying, 2012: Effect of HITRAN database improvement on retrievals of atmospheric carbon dioxide from reflected sunlight spectra in the 1. 61-μm spectral window. Adv. Atmos. Sci., 29(2), 227–235, doi: 10.1007/s00376-011-0168-7. |
| [20] | Engelen, R. J., E. Andersson, F. Chevallier, et al., 2004: Estimating atmospheric CO2 from advanced infrared satellite radiances within an operational 4DVar data assimilation system: Methodology and first results. J. Geophys. Res., 109, D19309, doi: 10.1029/2004JD004777. |
| [21] | Feng, X., and F. S Zhao, 2009: Effect of changes of the HITRAN database on transmittance calculations in the near-infrared region. JQSRT, 110, 247–255. |
| [22] | —–, —–, and W. H. Gao, 2007: Effect of improvement of HITRAN database on radiative transfer calculation. JQSRT, 108, 308–318. |
| [23] | Forster, P., V. Ramaswamy, P. Artaxo, et al., 2007: Changes in atmospheric constituents and in radiative forcing. Climate Change 2007: The Physical Science Basis. S. Solomon, et al., Eds. Cambridge University Press, Cambridge. |
| [24] | Globalview-CO2, 2010: Cooperative Atmospheric Data Integration Project–Carbon Dioxide, available on internet via anonymous FTP to ftp. cmdl.noaa.gov/ccg/CO2/GLOBALVIEW. |
| [25] | Houweling, S., F.-M. Bréon, I. Aben, et al., 2004: Inverse modeling of CO2 sources and sinks using satellite data: A synthetic inter-comparison of measurement techniques and their performance as a function of space and time. Atmos. Chem. Phys., 4, 523–538. |
| [26] | —–, W. Hartmann, I. Aben, et al., 2005: Evidence of systematic errors in SCIAMACHY-observed CO2 due to aerosols. Atmos. Chem. Phys., 5, 3003–3013. |
| [27] | Kratz, D. P., 2008: The sensitivity of radiative transfer calculations to the changes in the HIRAN database from 1982 to 2004. JQSRT, 109, 1060–1080. |
| [28] | Mao, J., and S. R. Kawa, 2004: Sensitivity studies for space-based measurement of atmospheric total column carbon dioxide by reflected sunlight. Appl. Opt., 43, 914–927. |
| [29] | O’Brien, D. M., and P. J. Rayner , 2002: Global observations of the carbon budget 2. CO2 column from differential absorption of reflected sunlight in the 1.61 μm band of CO2. J. Geophys. Res., 107, 4354, doi:10.1029/2001JD000617. |
| [30] | Predoi-Cross, A., W. Liu, C. Hooladay, et al., 2007: Line profile study of transitions in the 30012←00012 and 30013←00001 bands of carbon dioxide perturbed by air. J. Mol. Spectrosc., 246, 98–112. |
| [31] | Rayner, P. J., and D. M. O’Brien, 2001: The utility of remotely sensed CO2 concentration data in surface inversions. Geophys. Res. Lett., 28, 175–178. |
| [32] | Rothman, L. S., D. Jacquemart, A. Barbe, et al., 2005: The HITRAN2004 molecular spectroscopic database. JQSRT, 96, 139–204. |
| [33] | —–, I. E. Gordon, A. Barbe, et al., 2009: The HITRAN2008 molecular spectroscopic database. JQSRT, 110, 533–572. |
| [34] | Schneising, O., M. Buchwitz, J. P. Burrows, et al., 2008: Three years of greenhouse gas column-averaged dry air mole fractions retrieved from satellite. Part I: Carbon dioxide. Atmos. Chem. Phys., 8, 3827–3853. |
| [35] | Stephens, B. B., K. R. Gurney, P. P. Tans, et al., 2007: Weak northern and strong tropical land carbon uptake form vertical profiles of atmospheric CO2. Science, 316, 1732–1735. |
| [36] | Strow, L. L., S. E. Hannon, S. De-Souza Machado, et al., 2006: Validation of the Atmospheric Infrared Sounder radiative transfer algorithm. J. Geophys. Res., 111, D09S06, doi: 10.1029/2005JD006146. |
| [37] | Tolton, B. T., and D. Plouffe, 2001: Sensitivity of radiometric measurements of the atmospheric CO2 column from space. Appl. Opt., 40, 1305–1313. |