 2012, Vol. 26
The Chinese Meteorological Society
Article Information
- SHEN Baizhu, LIU Shi, LIAN Yi, FENG Guolin, LI Shangfeng, and GONG Zhiqiang. 2012.
- The 2009 Summer Low Temperature in Northeast China and Its Association with Prophase Changes of the Air-Sea System
- J. Meteor. Res., 26(4): 438-453
- http://dx.doi.org/10.1007/s13351-012-0404-9
-
Article History
- Received October 12, 2011


2 Institute of Jilin Province Meteorological Science, Changchun 130062;
3 National Climate Center, Beijing 100081
Low temperature cold injury events frequently occur in summer during the crop growth period(MaySeptember)in Northeast China from the 1950s to1970s. Different from low temperature/freezing damage, low temperature/cold injury usually refers to cropinjury resulted from the low temperature above 0°C(sometimes even about 20°C)in its growth phase(Zhang, 1990; Wang, 1995). Low temperature/coldinjury events in the summers of 1969, 1971, 1972, 1976, and 1979 resulted in about 20% reduction ofthe annual total grain output of Jilin Province, especially the rice as high as 30%-50%(the General Office of the People's Government of Jilin Province, 2002). This has been attracted much attention bythe Chinese researchers, and some investigations havebeen performed since the end of the 1970s. It wasfound that the Northeast China summer low temperature(NESLT)events are correlated with the negative temperature anomaly in the mid-high latitudesof Northern Hemisphere(excluding the area north of60°N), and they exhibit planetary-scale characteristics(Jilin Provincial Observatory, 1980; Zhang et al., 1982, 1983). Temperature changes at Harbin in 1881-1983showed distinctive phases(Wang, 1995). During thecold phase of NESLT, the occurrence of El Niño addsa negative effect on the temperature, i.e., making itmuch lower than normal(Zhang, 1990). Occurrencesof cool or hot summer in Northeast China were closelyrelated to major large-scale circulation patterns in theNorthern Hemisphere(Northeast China Summer LowTemperature Collaboration Team, 1979; Jilin Provincial Meteorological Observatory, 1980). Typical caseanalysis by Fu(1980)concluded that when the snowcover in the Northern Hemisphere and the sea ice inthe Atlantic Ocean increase in pervious winter and spring, the summer temperature in Northeast Chinawould be lower than normal. Zhang et al.(1985) and Liu(1986)investigated the association betweenNESLT and monthly variations of polar vortex. Theydefined the area and intensity indices of polar vortex, which reflect the interaction between polar vortex and mid-latitude circulation, and found that the polar vortex area index in the domain from Asia to the centralPacific was negatively correlated with temperature inNortheast China and most areas of China and the polar vortex intensity index was also negatively correlated with temperature in Northeast China.
Chinese researchers have conducted many studies to reveal the prophase influential signals of theair-sea system related to summer climate in Northeast China. Much attention has been paid to atmospheric semi-permanent activity centers that beara barotropic structure with seasonal changes(Chou, 1986, 2007). Liu et al.(2002, 2003) and Lian et al.(2007)showed that there was a remarkable teleconnection between the oscillations of both the Aleutianlow and the North Pacific Oscillation(NPO)in thesubtropical region south of the Aleutian isl and s and the summer Northeast China Cold Vortex(NECV) and precipitation over eastern China. The intensityof summer NECV was positively correlated with theNorthern Hemisphere annular mode(NAM)in February(He et al., 2006). Some decadal characteristicsof NESLT events have been found(International CLIVAR Project Office, 1997): from the 1950s to 1970s, cool summers in Northeast China frequently occurredcorresponding to the El Niño events in this period;however, since the 1980s, the El Niño events were oftenaccompanied by warm or less cool summers(Wang and Wu, 1997; Lian and An, 1998; Lian et al., 2002 ①; An et al., 1998; Zheng and Ni, 1999; Sun and Wang, 2006).This indicates that interannual changes of NESLT areconstrained by the longer term(10 yr or more)climate changes(Ding et al., 2003; Ding, 2007). Howthe decadal variability of climate affects the interannual variability of NESLT needs further investigations.Some consistency between the interdecadal and interannual variations of rainy-season precipitation inNorth China has been reported(Lu, 2003).
① Lian et al., 2001: A re-evaluation of the impact of El Niño events on temperature in China. APN Summary Meeting, 49, Macau, 5-7 February 2002.Global climate has entered the warmest periodsince the 1990s(IPCC, 2007), and Northeast China isone of the regions that exhibit a remarkable regionalwarming in response to the global warming(National Assessment Report of Climate Change Editorial Committee, 2007). The frequency of cool summer has significantly reduced since the 1980s; in particular, nolarge-scale summer low temperature event happenedin Northeast China from 1994 to 2008(Chen et al., 2004; Yang et al., 2005). However, a significant summer low temperature event occurred in Jilin and Heilongjiang provinces in 2009. This raises a question: Isit an accidental event in the current warm phase or anearly signal for the bulk NESLT events similar to thoseduring the 1950s-1970s? At present, the conclusionof continuous global warming based on climate modelsimulations under the various IPCC SERS scenarioswas obtained without considering the impact of natural forcing(Zhao et al., 2005, 2008). As far as adaptation to the global warming is concerned, carrying outappropriate research on natural variability of temperature is helpful(Ye and Yan, 2008). Northeast Chinahas concentrated thermophilic rice farming in higherlatitudes such as Heilongjiang Province. If the climatein Northeast China enters a relatively cool phase, thiswould pose a major threat to the grain productionthere, as Northeast China is a major grain productionbase with annual total grain yield accounting for 1/6of China's total grain output. It is necessary to perform a case study on the summer low temperature in2009, and to promote the studies on the decadal variability of NESLTs.
This paper diagnoses the circulation characteristics during the summer low temperature event in 2009, aiming to reveal the relationship between early-stagechanges of the air-sea system and the summer low temperature, and the decadal background favorable forthe NESLTs. The present study also tries to identify planetary-scale stable atmospheric components, in addition to the synoptic-scale chaotic components(Chou, 1986, 1997; Feng et al., 2006; Ren and Xiang, 2010; Lin et al., 2010; Zhi et al., 2010). Based onmultiple spatial/temporal-scale analysis, causes of the2009 summer low temperature in Northeast China areto be revealed.2. Data and methods
The data used in this paper include daily temperature observations at Changchun Station from 1909 to2008 and at Harbin Station from 1881 to 2008, the reanalysis data of NCEP/NCAR from 1948 to 2009 and that of ECMWF from 1958 to 2002, and the SST dataof Hadley Center from 1881 to 2005. The temporalfiltering of long period(≥ 9 yr; decadal-scale component) and short period(< 9 yr; interannual-scalecomponent)was performed on the time series of theabove data, and the correlations between the interannual and interdecadal frequency spectra were thencomputed.
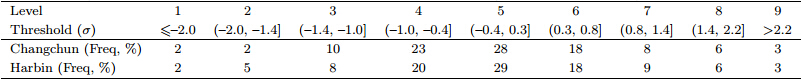
Based on the st and ard deviation(σ)of observedtemperature series for about 100 yr at Changchun and Harbin stations, an NESLT event is definedas follows: at any station in Northeast China, ifT 6-8 ≤ -1:0σ(subscript 6-8 denotes June-August, same below), a severe cool summer(A event)occurs; if-1.0σ < T6-8 ≤ -0:4σ, a cool summer(B event)occurs; if -0.4σ < T 6-8 ≤ -0:3σ, a normal summeroccurs; if 0.3σ < T 6-8 ≤ 0:8σ, a warm summer(Cevent)occurs; while T 6-8 > 0:8σ denotes a severewarm summer(D event).The temperature analysis by Lian and An(1998)showed that Changchun and Harbin stations can betaken as stations representative of the regional climateof Northeast China.
Table 1 shows that the frequencies of A events(levels 1-3) and B events(level 4)in summer were 14% and 23% at Changchun and 15% and 20% at Harbin, respectively. Therefore, A events occur less frequentlythan B events.
 |
Based on Table 1, four(three)years of 1969, 1971, 1972, and 1976(1954, 1957, and 1993)were chosenas the A(B)event years for Northeast China(represented by Changchun and Harbin) and seven(four)years of 1952, 1955, 1982, 1988, 1994, 1997, and 2000(1982, 1988, 1994, and 1997)as the typical summerhigh temperature years. Then, composite wind and temperature anomaly fields were plotted. The verticalvelocity was calculated by following Ding(1989).
In this paper, we adopted the definitions of NECV and NPO given in Liu et al.(2003), and we followed Liu(1986)for computation of relevant polar vortex indices and selection of the domain of the Pacific polarvortex.3. The 2009 NESLT case3.1 500-hPa height anomaly in summer 2009
Figure 1a shows the summer(JJA)average 500-hPa height anomaly field for 2009. It can be seenthat anomalous disturbances in the "two-trough-one-ridge" pattern appeared over Asia, i.e., there was astable negative disturbance south of 55°N in Northeast Asia with its center in coastal Russia, and a positive anomaly region(a persistent active area of blocking highs)from the Lake Baikal to the Okhotsk Sea.The two anomaly regions with opposite signs formeda stable dipole pattern over Northeast Asia(includingNortheast China), and sustained for two months. Thiswas also to certain extent related to the stable activities of the low vortices in the semi-permanent activecenter over the Aleutian Isl and s.
 |
| Fig. 1. Summer average 500-hPa geopotential height anomaly(gpm)patterns for(a)2009 and (b)1994-2008. Shadingsdenote areas with anomaly values less than -20. The contour interval is 4. |
Figure 1b displays summer average 500-hPaheight anomaly field during 1994-2008. The NorthernHemispheric general circulation anomalies in Fig. 1ahad signs almost opposite to those in Fig. 1b. In summer 2009, there was a strong positive anomaly over thepolar region(indicating that AO was in a significantnegative phase), and there were distinctive negativeanomalies over Northeast Asia, Aleutian Isl and s, and North Atlantic.3.2 Average temperature anomalies over China in summer 2009
Figure 2 shows summer average temperatureanomalies over China in 2009. It can be seen thata wide range of low temperatures happened in JilinProvince and the central-eastern part of HeilongjiangProvince, where negative temperature anomalies ranging from -0.5 to -1.0°C. Because the main body ofthe cold air mass resided in the eastern part of JilinProvince and the st and ard deviation of summer average temperature at Changchun was -0.49σ(<-0.4σ), the 2009 NESLT case reached the st and ard of a Bevent(cool summer).
 |
| Fig. 2. Summer average temperature anomaly(℃)in2009 over China. |
Table 2 shows the anomaly of NECV days in association with temperature deviations at Changchun and Harbin. The number of NECV days was morethan normal in 8 yr out of the 11 A and B event yearsat Harbin and Changchun(the summer temperatureof 2009 did not meet the threshold of A or B event atHarbin), normal in 1 yr, and slightly less in 2 yr(1976 and 1979). Even in 1976 and 1979, the NECV days forJune only were also slightly more than normal(tableomitted). In the 5 typical summer high temperatureyears of 1982, 1988, 1994, 1997, and 2000, the NECVdays were 10-15 days less than normal(table omitted).Therefore, it is inferred that the positive anomaly ofNECV days is correlated with NESLT, and vice versa, and the NECV is the system that directly influencesthe NESLT.
 |
Figures 3a and 3b show the summer 500-hPaheight anomaly composites over 7 A events and summer high temperature years of Northeast China, respectively. It is seen that over the Asian mid-high latitudes, Aleutian Isl and s, and the northwest of NorthAmerica, there were two hemispheric-scale wide-rangenegative and positive anomaly b and s, with two lowvalue centers over Northeast China and the AleutianIsl and s, respectively. In the NESLT years, there weretwo summer low value activity centers in the NorthernHemisphere, one of them is the NECV center, wherethe active NECVs directly result in NESLT events.It is inferred that summer surface temperature overNorth Pacific under the active center of the Aleutianlow might also be lower(Fig. 3a).
 |
| Fig. 3. Summer 500-hPa height anomaly(gpm)composites over(a)A event years and (b)typical summer hightemperature years of Northeast China. Shadings illustrate the value of anomaly less than -20; contour interval is 4. |
Figure 4 exhibits spatial distributions of the correlation coefficients of the summer average temperatureat Changchun and Harbin with Northern Hemisphericsummer 500-hPa heights. It can be seen that the highcorrelation belt with values ≥ 0.3(significant at the0.05 confidence level)spreads zonally from central Asiato central North Pacific, with two large value centersover Northeast China and the Aleutian Isl and s, respectively. The maximum correlation value was over0.7(significant at the 0.01 confidence level)over thefirst center. The correlation coe°cient pattern overAsia and North Pacific(Fig. 4a)is similar to the500-hPa height anomaly pattern over the same region(Fig. 3a), indicating that the summer temperature was positively correlated with the 500-hPa heightanomaly in Northeast China, that is to say, the NESLTcorresponded to the negative summer 500-hPa heightanomalies in Northeast China, and vice versa.
 |
| Fig. 4. Simultaneous dependence patterns of the summer temperature of(a)Changchun and (b)Harbin with NorthHemispheric 500-hPa geopotential height. The significant correlations at the 0.05 confidence level are shaded; contourinterval is 0.1. |
Figures 5a and 5b are the cross-sections of vertical and meridional winds and temperature anomaly for Aevent years and high temperature years of NortheastChina along 120°E, respectively. It is seen from Fig. 5a that the southward air flow from the polar regionof Northern Hemisphere met the northward flow originated from the equatorial region over 50°-52°N, thenascended, and obviously converged in the mid-uppertroposphere of 600-200 hPa. Correspondingly, a thickcold air layer at 850-250 hPa with a core cold air layerat 500-400 hPa, where the negative anomaly centerwas -1.5°C, controlled the whole Northeast China, and above the thick cold air layer was a warm tropopausewith a warm core of +0.9°C at 150 hPa. However, in the summer high temperature years(Fig. 5b), thepolar cold air could reach the vicinity of 75°N onlyat the tropopause, but the warm air originated fromthe equatorial region could advance northward withinthe planetary layer to the north of 50°N, indicatingthat the warm air at low levels was very strong. Over40°-50°N, there was a warm core of 1.5°C, with itswarm tongue extending upward to the mid-upper troposphere, and the relevant flow also ascended and advanced towards the vicinity of the polar region. Theabove reveals that the cold core of NESLT lay in thevicinity of 500 hPa in the middle troposphere, so weexamine the evolution of 500-hPa circulation systemsfor the diagnosis and prediction of the NESLT events.
 |
| Fig. 5. Composite latitude-height cross-sections of wind and temperature anomaly(°C)over(a)A event years(1969, 1971, 1972, and 1976) and (b)typical summer high temperature years(1982, 1988, 1994, and 1997)of Northeast Chinaalong 120°E. Thick solid line with arrows denotes streamline of vertical and meridional winds; thin solid line withcolor shaded area denotes positive temperature anomalies; thin dashed line with color shaded area denotes negativetemperature anomalies. The multi-year mean was calculated for 1958-1997. |
Summer average temperature anomaly series atChangchun(Fig. 6a) and Harbin(Fig. 6b)clearlyshow that the temperature has exhibited a rising trendsince the 1920s, and no obvious negative anomaly hasoccurred since 1994. However, in the summer of 2009, negative anomalies of -0.34 and -0.24°C occurred atChangchun and Harbin stations, respectively.
 |
| Fig. 6.(a, b)Summer average temperature anomaly series(thin solid line: temperature anomaly; thick solid line:linear trend) and (c, d)their interdecadal variations at(a, c)Changchun and (b, d)Harbin, respectively. |
Analysis of the decadal component(≥ 9 yr)ofsummer average temperature anomaly series(Figs. 6c and 6d)shows that the summer temperature of Harbinvaries with an about 80-yr dominant period, e.g., acold phase in 1881-1913, a warm phase in 1914-1954, a cold phase again in 1955-1992, and a warm phasein 1992-2008(Fig. 6d). The dominant period forthe summer temperature of Changchun is about 70 yr(Fig. 6c), e.g., a cold phase before 1918, a warm phasein 1919-1953, a cold phase again in 1954-1991, and awarm phase in 1991-2008. Most of the cold and warmphases of the two series corresponded and overlapped.Especially, in the late 20th century to the early 21thcentury, after the positive temperature anomaly hasreached the peak value among the 100-yr temperature observations, the temperature series at the twostations both underwent a declining phase, with a declining rate of about 0.7-0.8°C(10 yr)-1, that evenexceeded the linear warming rate of 0.2°C(10 yr)-1during 1961-2000(Yan, 2007).
Power spectrum analysis of the of summer average temperature series of Changchun(Fig. 7a) and Harbin stations(Fig. 7b)indicates that the temperature series of Changchun has 66- and 33-yr periodssignificant at the 0.05 confidence level(Fig. 7a); whilethe temperature series of Harbin has 82-, 3-, and 2.3-yr significant periods(Fig. 7b). This further confirmsthat the cold and warm phase alteration of about 30-40-yr is significant at the 0.05 confidence level.
 |
| Fig. 7. Power spectra of observed yearly summer temperatures at(a)Changchun and (b)Harbin. Solid line: powerspectrum value; dotted line: threshold line for α ≥ 0.05 level of significance. |
The time series of North Pacific Polar Vortex(NPPV)area index for previous winter(relative tothe summer of the indicated year; Fig. 8a)shows thatafter a period of rapid rising(1958-1963), the areaindex is low(1964-1992), and its variation is similarto that of the Changchun summer average temperature(1959-1992)(Fig. 6c). The NPPV area index forspring(Fig. 8b)is basically similar to that for previous winter(Fig. 8a), but no second peak appears after1988, thereby indicating that the NPPV area index hasstrong persistence from the previous winter to spring.This persistent anomaly on the half-year scale mightprovide a precursor signal for short-term prediction ofthe anomalous East Asian summer climate.
 |
| Fig. 8. Decadal variations of NPPV area indices for(a)previous winter and (b)spring. |
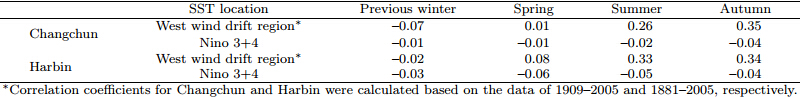
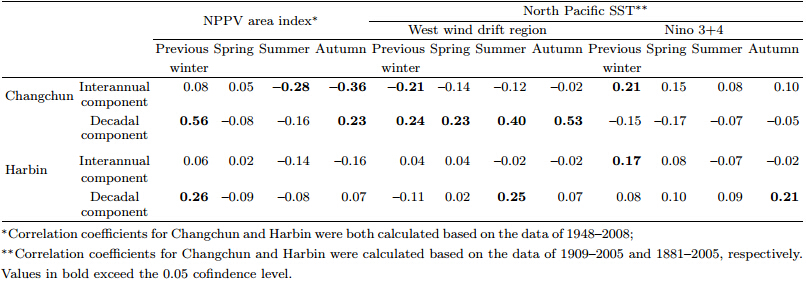
Table 3 shows that the correlations between summer average temperatures of Changchun and Harbin and the previous winter and spring SSTs of the westwind drift region and Nino 3+4 region did not passtheir significance tests of the 0.05 confidence level, butthose for summer and autumn SSTs(simultaneous orlagging)were significant at the 0.05 confidence level.After decomposing the summer average temperaturetime series of the two stations into interannual and decadal component series, it is found that the decadalcomponents of Changchun and Harbin summer temperatures are positively correlated with the previouswinter NPPV area index at the 0.01 and 0.05 confidence level, respectively(Table 4); and that the interannual component of Changchun summer temperature is negatively correlated with the summer and autumn NPPV area indices, as well as previous winter SST of the west wind drift region, significant atthe 0.05 confidence level. It is also known from Table 4 that the decadal component of Changchun summertemperature is positively correlated with those of allfour season SSTs in the west wind drift region and those of the previous winter SST in the Nino 3+4 region, at the 0.05 confidence level; and the interdecadalcomponent of Harbin summer temperature is also significantly correlated with that of the summer SST inthe west wind drift region at the 0.05 confidence level.This indicates that the previous winter NPPV area index provides an important precursor signal for changesin both Changchun and Harbin summer temperatureson decadal scale; and changes in the previous winterSST in the west wind drift region are also importantprophase signals for summer temperature changes atChangchun Station, and changes in the SST of Nino3+4 region in previous winter also to some extent affect Changchun summer temperature. Besides, theSST anomaly over east-central equatorial Pacific inwinter 2008 presented a La Niña pattern, which obviously weakened in the spring of 2009(figure omitted).
 |
 |
Figures 9a and 9b give the homogeneous correlation maps of the SVD1 of the previous winter 500-hPa geopotential height field in the NPO region and the summer average temperature field of 80 stationsin Northeast China, respectively. The two maps bothshow an approximately south-north "+ -" phase distribution of correlation wavetrain; wherein a negative correlation region lies around the Aleutian Isl and swith its center value ≤ -0.8 in the north of the isl and s, and a positive correlation center with its value ≥ 0.6lies in the eastern Pacific near 65°N(Fig. 9a). Correspondingly, the summer temperature showed consistent positive values over Northeast China, with correlation coefficients mostly from 0.7 to 0.9(Fig. 9b);the half-year scale teleconnection of the two fields issignificant at the 0.01 confidence level, and the contribution of SVD1 accounts for 75%(a very high weight)of the total sum of squared covariances.
 |
| Fig. 9. Simultaneous correlation maps of the SVD1 of(a)the 500-hPa geopotential height field of the NPO region(25°-70°N, 140°E-150°W)in previous winter and (b)the summer average temperature field of 80 stations in NortheastChina. |
The homogeneous correlation maps of the SVD2(Figs. 10a and 10b)show a pattern opposite to that ofthe SVD1(Figs. 9a and 9b). That is to say, over theAleutian Isl and s and the Kamchatka Peninsula area, there is a large positive correlation region with its center values above 0.8; and over the smaller area south of45°N, there is a negative correlation zone with its center value ≤-0.8(Fig. 10a). Correspondingly, Northeast China is dominated mostly by negative correlations, especially over Jilin and Heilongjiang provinces, and the correlation coefficients range from -0.25 to-0.50 with most of them passing the 0.05 confidencelevel(Fig. 10b). The correlation flow for the SVD2 isthe same as the SVD1, i.e., if there is a north-south"+ -"(or "- +")phase distribution in the NPO region in the previous winter, the summer temperaturein Northeast China will be lower(or higher). Thevariance contribution of the SVD2 accounts for 12%of the total covariance, and the contributions of theSVD1 and SVD2 account for 87% of the total covariance, which su°ciently indicates that the NPO phasedistribution in previous winter is an important and strong precursor signal for the summer temperatureof Northeast China. The anomalous phase of NPOmight be a planetary-scale stable component that canbe extracted from the atmospheric general circulation.
 |
| Fig. 10. As in Fig. 9, but for SVD2. |
It can be seen from Figs. 11a and 11d that the500-hPa height anomaly patterns of the previous winters of 1972 and 2009 are very similar, i.e., theNorthern Hemispheric 500-hPa circulation basicallyshowed a two-wave disturbance distribution, with thestrongest positive anomaly center both over the seasouth of the Aleutian Isl and s, and in the NPO regionwhere there appeared a typical negative phase of thenorth-south "+ -" anomaly distribution of NPO. Thepositive anomaly center with its center value being 140gpm in 2009 is slightly stronger than its counterpartin 1972, but the two-wave disturbance pattern in 1972is clearer than that in 2009. Furthermore, there appeared also a stronger negative phase of North AtlanticOscillation(NAO)over the Atlantic Ocean, relative tothat in 1972.
 |
| Fig. 11. 500-hPa geopotential height anomaly fields(gpm)in previous winter of(a)1972 and (d)2009, spring of(b)1972 and (e)2009, and (c)summer of 1972. Solid(dashed)line denotes positive(negative)anomaly; contour interval is20; shadings indicate values less than or equal to -20. |
Figures 11b and 11e show that the spring 500-hPaheight anomaly patterns of 1972 and 2009 are also verysimilar: the negative phase disturbances of NPO stillmaintained over the mid-high latitudes of North Pacific, except that the positive anomaly center over thesea south of the Aleutian Isl and s was obviously weakened relative to that in the previous winter, but it wasstill the strongest spring disturbance center over theNorthern Hemisphere. Therefore, the negative phasesof NPO in the previous winter and spring of 1972 and 2009 were very strong and sustained for a halfyear, which must have impacted the summer Northern Hemispheric 500-hPa circulation. In summer 1972, A event occurred in Northeast China(Table 2)withstronger negative temperature anomalies(Fig. 11c), but in summer 2009, the negative 500-hPa heightanomaly center moved to the coastal region of Russia, east of its normal position(Fig. 2a), and the NESLTmainly happened in the central-eastern parts of Jilin and Heilongjiang provinces. The persistent negativephase of NPO over the previous winter and springof 1972 and 2009 both resulted in the occurrence ofNESLT events, again indicating that the anomalousphase of NPO is a stable planetary-scale signal worthy of notice.6.3 Harmonic analysis of the preceding 500-hPa height field for anomalous NECV activities
Figure 12 shows the ultra-long wave disturbancedistribution of 500-hPa height along 45°N duringApril-May 2009. The ultra-long wave(wavenumbers1-3)trough always stayed over 120°-180°E especiallythe North Pacific region. It obviously shifted eastwardonly in early May and then distinctively retreatedwestward again in mid May. This is a typical precursor for anomalously strong activities of summer NECV(Shen et al., 2008), indicating the transformation ofthe North Pacific ultra-long wave disturbance troughalong 45° N into a stationary wave disturbance trough, which is obviously related to the persistent northsouth "+ -" anomaly wavetrain of the negative phaseof NPO over the North Pacific region in spring, and isthe major character of prophase circulation evolutionor a precursor for the anomalous June NECV activitiesof 2009. The NECV days in June-July 2009 were 18days more than normal, accounting for a percentageanomaly of 54%.
 |
| Fig. 12. Time-longitude cross-section showing the ultralong wave disturbances of the 500-hPa geopotential height(gpm)along 45°N. Solid(dashed)line denotes positive(negative)value. |
A summer low temperature event occurred in thecentral-northern part of Northeast China in 2009. Thetemperature anomaly at Changchun Station reached-0.49σ, characterizing a B event according to theNESLT classification given in this paper.
It is found that a strong NECV directly resultedin the NESLT in central-eastern Northeast Chinain summer 2009. Summer average temperatures ofHarbin and Changchun were significantly correlatedwith concurrent 500-hPa height over Northeast China, with correlation coefficients of more than 0.7, significant at the 0.01 confidence level. Composite analysis reveals that the meridional circulation for typicalNESLT years is featured with a deep cold air layerbetween 850 and 250 hPa over the whole NortheastChina. The horizontal and vertical circulation reflect anomalously strong NECV activities directly responsible for NESLT events. During June-July 2009, 18 more NECV days appeared, accounting for a percentage anomaly of 54%; and the negative 500-hPaheight anomaly directly resulted in the NESLT overthe coastal region of Russia, east of its normal position.
The decadal components(≥ 9 yr)of observed 100-yr summer average temperature series at Harbin and Changchun exhibited a distinctive declining trend inthe past decade, which provides an important decadalbackground for the NESLT of Jilin and Heilongjiangprovinces in 2009. The power spectrum analyses of thetemperature series of the two stations uncover that theseries had a significant 30-40-yr cold/warm phase alteration and showed a remarkable declining trend inthe period from the end of the 20th century to thebeginning of the 21st century, with the declining rateof 0.8°C(10 yr)-1 over 1999-2008, far greater thanthe linear warm rate of 0.2°C(10 yr)-1 of NortheastChina in response to the global warming over 1961-2000. The summer circulation anomaly over the midhigh latitudes of Northern Hemisphere in 2009 is almost opposite in sign(positive/negative)to that in1994-2008 when no NESLT event happened. Meanwhile, in 2009, significant negative phase of AO and negative height anomalies over Northeast Asia, Aleutian Isl and s, and the North Atlantic occurred.
The decadal variation of previous winter NPPVactivities is an important background condition forsummer temperature change in Northeast China. Theprevious winter NPPV area index, which was significantly positively correlated with the summer temperatures of Changchun and Harbin, also showed a decadaldeclining trend. It is also known that the SST in thewest wind drift region of North Pacific also affects thesummer temperature in Northeast China, with its effect next secondary to that of the NPPV, and the SSTin the east-central tropical Pacific has some impact aswell.
The phase of NPO is an important precursorfor summer temperature changes in Northeast China.This is also a planetary-scale stable atmospheric component in addition to the synoptic-scale chaotic component. The SVD1 and SVD2 of previous winter 500hPa height fields in the NPO region and summer temperature fields at the 80 stations of Northeast Chinaboth reveal that the positive/negative phase of NPOwas significantly correlated with the positive/negativeanomaly of summer temperatures, with the covariancecontributions of the SVD1 and SVD2 to the total covariance reaching 87%. In the previous winter of 2009, the negative phase of NPO was the strongest since themid 1980s and it sustained into the spring of 2009.The evolution of NPO was very similar to that in1972, when a severe NESLT event occurred in Northeast China. Therefore, occurrence of the 2009 NESLTevent may hint that summer temperature in NortheastChina might have entered a low temperature phasesimilar to that in the 1970s.
Harmonic analysis of April-May 500-hPa heightalong 45°N over North Pacific suggests that the ultralong wave activities appearing as a form of stationarydisturbances serve as a precursor for the anomalouslystrong activities of NECV in June-July 2009. Theultra-long wave disturbance trough over North Pacificwas a stationary wave disturbance, which was relatedto the persistent negative phase of the north-south "+-" anomaly wavetrain of NPO, and formed a prophasemid-high latitude circulation background in favor ofthe June-July unusually active NECVs of 2009.
This paper analyzed the decadal variation of the100-yr temperature observations at Changchun and Harbin stations and the NPPV activities. The resultsshowed a declining trend of summer temperature inthe recent decade. On the annual and seasonal scale, the previous winter and spring precursor signals of theair-sea system over North Pacific favorable for the occurrence of NESLT and NECV are identified. On theintraseasonal and monthly scale, the lower frequencysignal of June-July 500-hPa height in favor of NECVis uncovered by the power spectrum analysis. In earlyJune 2009, we used the above data and methods, withreference to the 10-16-day 500-hPa height forecast(in which abnormally more frequent NECV activitieswere found), issued a summer low temperature warning. This is a successful effort on the prediction ofNESLT.
Overall, this paper investigated the large-scalecirculation features of the 2009 NESLT event. Meanwhile, composite analysis was performed to identifythe decadal background favorable for the occurrenceof NESLT, the relationships between NESLT/NECVactivity and prophase changes in the air-sea systemover the North Pacific region, and how to predict theNESLT event of 2009 using multi-spatiotemporal scalepredictors. However, the physical mechanism of theNESLT and the sea-air system association is not clear.Is the NESLT event of 2009 only an isolated case, oran early warning signal for a new phase of massive occurrences of such events? Further studies are neededto address those issues.
Acknowledgments. The authors would like tothank Prof. Ding Yihui for his valuable advice; thanksalso go to the two anonymous reviewers for their valuable comments. Contributions from Gao Zongting, Chen Changsheng, Guo Chunming, Su lixin, Tu Gang, Sui Bo et al. of the Institute of Meteorological Science of Jilin Province were also appreciated.
| [1] | An Gang, Lian Yi, and Wang Qi, 1998: The wavelet analysis of temperature variations of crop growth period. Acta Meteor. Sinica, 56, 458-464. (in Chinese) |
| [2] | Chen Longxun, Zhou Xiuji, and Li Weiliang, 2004: Characters of the climate changes and its formation mechanism in China in last 80 years. Acta Meteor. Sinica, 62, 634-646. (in Chinese) |
| [3] | Chou Jifan, 1986: Long Range Numerical Weather Forecast. China Meteorological Press, Beijing, 329 pp. (in Chinese) |
| [4] | --, 1997: Advances in non-linearity and complexity in atmospheric sciences. Bull. Chinese Acad. Sci., 5, 325-329. (in Chinese) |
| [5] | --, 2007: An innovation road to numerical weather prediction: From the initial value problem to the inverse problem. Acta Meteor. Sinica, 65, 673-682. (in Chinese) |
| [6] | Ding Yihui, 1989: Diagnosis of Weather Dynamics. Science Press, Beijing, 292 pp. (in Chinese) |
| [7] | --, 2007: Preamble. Chinese Geogr. Sci., 27 (Suppl), 1. (in Chinese) |
| [8] | --, et al., 2003: Evolution of Climate System and Its Prediction. China Meteorological Press, Beijing, 137 pp. (in Chinese) |
| [9] | Feng Guolin, Dong Wenjie, Gong Zhiqiang, et al., 2006: Nonlinear Spatiotemporal Distribution Theory and Methods of Observations. China Meteorological Press, Beijing, 227 pp. (in Chinese) |
| [10] | Fu Congbin, 1980: Relationships between the Northern Hemispheric winter and spring snow area and summer temperature in Northeast China. Acta Meteor. Sinica, 38, 167-192. (in Chinese) |
| [11] | He Jinhai, Wu Zhiwei, and Qi Li, 2006: Relationships of Northern Hemispheric annual mode and Northeast China cold vortex with summer precipitation in East Asia and China. Meteor. Environ. J., 22, 1-5. (in Chinese) |
| [12] | International CLIVAR Project Office, 1997: A Research Programme on Climate Variability and Prediction for the 21st Century. CLIVAR, World Climate Research Programme. Bundsstr: Max-Plank-Institute fÄur Meteorologie, 48 pp. |
| [13] | IPCC, 2007: Summary for Policymakers of the Synthesis Report of the IPCC Fourth Assessment Report. Cambridge University Press, Cambridge, UK, 996 pp. |
| [14] | Jilin Province Meteorological Observatory, 1980: Analysis of the long-term weather processes causing summer (May-September) continuous low temperature. Sci. Atmos. Sinica, 4, 54-67. (in Chinese) |
| [15] | Lian Yi and An Gang, 1998: The relationship among East Asian summer monsoon, El Niño and low temperature in Songliao Plain in Northeast China. Acta Meteor. Sinica, 56, 724-735. (in Chinese) |
| [16] | --, Gao Zongting, Shen Baizhu, et al., 2007: Climate change and its impacts on grain production in Jilin Province. Adv. Climate Change Res., 3, 46-49. (in Chinese) |
| [17] | Lin Meijing, Fan Ke, and Wang Huijun, 2010: An investigation into the climatic characteristics of vertical shear of zonal wind in the western North Pacific. Acta Atmospherica Sinica, 68(3), 309-314. (in Chinese) |
| [18] | Liu Zongxiu, 1986: Northern Hemispheric polar vortex strength index and its relation with temperature changes in China. Meteor. Mon., 12 (Suppl. II), 84-89. |
| [19] | --, Lian Yi, Gao Zongting, Sun Li, and Shen Bai, 2002: Analyses of the Northern Hemisphere circulation characters during northeast cold vortex persistence. Chinese J. Atmos. Sci., 26(3), 361-372. |
| [20] | --, Lian Yi, Shen Baizhu, et al., 2003: Seasonal variation features of 500-hPa height in the North Pacific Oscillation region and its effect on precipitation in Northeast China. Chinese J. Appl. Meteor., 14, 553-561. (in Chinese) |
| [21] | Lu Riyu, 2003: Linear relation between interdecadal and interannual changes in summer rainfall in North China. Chinese Sci. Bull., 48, 718-722. (in Chinese) |
| [22] | National Assessment Report of Climate Change Editorial Committee, 2007: China's Climate Change Assessment Report. Science Press, Beijing, 422 pp. (in Chinese) |
| [23] | Northeast China Summer Low Temperature Research Collaboration Team, 1979: A preliminary research on cool/hot summer in the Northeast China region. Acta Atmospherica Sinica, 37(3), 44-58. |
| [24] | Ren Rongcai and Xiang Chunyi, 2010: Temporal and spatial connections of the stratospheric polar vortex oscillation to the ENSO tropical SST anomalies. Acta Atmospherica Sinica, 68(3), 285-295. (in Chinese) |
| [25] | Shen Baizhu, Li Shangfeng, and Lian Yi, 2008: The harmonic analysis of cold vortex of Northeast China in early summer. J. Jilin Univ. (Earth Science), 38(Suppl.), 204-208. (in Chinese) |
| [26] | Sun Jianqi and Wang Huijun, 2006: Regional differences of summer air temperature anomalies in Northeast China and its relationship to atmospheric general circulation and sea surface temperatures. Acta Geophysica Sinica, 49, 662-671. (in Chinese) |
| [27] | The General Office of the People's Government of Jilin Province, 2002: Jilin Yearbook. Jilin Yearbook Press, Changchun, 240 pp. (in Chinese) |
| [28] | Wang Jingfang and Wu Guoxiong, 1997: Evolution and characteristic of the persistent cold summer in Northeast China. Chinese J. Atmos. Sci., 21(5), 523-532. (in Chinese) |
| [29] | Wang Shuyu, 1995: Studies on Crops Cool Injury. China Meteorological Press, Beijing, 246 pp. (in Chinese) |
| [30] | Yan Minhua, 2007: Instrumental Climate Change in Northeast China and Its Regional Differences. Science Press, Beijing, 37-38. (in Chinese) |
| [31] | Yang Qing, Lian Yi, and He Jinhai, 2005: Prediction of summer temperature with SVD in Northeast China. Meteor. Mon., 31, 31-35. (in Chinese) |
| [32] | Ye Duzheng and Yan Zhongwei, 2008: On orderly adaptation to global warming. Acta Meteor. Sinica, 66, 855-856. (in Chinese) |
| [33] | Zhang Mingli, Fu Congbin, Wang Mingru, et al., 1982: A study of global surface temperature field in the 1970s. Part I: The characteristics of global temperature and summer cold disaster in the Northeast China in the 1970s. Scienita Atmospherica Sinica, 6(3), 229-235. (in Chinese) |
| [34] | --, --, --, et al., 1983: A preliminary research on global surface temperature in the 1970s (III). Scienita Atmospherica Sinica, 3(1), 23-31. (in Chinese) |
| [35] | Zhang Shaoqing, 1990: Relationships between Northeast China summer low temperature and El Niño events, in Blue Book of Science and Technology. No.5Climates/National Science and Technology Committee. Science and Technology Literature Press, Beijing, 367 pp. (in Chinese) |
| [36] | --, Yu Tongjiang, Li Fangyou, et al., 1985: Seasonal changes in Northern Hemispheric polar vortex area and intensity and their association with temperature in Northeast China. Scienitia Atmospherica Sinica, 9, 178-185. |
| [37] | Zhao Zongci, Wang Shaowu, Xu Ying, et al., 2005: Attribution of the 20th century climate warming in China. Climate Environ. Res., 10, 808-817. |
| [38] | --, Luo Yong, and Jiang Ying, 2008: Challenge on Prediction of East Asian Winter Monsoon as a Global Warming. ISSCCE, Changchun, China, 66 pp. |
| [39] | Zheng Wei zhong and Ni Yunqi, 1999: Diagnostic study on the impact of sea surface teauperature anomalies over tropical and mid-latitude Pacific on summer low temperature/cool damage in Northeast China. Quart. J. Appl. Meteor., 12, 394-401. (in Chinese) |
| [40] | Zhi Rong, Feng Guolin, Zhou Lei, et al., 2010: Temporal and spatial correlation analysis of global temperature data based on the correlation matrix theory. Acta Mereor. Sinica, 24(2), 150-162. |