The Chinese Meteorological Society
Article Information
- ZHANG Ying and SUN Jianqi. 2012.
- Model Projections of Precipitation Minus Evaporation in China
- J. Meteor. Res., 26(3): 376–388
- http://dx.doi.org/10.1007/s13351-012-0309-7
-
Article History
- Received November 1, 2011
- in final form March 15, 2012
2 Climate Change Research Center (CCRC), Chinese Academy of Sciences, Beijing 100029
Water resource is of vital importance to humanlife, agriculture, and industry. Nowadays, with thegrowth of population and development of economies, water crisis is becoming a considerable threat to security and sustainable development all over the world.The total water resource of China ranks the 6th in theworld, but the water resource per capita is only 25%of the world average, which results in remarkable vulnerabilityof China to changes of its water resources(Wang et al., 2008; Piao et al., 2010). Therefore, itis of great significance to investigate the possible impactsof climate change on water resources.
In the past several decades, many researchers investigatedthe temporal and spatial features of thedry-wet conditions and water resource distributions inChina from the observational perspective, in particularfor northern China under the arid and semi-aridclimate, and it is concluded that the water resourceconditions changed significantly over the past half century(Wei et al., 1999; Zhang, 1999; Shi et al., 2003;Wei et al., 2003; Li et al., 2004; Ma, 2005; Su and Wang, 2007a, b; Jiang et al., 2009a; Wang et al., 2007;Wang, 2010).
Precipitation is the most important contributorto water resources. In China, it is claimed that, duringthe recent decades, the annual mean precipitationincreases in Southwest, Northwest, East China, and the Qinghai-Tibetan Plateau, and decreases in centralNorth and Northeast China. The pattern of precipitationwas also documented to be going through decadalchanges(Wang, 2001, 2002; Liu et al., 2005; Wang and Zhou, 2005; Xu et al., 2008; Zhu et al., 2011; Wang et al., 2012; Sun et al., 2011). The changes of precipitationgenerally result in altered patterns of water resourcesin China. For instance, the increasing rainfallover the Yangtze River valley and decreased rainfall incentral North China led to the so-called “south floods and north droughts”(Ding and Sun, 2003).
Besides precipitation, evaporation is another importantfactor to influence water resources. High temperature and strong wind can enhance the evaporation, which consequently reduces the water resource.Synthetically considering the combined roles of precipitation and evaporation in hydroclimate conditions, the precipitation minus evaporation(P–E; effectiveprecipitation)is generally used as an informative indicatorof water resource conditions. Analysis has beenperformed to investigate the temporal and spatial variationsof P–E in northern China. Generally, P–E isthe largest in summer but smallest in winter. Areasin southeast of central North China are with largerP–E, and it decreases northwestward. P–E also exhibitsinterannual and interdecadal variations, with asignificant decrease after the late 1970s and a slightincrease in the mid 1990s(Yang and Song, 1999; Song et al., 1999; Zhou and Huang, 2006; Sun et al., 2009a, b, 2010).
Climate system has been going through detectablechanges under global warming, which resultsin changes in water resource conditions. Lots of existingstudies about the impact of climate change onwater resources only considered the contribution ofprecipitation. It has been claimed that precipitationover most areas of China would increase. To estimatethe water resource conditions for a certain region, itis more reasonable to explore the hydrologic balanceincluding both the income and consumption of waterfrom the surface. Moreover, more precipitation is notalways resulting in a better water resource conditionif the amplitude of increase in evaporation is largerthan that in precipitation. To obtain a comprehensiveprospect of water resource conditions, the combinedroles of precipitation and evaporation are consideredto investigate the possible impacts of climatechange on water resource conditions in China in thisstudy.2. Data and method
All the model data are from the World ClimateResearch Programme(WCRP)Coupled Model IntercomparisonProject phase 3(CMIP3)multi-modeldataset(Meehl et al., 2007a). The simulation of20C3M(Climate of 20th Century experiment; Hegerl et al., 2003)is employed as baseline condition; and simulation of IPCC Special Report on Emissions Scenarios(SRES)A1B experiment is employed as thefuture climate, in which the emissions of greenhousegas are based on scenario A1B(Nakicenovic et al., 2000). Based on availability of the model ouputsfrom the WCRP CMIP3 multi-model database, simulationsof 22 GCMs are used in this study. They areBCCR-BCM2.0, CGCM3.1(T47), CGCM3.1(T63), CNRM-CM3, CSIRO-Mk3.0, CSIRO-Mk3.5, GFDLCM2.0, GISS-AOM, GISS-EH, FGOALS-g1.0, INGVSXG, INM-CM3.0, IPSL-CM4, MIROC3.2(hires), MIROC3.2(medres), ECHO-G, ECHAM5/MPI-OM, MRI-CGCM2.3.2, CCSM3, PCM, UKMO-HadCM3, and UKMO-HadGEM1. More information of theseGCMs can be found at http://www-pcmdi.llnl.gov/ipcc/model−documentation/ipcc−model−documentation.php.
The multi-model ensemble approach is used toestimate projections by the 22 GCMs. Model evaluationsshow that the multi-model ensemble can morereasonably represent the present climate than individualmodels, so we use the projection of multi-modelensemble with more confidence(Meehl et al., 2007b).The multi-model ensemble mean(MME)is the arithmeticmean of all the 22 models in this study. Alloutputs from the GCMs are interpolated to 2.5°×2.5°grids through bilinear interpolation. Due to the largevariation in spatial distribution of water resourcesacross China, the same change may result in a largedifference for different regions. In this paper, all thechanges are shown in percentage against the 1980–1999 mean. The inter-model st and ard deviation isused to indicate the discrepancy among the GCMs.The number of GCMs which have the identical changesign with the MME is presented to demonstrate theuncertainty of the change tendency to increase ordecrease.3. Changes in P–E, precipitation, and evaporation3.1 Changes in P–E, precipitation, and evaporation over China
Figure 1a shows the changes of P–E in 2040–2059 and 2080–2099, compared to the 1980–1999 mean.The results of MME illustrate that P–E would increaseall across China, with the largest value over Xinjiang, Bohai Rim, and coastal areas of South China.From 2040–2059 to 2080–2099, the amplitude of theP–E change increases. In addition, over the period2080–2099, the tendency to increase in P–E is moreconsistent among the GCMs than that over 2040–2059.The areas with more than 16 models showing increasedP–E enlarge substantially, especially over NorthwestChina and central North China. Figure 2a shows thepercentage change of annual mean P–E averaged overChina. The black thick line indicates 9-yr runningmean. It is shown that P–E would generally increaseduring the whole 21st century with considerate interannualvariations. During the period 2010–2020 and 2040–2050, the increasing rate is relatively large, whilethe increasing trend becomes more moderate in post-2050. During 2020–2040, there is a slight decreasingtrend. The inter-model st and ard deviation among theGCMs increases approximately from 5% at the beginningof the 21st century to 10% by end of it, indicatingthat the model discrepancies enlarge with time. Inthe mid 21st century, the average of the P–E increasewould be 9% relative to 1980–1999. By the end of the21st century, the value increases to about 12%. Of the22 models, there are only 3 GCMs exhibiting downwardtrends in the annual mean P–E.
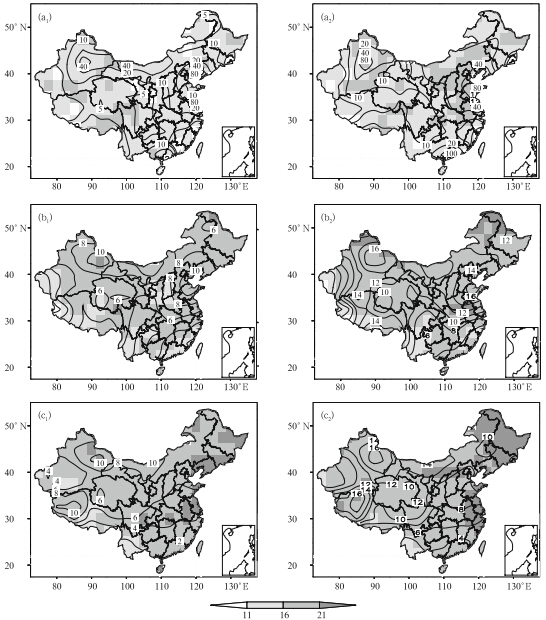 |
| Fig. 1. Changes in(a1, a2)annual mean P–E, (b1, b2)precipitation, and (c1, c2)evaporation for 2040–2059(a1, b1, c1) and 2080–2099(a2, b2, c2)compared to the 1980–1999 mean. Contours show the change in percentage based on the1980–1999 mean in MME, and shaded areas indicate the number of GCMs that show the same change sign(increase ordecrease)as the MME. |
 |
| Fig. 2. Changes in(a)P–E, (b)precipitation, and (c)evaporation averaged over mainl and China during the 21stcentury in MME, compared to the 1980–1999 mean. The gray line indicates annual mean. The black line indicates 9-yrrunning mean. The shaded area indicates the ±1 inter-model st and ard deviation. Percentage values are obtained basedon the 1980–1999 mean averaged over mainl and China in MME. |
Figure 1b shows the spatial pattern of the changein annual mean precipitation in the 21st century. Itis seen that there is more precipitation over China inMME. There would be a larger increase in northernChina, especially over Xinjiang and Bohai Rim area.This could be the reason for the large increase in P–Eover these two regions, as shown in Fig. 1a. Comparedto P–E, there are more models making a consistentprojection for precipitation. More than 16 modelsproduce more precipitation over most areas of China.Figure 2b shows the change of annual mean precipitationaveraged over China during the 21st century.It also shows a general increase during the whole century.The inter-model st and ard deviation is about 6%by the end of the 21st century relative to the 1980–1999 mean, which is smaller than that in P–E. In theperiod 2030–2050, the change rate is relatively largerthan in other periods. Precipitation would increase byabout 7%(10%)by the mid(end)of the century. Forevery single GCM, 21 models show upward trends inannual mean precipitation averaged over China duringthe century.
Figure 1c shows the changes in evaporation forthe periods 2040–2059 and 2080–2099. It displays thatevaporation would be strengthened across China underthe global warming background. The largest increaselocates over Northwest China, including northernXinjiang and west of the Qinghai-Tibetan Plateau.Jiang et al.(2009b)showed that the surface temperaturewould warm up faster in northern China and theQinghai-Tibetan Plateau than in the Yangze-HuaiheRiver valley and South China. The distributions ofstrengthened evaporation show a similar spatial patternsince evaporation is closely related to surface temperature.Generally, evaporation is relatively large innorthern China. Similar to precipitation, the projectionsof GCMs for evaporation are highly consistent.By the end of the 21st century, all the GCMs show intensifiedevaporation over Northeast China and alongthe coast of East China. Figure 2c shows the change inannual mean evaporation averaged over China duringthe 21st century. It is seen that evaporation wouldgenerally intensify during the whole century, with valuesof about 6%(9%)by the mid(end)of the 21stcentury, compared to the 1980–1999 mean. The intermodelst and ard deviation is about 4% relative to the1980–1990 mean in MME at the end of the 21st century.All 22 models show enhanced evaporation.
The projections of P–E show that the water resourcecondition would generally improve across thewhole China. Northwest China and central NorthChina are the most severe lack-of-water areas in China.These two areas are vulnerable to changes in waterresource conditions. Precipitation in central NorthChina had decreased during the late 20th century, while the above analysis indicates that there wouldbe substantially more precipitation and P–E underthe global warming scenario. These changes wouldmitigate the shortage of water resource in this area.Northwest China has become wetter during the recentdecades. The MME results show that this trendwould continue during the 21st century, which wouldalso be beneficial to the water resource condition there.Over the Qinghai-Tibetan Plateau, the MME resultsalso show more precipitation and more P–E underthe global warming. It is worth noting that thereis a large bias in the simulation of precipitation overthe Qinghai-Tibetan Plateau, and the models tend tooverestimate precipitation there. However, the calculationof difference from the model climatology couldsomehow reduce the effect of this systematic bias ina way. The Qinghai-Tibetan Plateau is the headwaterregion of the Yangtze River and Yellow River, thetwo largest rivers in China. In the middle and lowerreaches of these two river valleys, there would be moreP–E too. Therefore, runoff in these valleys would potentiallybe increasing under the global warming scenario.In the Haihe River valley, where the water resourcesdecreased in the recent decades(Xia et al., 2011), there would be more P–E as well. In most ofthis area, the increasing rate is more than 20%, largerthan in the Yangtze and Yellow River valleys.3.2 Changes in P–E, precipitation, and evaporation on regional scale
Considering the uneven spatial distribution of waterresources and varied climate conditions in China, analysis on changes of P–E, precipitation, and evaporationis performed on regional scale in this subsection.Figure 3 denotes the eight sub-areas within China. Areas1–8 respectively represent Northeast China(Area1), central North China(Area 2), Yangtze-HuaiheRiver valley(Area 3), South China(Area 4), east ofNorthwest China(Area 5), Southwest China(Area 6), Xinjiang(Area 7), and Qinghai-Tibetan Plateau(Area8).
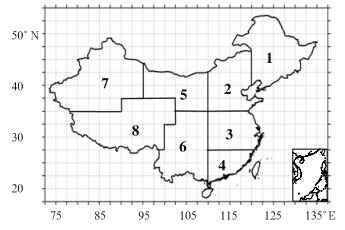 |
| Fig. 3. The eight sub-areas studied in this paper. |
Figure 4 shows the changes of annual mean P–Eaveraged over each sub-area. In all these eight subareas, P–E generally exhibits an increasing trend duringthe 21st century. After the 9-yr running mean, annualmean of precipitation averaged over Area 1 showsa shift around the 2050s. At the end of the 21st century, the increasing rate of P–E is up to about 15%, compared to the 1980–1999 mean. In Area 2, the annualmean P–E shows a jump during the mid 21stcentury, while the changes of P–E in pre-2040 and post-2050 periods are much smoother. There wouldbe about 30% more P–E by the end of the 21st century, which is the largest increasing rate among allthe 8 areas. In Areas 3 and 4, the changes of P–E exhibitan interdecadal variation before the 2050s and aslight upward trend afterwards. At the end of the 21stcentury, the increase percentage reaches about 16% inArea 3 and 13% in Area 4. In Areas 5 and 6, P–Eshows similar features as that in Area 2. There is aprominent increase in annual mean precipitation duringthe mid 21st century, especially in Area 6. P–E inAreas 5 and 6 increases by 13% and 10%, respectively, at the end of the 21st century. In Area 7, P–E showsan interdecadal variation marked with an upwardtrend during the whole 21st century and the increasingpercentage is about 7% at the end of the 21st century.P–E in Area 8 displays a consistent increasing trendover the 21st century, with the increasing percentageof about 10%. In most of these eight sub-areas, theinter-model st and ard deviation increases with time.The areas with larger change values always have largerinter-model discrepancy.
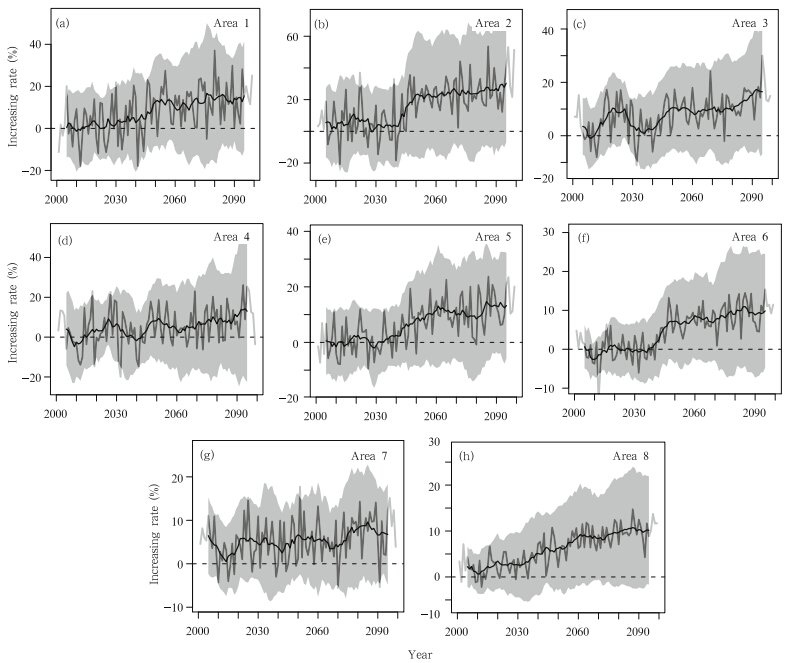 |
| Fig. 4. Changes in P–E averaged over mainl and China during the 21st century in MME, compared to the 1980–1999 mean. The gray line indicates annual mean, the black line indicates the 9-yr running mean, and the shaded areaindicates the ±1 inter-model st and ard deviation. Percentage values are obtained based on the 1980–1999 mean averagedover mainl and China in MME. |
Figure 5 shows the change in annual mean precipitationaveraged over each of the eight sub-areasduring the 21st century. Generally, the variations ofprecipitation are similar to those of P–E in all theseeight sub-areas, which means that precipitation playsa more dominant role in the change of annual meanP–E. The obvious difference is that the change percentage and the inter-model discrepancy of precipitationare less than those of P–E. By the end of the 21stcentury, the precipitation increases by 12%, 14%, 10%, 7%, 12%, 8%, 10%, and 11% for Areas 1–8, respectively.The sudden increase of precipitation around2050 in central North China, South China, and SouthwestChina is consistent with that reported by Sun and Ding(2010), although their analysis was performedon summer precipitation. They also found that thischange is closely related to the abrupt strengthening ofmonsoon circulation and water vapor transport fromlow and subtropical latitudes.
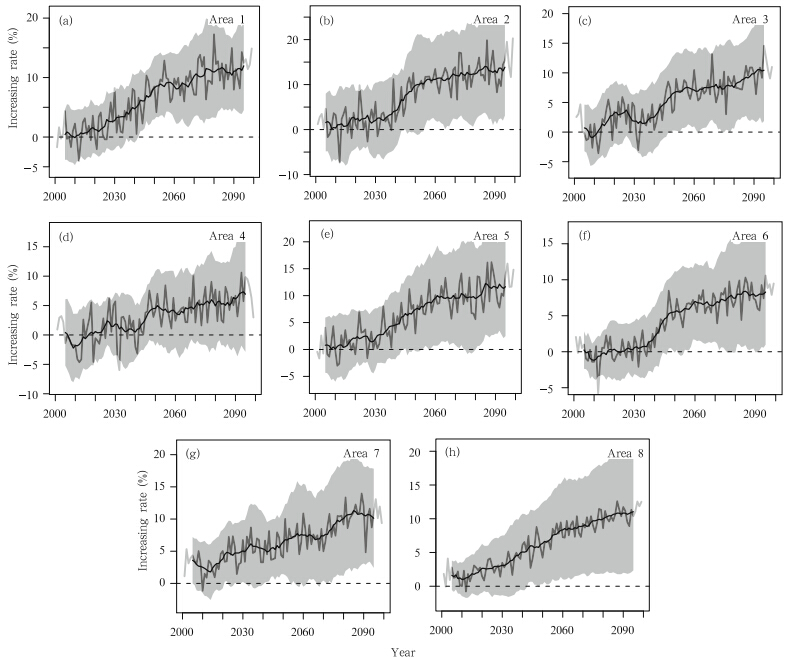 |
| Fig. 5. As in Fig. 4, but for precipitation. |
During the late 20th century, the decrease of waterresources has been a big threat to central NorthChina(Area 2). One of the main reasons is the reductionof precipitation in this area(Zhang, 1999).The MME result shows that precipitation in this areawould increase under global warming in the 21st century.Could the increase of precipitation in the 21stcentury compensate the decrease of it during the secondhalf of the 20th century? To answer this question, we interpolated CRU3.0(Climate Research Unitat University of East Anglia)precipitation(Mitchell and Jones, 2005)data into the same resolution of theMME, and estimated the decrease of precipitation inArea 2. The result shows that after the 9-yr runningmean, precipitation in the early 1950s is about7.7% more than that in 1980–1999 in the CRU3.0 data.The MME projection indicates that under SRES A1B, the increasing rate of precipitation after around 2045would be larger than 7.7%. The model results showthat around the mid 21st century, the increase of precipitationunder global warming would level off withthe decrease during the late 20th century.
Figure 6 shows the change in annual mean evaporationaveraged over each of the eight sub-areas. Duringthe 21st century, evaporation also shows upwardtrends generally. In Areas 1 and 2, evaporation strengthens with time, with increasing rates of about 11% and 10% at end of the 21st century. In Areas 3 and 4, evaporation is depressed before the 2020s, comparedto the 1980–1999 mean. Then, it increases gradually, with intense changes during the mid 21st century. Theevaporation increases by about 7%(Area 3) and 5%(Area 4)at the end of the 21st century. In Areas 5, 6, and 8, the changes of evaporation also show consistentupward trends, with increasing rates of 10%, 11%, and 12% at the end of the 21st century, respectively. InArea 6, there is no obvious change before 2020. Then, it shows an upward trend. By the end of the 21st century, there would be 7% more evaporation. Figure 6also indicates that the inter-model st and ard deviationfor evaporation among the 22 models is substantiallysmaller than that in P–E and precipitation.
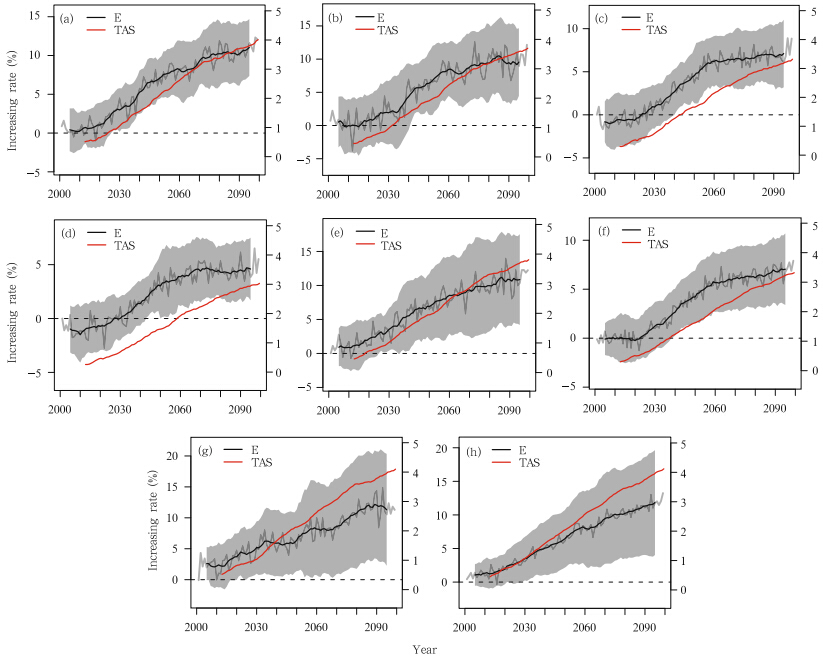 |
| Fig. 6. As in Fig. 4, but for evaporation. Unit for the black line is %. The red line indicates area averaged annualmean surface air temperature(TAS; ℃)for each area after the 9-yr running mean. |
Since evaporation is closely related to temperature, the local change in surface air temperature isalso plotted in Fig. 6. The warming trends in Areas1, 2, 5, 7, and 8 are larger than those in the otherareas. At the end of the 21st century, the incrementsare about 4℃ in these areas, while in Areas 3, 4, and 6, the increases in surface air temperature are about3℃. The increases in evaporation over the first groupof areas which have larger warming trends are substantiallylarger than those in the other group of areas.This further confirms the important impact of globalwarming on local evaporation.3.3 Changes in P–E, precipitation, and evaporation on seasonal scale
The hydroclimate conditions over China havestrong seasonal variations. The spatial patterns of seasonmean changes in P–E, precipitation, and evaporationare presented here. Figure 7 shows the spatialpatterns of the change in seasonal mean P–E for period2080–2099 relative to 1980–1999. It suggests thatthere would be more P–E over most areas of China inspring(Fig. 7a). The largest increasing center locatesin Southwest China. However, over Inner Mongolia, northeastern Xinjiang, southwest of the Qinghai-Tibetan Plateau, and southern Guangdong Province, P–E would decrease. More than 16 models show consistentchanges of P–E over most of China. All the 22models show increases of P–E over Southwest China, while fewer than half of the 22 models show more P–Ein the lower reaches of the Yangtze River valley as inMME. In summer(Fig. 7b), P–E would increase allover China, except for Xinjiang and northern GansuProvince. All the models show increasing trends insummer P–E in southeastern China. In autumn(Fig. 7c), there would be more P–E in China except forwestern Xinjiang and Qinghai-Tibetan Plateau, southernNortheast China, and the middle and lower reachesof the Yangtze River valley. Over eastern Qinghai-Tibetan Plateau, all models tend to show more P–E, while in the lower reaches of Yangtze River valley and western Gansu Province, fewer than half of the modelsshow decreasing trends. In winter(Fig. 7d), therewould be more P–E over China except for SouthChina. The most consistent tendency of change inP–E among the models occurs in East and SoutheastChina. The increasing percentage values becomegreater northward, with the largest center over centralNorth China.
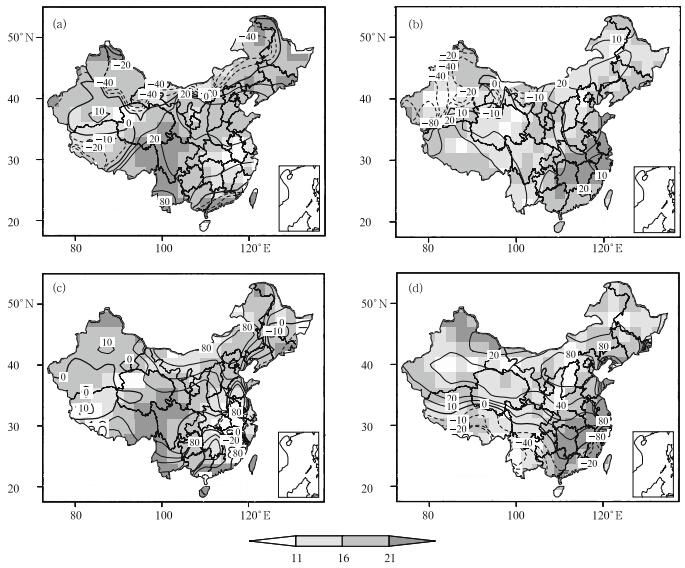 |
| Fig. 7. Changes(%)in seasonal mean P–E for 2080–2099 compared to 1980–1999 in(a)spring, (b)summer, (c)autumn, and (d)winter. Contours show the change in percentage based on the 1980–1999 mean in MME, and shadedareas indicate the number of GCMs that produce the same direction of change(increase or decrease)as the MME. |
Figure 8 shows the change of precipitation overChina for period 2080–2099 compared to 1980–1999in four seasons respectively. In spring(Fig. 8a), there would be more precipitation all over China exceptfor small regions in west of the Qinghai-TibetanPlateau. Over most of areas except for NorthwestChina, more than 16 models show increase in precipitation.In summer(Fig. 8b), there would be moreprecipitation all over China except for some regionsover western Xinjiang. The largest increase center locatesover North Xinjiang and the Qinghai-TibetanPlateau area. Over most areas in Northwest, Northeast, East, and South China, more than 16 modelsshow increasing trends in precipitation. In autumn(Fig. 8c), more precipitation is projected all acrossChina, with the largest increase over Inner Mongolia.Except for Northwest China, more than 16 modelsshow increases in precipitation over China. Inwinter(Fig. 8d), the distribution of precipitationchange is highly consistent with that of P–E, withpositive values over central and northern China, and negative values over southern China. All of the 22models show increases in precipitation over most ofareas in Northeast China, East China, and westernXinjiang.
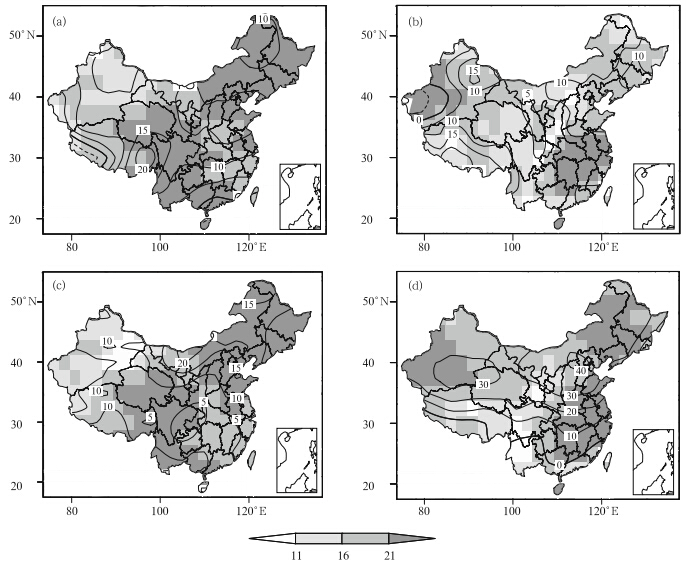 |
| Fig. 8. As in Fig. 7, but for precipitation. |
Figure 9 shows the change of evaporation for period2080–2099 relative to 1980–1999 in four seasonsrespectively. In spring(Fig. 9a), evaporation intensifiesall over China. The change of evaporation inNorthwest China is larger than in other areas, withthe increase percentage of 15%. All the models showenhanced evaporation over most areas of China. Insummer(Fig. 9b), evaporation also increases all overChina except for a small region in western Xinjiang.The largest value of change is over Northwest China.There are more than 16 models showing increases inevaporation over most areas. In autumn(Fig. 9c) and winter(Fig. 9d), the evaporation increases all overthe country, and the changes are generally larger innorthern China. Comparably, the increase magnitudein winter is larger than that in autumn, while the intermodeldiscrepancy in autumn is smaller than that inwinter.
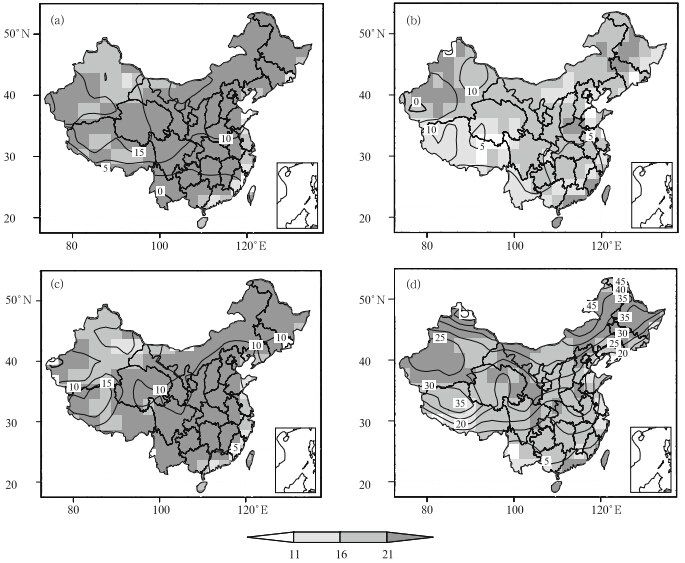 |
| Fig. 9. As in Fig. 7, but for evaporation. |
Figure 8 displays that precipitation generally increasesall over China in all four seasons. However, Fig. 7 displays that the changes of P–E have largescalepositive and negative centers, which indicatesthat the hydroclimate conditions may become betterover certain regions in China but worse over someother regions. These features of hydroclimate changecannot be explained only by precipitation change. Theinfluence of evaporation should also be taken into account.4. Summary and discussion
Most previous studies explored the climate changeimpact on hydroclimate conditions from precipitationperspective. In this study, the combined roles of precipitation and evaporation are considered to investigatethe influence of climate change on hydroclimateconditions. For annual mean, the precipitation, evaporation, and P–E all increase under the backgroundof global warming, which indicates that precipitationis the dominant contributor to hydroclimate change inChina. Although the global warming enhances evaporation, the tendency of the hydroclimate conditiondoes not change consequently. On seasonal timescale, the impact of the global warming related evaporationbecomes more significant, especially over northernChina. For example, during spring, summer, and autumn, precipitation is projected to increase in northernChina; however, the enhanced evaporation reducesP–E over some regions of northern China. Thus, itis necessary to synthetically consider the roles of precipitation and evaporation in assessing the impact ofclimate change on hydroclimate conditions.
The results presented in this paper are modelprojectedchanges of water resources under the globalwarming scenario. It should be noted that there isconsiderable uncertainty in this process. For instance, the level of greenhouse gas emission in the future isuncertain. State-of-the-art GCMs still have deficienciesin reproducing historical and present climate(Sun and Ding, 2008), which could limit the performance inprojections by these models. Additionally, theoreticalphysical explanation on the relationship of changesbetween precipitation, evaporation, and global warmingin observation is still somewhat unclear.
Acknowledgments. The authors would like tothank the modeling groups, the Program for ClimateModel Diagnosis and Intercomparison(PCMDI), and the WCRP’s Working Group on Coupled Modeling(WGCM)for making available the WCRP CMIP3multi-model dataset. The dataset is supported by theOffice of Science, U. S. Department of Energy. Wealso appreciate the valuable comments and suggestionsfrom the anonymous reviewers.
| [1] | Ding, Y. H., and Y. Sun, 2003: Long-Term Climate Variability in China. WMO/TD No. 1172, 18–23. |
| [2] | Hegerl, G., G. Meehl, C. Covery, et al., 2003: 20C3M: CMIP collecting data from the 20th century coupled model simulations. CLIVAR Exchangs, 26, 1–4. |
| [3] | Jiang Dabang, Su Mingfeng, Wei Rongqing, et al., 2009a: Variation and projection of drought and wet conditions in Xinjiang. Chinese J. Atmos. Sci., 33(1), 90–98. (in Chinese) |
| [4] | Jiang, D. B., Y. Zhang, and J. Q. Sun, 2009b: Ensemble projection of 1–3℃ warming in China. Chinese Sci. Bull., 54(18), 3326–3334. |
| [5] | Li Xinzhou, Liu Xiaodong, and Ma Zhuguo, 2004: Analysis on the drought characteristics in the main arid regions in the world since recent hundred years. Arid Zone Research, 21(2), 97–103. (in Chinese) |
| [6] | Liu, B., M. Xu, M. Hemderson, et al., 2005: Observed trends of precipitation amount, frequency, and intensity in China, 1960–2000. J. Geophy. Res., 110, D08103, doi: 10.1029/2004JD004864. |
| [7] | Ma Zhuguo, 2005: Dry-wet variation and its relationship with regional warming in arid regions of northern China. Chinese J. Geophys., 48(5), 1011–1018. (in Chinese) |
| [8] | Meehl, G. A., C. Covey, T. Delworth, et al., 2007a: The WCRP CMIP3 multi-model dataset: A new era in climate change research. Bull. Amer. Meteor. Soc., 88, 1383–1394. |
| [9] | —–, T. F. Stocker, W. D. Collins, et al., 2007b: Global Climate Projections. Climate Change 2007: The Physical Science Basis. Contribution of Working Group I to the Fourth Assessment Report of the Intergovernmental Panel on Climate Change. Solomon, S., D. Qin, M. Manning, Z. Chen, et al., Eds., Cambridge University Press, Cambridge, United Kingdom and New York, NY, USA, 996 pp. |
| [10] | Mitchell, T. D., and P. D. Jones, 2005: An improved method of constructing a database of monthly climate observations and associated high-resolution grids. Int. J. Climatol., 25(6), 693–712. |
| [11] | Nakicenovic, N., J. Alcamo, G. Davis, et al., 2000: IPCC Special Report on Emissions Scenarios. Nakicenovic, N., and R. Swart, Eds., Cambridge University Press, Cambridge, 599 pp. |
| [12] | Piao, S. L., P. Ciais, Y. Huang, et al., 2010: The impacts of climate change on water resources and agriculture in China. Nature, 467, 43–51. |
| [13] | Shi Yafeng, Shen Yongping, Li Dongliang, et al., 2003: Discussion on the present climate change from warmdry to warm-wet in Northwest China. Quaternary Research, 23(2), 152–164. (in Chinese) |
| [14] | Song Zhengshan, Yang Hui, and Zhang Qingyun, 1999: The characteristics of temporal and spatial variation of water resource components over North China. Plateau Meteor., 18(4), 552–566. (in Chinese) |
| [15] | Su, M. F., and H. J. Wang, 2007a: Instability of the relationship between ENSO and variations of drought and wet spells of China. Sci. China (Ser. D), 50(1), 145–152. |
| [16] | —–, and —–, 2007b: Decadal co-variability of the summer surface air temperature and soil moisture in China under global warming. Chinese Sci. Bull., 52(11), 1559–1565. |
| [17] | Sun, B., Y. L. Zhu, and H. J. Wang, 2011: The recent interdecadal and interannual variation of water vapor transport over eastern China. Adv. Atmos. Sci., 28(5), 1039–1048. |
| [18] | Sun Weiguo, Chen Bingyan, and Guo Qu, 2009a: Influence of the subtropical high over western Pacific on the difference between precipitation and evaporation in North China. Plateau Meteor., 28(5), 1167–1174. (in Chinese) |
| [19] | —–, —–, and —–, 2009b: Influence of East Asian monsoon circulation on precipitation-evaporation difference in North China. Chinese J. Agrometeor., 30(3), 327–334. (in Chinese) |
| [20] | —–, —–, and —–, 2010: Correlations between the precipitation evaporation difference in northern China and the Subtropical High over the western Pacific. Chinese J. Agrometeor., 31(1), 41–47. (in Chinese) |
| [21] | Sun, Y., and Y. H. Ding, 2008: Validation of IPCC AR4 climate models in simulating interdecadal change of East Asian summer monsoon. Acta Geographica Sinica, 66(5), 760–780. |
| [22] | —–, and —–, 2010: A projection of future change in summer precipitation and monsoon in East Asia. Sci. China (Ser. D), 53(2), 284–300. |
| [23] | Wang, H. J., 2001: The weakening of the Asian monsoon circulation after the end of 1970s. Adv. Atmos. Sci., 18, 376–386. |
| [24] | —–, 2002: Instability of the East Asian summer monsoon–ENSO relations. Adv. Atmos. Sci., 19, 1–11. |
| [25] | —–, 2010: Preliminary results of the 973 project on the energy and water cycle and their role in extreme climate of China. Adv. Earth Sci., 25(6), 563–570. (in Chinese) |
| [26] | —–, J. Q. Sun, H. P. Chen, et al., 2012: Extreme climate in China: Fact, simulation and projection. Meorologische Zeitschrift, doi:10.1127/0941-2948/2012/0330. |
| [27] | Wang Pingxiang, He Jinhai, Zheng Youfei, et al., 2007: Aridity-wetness characteristics over Northwest China in recent 44 years. J. Appl. Meteor. Sci., 18(6), 769–775. (in Chinese) |
| [28] | Wang, Y., and L. Zhou, 2005: Observed trends in extreme precipitation events in China during 1961–2001 and the associated changes in largescale circulation. Geophys. Res. Lett., 32, doi: 10.1029/2005GL022574. |
| [29] | Wang Yuan, Sheng Lianxi, Li Ke, et al., 2008: Analysis of present situation of water resources and countermeasures for sustainable development in China. Journal of Water Resources and Water Engineering, 19, 10–14. (in Chinese) |
| [30] | Wei Jie, Tao Shiyan, and Zhang Qingyun, 2003: Analysis of drought in northern China based on the Palmer Severity Drought Index. Acta Geographica Sinica, 58, 91–99. (in Chinese) |
| [31] | Wei Zhigang, Dong Wenjie, and Fan Lijun, 1999: Analysis and research on relationship between the climatic and run-off variation since the 1980s in North China. Plateau Meteor., 18(4), 525–534. (in Chinese) |
| [32] | Xia, J., C. Z. Liu, and G. Y. Ren, 2011: Opportunity and challenge of the climate change impact on the water resource of China. Adv. Earth Sci., 26(1), 1–12. |
| [33] | Xu, Z. X., T. L. Gong, and J. Y. Li, 2008: Decadal trend of climate over the Tibetan Plateau: Regional temperature and precipitation. Hydrol. Process, 22, 3056–3065. |
| [34] | Yang Hui and Song Zhengshan, 1999: Multiple time scales analysis of water resources in North China. Plateau Meteor., 18(4), 496–508. (in Chinese) |
| [35] | Zhang Qingyun, 1999: The variations of the precipitation and water resources in North China since 1880. Plateau Meteor., 18(4), 486–495. (in Chinese) |
| [36] | Zhou Liantong and Huang Ronghui, 2006: Characteristics of temporal and spatial variation of precipitation, evaporation and difference between precipitation and evaporation in North China. Climatic Environ. Res., 11(3), 280–295. (in Chinese) |
| [37] | Zhu, Y. L., H. J. Wang, W. Zhou, et al., 2011: Recent changes in the summer precipitation pattern in East China and the background circulation. Climate Dyn., 36, 1463–1473. |
 2012, Vol. 26


