
文章信息
- 蔡泽宇, 陈满, 杨腾祥, 金诚谦
- CAI Zeyu, CHEN Man, YANG Tengxiang, JIN Chengqian
- 基于激光三角法测量谷物容积
- Grain volume measurement based on laser triangulation
- 南京农业大学学报, 2021, 44(4): 797-804
- Journal of Nanjing Agricultural University, 2021, 44(4): 797-804.
- http://dx.doi.org/10.7685/jnau.202011006
-
文章历史
- 收稿日期: 2020-11-06


谷物容积的精确测量在联合收割机的产量监测[1]、带式输送机[2]和螺旋输送机[3]的谷物流量测量、粮仓的储藏管理[4-5]和谷粒三维(3D)模型研究[6]中应用广泛。谷物容积的测量原理分为接触式和非接触式, 接触式如测产用的桨轮式[7], 非接触式包括激光法、光电漫反射式、图像视觉方法和超声波测量法[8]。光电漫反射式被用在联合收割机的产量监测上, 通过传感器测得刮板上谷物的高度, 再根据容积模型计算出谷物的容积[9]。超声波测量主要用在果树[10]和林业[11]的冠层体积计算。图像视觉方法通过多幅图像的拼接或直接处理, 用来测量农产品的表面积和体积及对农产品分级[12]。谷物表面呈现不规则特征, 光电漫反射式无法直接准确测量不规则的容积, 而通过理论模型对测量结果进行修正, 则会增加实时测量的不确定性, 导致测量结果存在较大的随机误差; 超声波测量法存在对距离敏感、采样频率较低等问题; 图像视觉方法则受光照条件的影响, 无法保证稳定性。
激光法测量体积早已应用到林木冠层参数的测量[13-15]、作物表面模型的建立[16-17]和联合收割机产量监测[18]中。通过激光与图像配合的方式可以获得较高精度的物体表面的三维点云[19-21], 再利用点云的三维坐标可以计算获得被测对象的体积[22-24], 同时利用三维点云的坐标可以进行三维重构获得被测对象的三维模型[25]。但在实际应用中, 点云密度的大小一方面关系着程序的运行效率, 另一方面决定了谷物容积的测量误差, 因此确定点云的合理采样密度至关重要。在林业研究中, 已有研究表明将点云的数量缩小到其原始大小的6%(每平方米16个点随机减少到1个点)不会显著影响导出的林分参数, 包括平均高度、优势木高度和林分底面积[26]。当点云的密度降低到每平方米1点以后, 与高度相关的林分参数因点云密度降低而产生较大变化[27]。
目前针对谷物三维点云密度的大小对谷物容积测量的影响研究较少。本研究拟在实验室环境下搭建主动式的谷物容积测量装置, 采用LabVIEW编程完成自动化测量, 通过解决图像处理和原始点云数据处理的关键方法后对装置的测量精度进行验证, 对谷堆在不同点云密度下的测量容积进行研究, 以期获得用于稻谷容积测量时最优的点云密度, 并利用程序对三维点云进行三维可视化。
1 激光三角法测量原理激光三角法分为斜射式和垂直入射式2种, 本文采用的垂直入射式激光三角法具有测量范围大的优点[28]。垂直入射式激光三角测量法原理如图 1。图 1-a中线激光垂直打在谷物堆上, 此时激光线打在物体表面的高度(Δh)与成像面上光轮廓从底面处移动的距离(Δd)存在以下关系:

|
(1) |

|
图 1 激光三角测量法原理光路图 Fig. 1 Optical path diagram of laser triangulation principle |
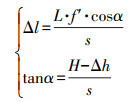
式中: γ为激光器光束轴心线与成像透镜光轴的夹角; β为成像面与成像透镜光轴夹角; f为成像透镜光轴上的等效物距; f′为成像透镜光轴上的等效像距。此外, 物体宽度的变化反映激光线中心线的长度变化, 如图 1-b。此时物体的宽度(L)与成像面上的光轮廓长度(Δl)存在如下关系:
|
(2) |
式中:Δh为物体表面激光线距离底面的高度; s为激光扫描平面到成像透镜的距离; H为成像透镜到底面的高度; α为激光器光束轴心线与底面的夹角。
通过公式(1)和(2)可以获得CCD相机中图像上激光线中心线上的点对应的实际高度(Δhi)和图像在Y轴方向上测得的单位相对位移(Δyi), 再引入步进电机的步长(Δx), 则可以通过以下公式求得中心线上每个像素点对应的体积微元:

|
(3) |
式中:ΔVi为图像上光轮廓上的一点的体积微元;Δx为步进电机的步长, 也是谷堆三维点云在X轴的间隔;Δyi为图像在Y轴方向上的单位相对位移, 也是点云在该方向的间隔。通过对三维模型上所有点云的体积微元进行求和, 即可求得物体体积。
2 装置组成及测量算法 2.1 试验装置组成测量装置总体结构如图 2-a, 装置由40 mm×40 mm×1 000 mm的铝合金型材支架组成, 并选用20 mm×20 mm×1 000 mm的T型型材、T型滚轮滑台、力矩为0.4 N的42步进电机、带宽6 mm的橡胶同步带作为平移运动机构。其中, 运动机构距离地面500 mm, 步进电机经TB6600型驱动器由Arduino板卡控制。装置的测量部分由均匀红线一字激光传感器和工业摄像头组成, 线激光传感器选用650 nm、100 mW、最小线宽为0.5 mm的FU650AB100-GD16型激光模组。工业相机选用型号为HT-U500C的CCD彩色相机(分辨率为2 592像素×1 944像素, 每秒帧数为7, 焦距可调)。Arduino与相机通过USB串口连接至计算机, 计算机的CPU为Intel Core i5-3230M, 4 GB内存, 2 TB硬盘。在相机固定支架的设计中, 考虑到稻谷的最大休止角不超过45°[29], 因而相机与水平面的固定夹角设置为48°。装置的测量区域由步进电机的平移距离、相机倾角和线激光长度决定, 面积为600 mm×400 mm。试验稻谷品种为‘武运粳31号’。

|
图 2 谷物容积测量装置结构和扫描原理图 Fig. 2 Structure and scanning schematic diagram of grain volume measuring device |
当谷物堆积在扫描区域时(图 2-b), 步进电机连同滑台带着线激光传感器和相机沿着X轴方向平移, 每行进一步将采集到的图像传输至计算机进行处理。根据步长和运行次数确定所采集的谷堆截面在X轴的位置(xi), 图像经算法处理后得到激光线中心线上每个点对应的谷堆高度(Δhi)和在Y轴的位置(yi), 同时将三维点云的每个点的三维坐标(xi, yi,Δhi)存储到数据库中。行程结束后, 从数据库中读取三维点云信息, 通过积分算法得到谷堆容积, 同时将三维点云可视化。
系统的软件采用NI公司的LabVIEW 2019 SP1进行编程, 可实现控制、图像处理、测量、存储和可视化功能, 其中存储的数据库调用Microsoft公司的Access 2016软件。测量系统流程图如图 3。

|
图 3 测量系统流程图 Fig. 3 Flow chart of measurement system |
通过容积测量中的关键方法, 对采集的图片进行图像处理和数学运算, 并将图片中的激光线转化为实际的三维坐标。其中主要涉及图像中激光线的中心线提取和三维点云的插值处理。
2.3.1 图像预处理与激光线的中心线提取图像中激光线是具有宽度的高亮光线, 其宽度由线激光传感器的性能和相机的放大倍数决定, 在进行坐标计算时, 必须先获得激光线的中心线上的坐标。工业相机采集的图片像素为2 592×1 944的24位RGB格式。程序首先将图像强制转换为32位RGB格式, 然后提取图像中R分量, 得到8位的灰度图, 并直接将灰度图转化为数组。在数组的基础上进行激光线的中心线提取, 而提取方法对三维测量系统的精度影响很大。常用的中心线提取方法包括极值法、阈值法、灰度重心法[30]。考虑到极值法受噪点的影响较大, 而灰度重心法的数据计算量较大, 因此本文提出了加权平均的方法, 见公式(4)。

|
(4) |
式中: c为激光线的中心线的坐标; xi为图像截面光的灰度I大于等于阈值I0点的坐标; ∑i为图像单列的像素点总数量。
2.3.2 三维点云插值经过中心线提取和坐标换算后, 点云在相机上的坐标受图像噪点和谷堆表面孔洞的影响, 点云坐标非连续分布, 无法直接对截面进行积分并求得容积。常用的散点处理方法有插值、拟合和逼近[31]。由于谷物表面缺失点较少, 本文采用Cubic-Hermite插值方法对点云进行修复。
3 结果与分析 3.1 三维点云扫描系统测量精度验证为了验证三维点云扫描系统在谷物容积测量方面的性能, 本文通过三维点云扫描系统对小麦的质量进行测量并与电子天平测得的结果对比。在实验室对小麦质量进行测量, 小麦的含水率在8%左右。试验前, 预先通过电子天平和三维点云扫描系统得到小麦堆积后的质量与容积的线性比值。电子天平选用的是常州市衡正电子仪器有限公司的FA2204N型电子天平, 分度值为0.1 mg。小麦的实际质量为187.21 g, 容积为319.352 cm3, 求得小麦在三维点云扫描系统下的容重为0.586 g·cm-3。通过三维点云扫描系统自动测量谷物的容积, 并将容积转换为质量。试验数据(表 1)表明: 三维点云扫描系统在10 g以上的小麦质量预测上具有较好的稳定性, 平均相对误差为0.44%, 最小相对误差为0.28%。
| 编号 Serial number |
系统测量的体积/cm3 The volume measured by the system |
系统测量的质量/g The mass measured by the system |
小麦的实际质量/g The actual mass of wheat |
绝对误差/g The absolute error |
相对误差/% The relative error |
| 1 | 4.164 3 | 2.440 279 8 | 3.08 | -0.640 | -20.77 |
| 2 | 2.587 6 | 1.516 357 0 | 1.33 | 0.186 | 14.01 |
| 3 | 11.571 5 | 6.780 899 0 | 6.80 | -0.019 | -0.28 |
| 4 | 19.251 4 | 11.281 320 4 | 11.26 | 0.021 | 0.19 |
| 5 | 44.427 4 | 26.034 456 4 | 25.88 | 0.154 | 0.60 |
| 6 | 69.918 2 | 40.972 065 2 | 40.88 | 0.092 | 0.23 |
| 7 | 140.610 0 | 82.397 460 0 | 81.54 | 0.857 | 1.05 |
| 8 | 175.134 0 | 102.628 524 0 | 101.75 | 0.879 | 0.86 |
| 9 | 236.458 0 | 138.564 388 0 | 139.87 | -1.306 | -0.93 |
| 10 | 300.107 0 | 175.862 702 0 | 174.76 | 1.103 | 0.63 |
| 13 | 389.172 0 | 228.054 792 0 | 226.21 | 1.845 | 0.82 |
| 14 | 432.589 0 | 253.497 154 0 | 252.03 | 1.467 | 0.58 |
| 平均Average | 0.44 |
利用三维点云扫描系统对水平面积约为61 mm×102 mm的谷堆进行不同点云密度下容积测量试验。每个点云密度下重复测量4次。考虑到起始点的误差, 每次试验的起始点为随机选取。试验分别对X-Y面上不同点云密度下测量的谷物容积进行试验, 为消除扫描方向对结果的影响, 将点云密度在X轴和Y轴的采样间隔设为一致, 测量结果的三维散点图如图 4所示。

|
图 4 不同点云密度下谷堆的三维点云图 Fig. 4 Three-dimensional point cloud diagram of the valley stack at different cloud densities |
图中点云的数量(n)与谷堆的水平投影面积(A)、X轴点云密度的间隔(rx)和Y轴点云密度的间隔(ry)相关, 存在以下关系:

|
(5) |
结果表明, n值还受X轴运动起始点的位置影响, 利用高于2 mm×2 mm的点云密度进行谷物容积测量时, 谷物容积的测量值变化很小, 而且随着点云密度的继续提高测量值变化不大, 因此试验结果分析以1 mm×1/12 mm点云密度下测得的容积作为标准值, 结果见表 2。从表 2可以看出, 点云的数量成指数分布, 数量越大对计算机硬件要求越高, 处理时间也越长, 当点云密度降低到8 mm×8 mm以下时, 61 mm×102 mm面积内的点云数量稳定在100以下, 且变化不大。当点云密度在13 mm×13 mm及以上时, 平均相对误差均小于3%。但4次试验的最大相对误差只在点云密度高于11 mm×11 mm时小于5%。综合认为, 基于该激光三角法测量装置用于小面积堆积的稻谷容积测量的最佳点云密度应为11 mm×11 mm。
| 点云密度/ (mm×mm) Cloud densities |
平均容积/cm3 Average volume |
平均相对误差/% Mean relative error |
最大相对误差/% Maximum relative error |
点云数量 Number of point cloud |
| 1×1/12 | 42.669 55 | — | — | 72 929 |
| 2×2 | 42.963 25 | 0.69 | 0.80 | 1 507 |
| 3×3 | 43.110 45 | 1.03 | 1.27 | 665 |
| 4×4 | 42.642 28 | 0.06 | 0.26 | 372 |
| 5×5 | 42.680 13 | 0.02 | 0.40 | 237 |
| 6×6 | 42.776 50 | 0.25 | 1.05 | 168 |
| 7×7 | 42.344 23 | 0.76 | 1.21 | 123 |
| 8×8 | 42.312 05 | 0.84 | 1.69 | 90 |
| 9×9 | 42.300 48 | 0.86 | 1.74 | 75 |
| 10×10 | 42.291 55 | 0.89 | 2.28 | 63 |
| 11×11 | 42.270 25 | 0.94 | 3.21 | 50 |
| 12×12 | 41.582 45 | 2.55 | 6.21 | 39 |
| 13×13 | 41.540 08 | 2.65 | 8.70 | 34 |
| 14×14 | 40.818 05 | 4.34 | 6.99 | 31 |
在最佳点云密度下, 将系统获得的三维点云坐标自动保存至数据库中, 通过三维重构方式还原谷堆的三维模型。软件采用LabVIEW 2019 SP1调用MATLAB R2017a的方式, 通过联合编程用三角剖分(delaunay triangulation)算法得到点云在高点云密度和低点云密度下的三维重建模型(图 5)。

|
图 5 三角剖分算法得到的三维重建可视化图 Fig. 5 3D reconstruction visualization image obtained by triangulation algorithm |
从图 5-a可见, 在1 mm×1/12 mm点云密度下, 三维点云重构的3D图能够充分还原谷堆的外形, 具有较强的颗粒感, 但此时点云的数据量是点云密度11 mm×11 mm的1 400多倍。而本文推荐的最优点云密度为11 mm×11 mm的3D点云依然可以用于谷物体积的测量(图 5-b), 此时谷堆的3D图依然能反映此时谷物在高度上的分布。
4 结论1) 利用步进电机、线激光传感器和工业相机搭建了低成本的谷物容积测量装置, 软件设计中提出了容积测量中激光线的中心线提取和点云的插值处理等方法。
2) 利用三维点云扫描系统对小麦质量进行测量, 结果表明系统的测量平均误差为0.44%, 最小误差为0.28%, 说明系统具有较高精度。
3) 对不同点云密度下测量的稻谷容积进行研究, 结果表明, 在点云密度高于2 mm×2 mm时, 点云扫描系统测量的谷物容积变化不大。综合谷物点云的数量、谷堆的平均相对误差和最大相对误差, 认为稻谷容积测量的最佳点云密度为11 mm×11 mm。通过获得最佳的点云密度, 可以推出用于谷物容积测量的硬件的最低要求, 满足最佳的性能、成本和精度的要求, 为3D点云在谷物容积实时测量的应用中提供参考。
| [1] |
金诚谦, 蔡泽宇, 倪有亮, 等. 谷物联合收割机在线产量监测综述: 测产传感方法、产量图重建和动力学模型[J]. 中国农业大学学报, 2020, 25(7): 137-152. Jin C Q, Cai Z Y, Ni Y L, et al. Research review on online grain yield monitoring for combine harvester: yield sensing, yield mapping and dynamic model[J]. Journal of China Agricultural University, 2020, 25(7): 137-152 (in Chinese with English abstract). |
| [2] |
华程, 尹文庆, 姜鑫, 等. 基于机器视觉的物料瞬时流量测量系统设计[J]. 传感器与微系统, 2019, 38(3): 110-112, 116. Hua C, Yin W Q, Jiang X, et al. Design of materials instantaneous flow measurement system based on machine vision[J]. Transducer and Microsystem Technologies, 2019, 38(3): 110-112, 116 (in Chinese with English abstract). |
| [3] |
姜鑫, 尹文庆, 浦浩, 等. 基于结构光三维视觉的螺旋输送器谷粒体积的测量方法[J]. 南京农业大学学报, 2019, 42(2): 373-381. Jiang X, Yin W Q, Pu H, et al. Measurement method of grain volume on screw conveyor based on structured light of 3D vision[J]. Journal of Nanjing Agricultural University, 2019, 42(2): 373-381 (in Chinese with English abstract). DOI:10.7685/jnau.201807028 |
| [4] |
赵燕东, 涂佳炎, 刘圣波, 等. 基于WPF的粮仓三维激光测绘系统设计与开发[J]. 农业工程学报, 2016, 32(11): 265-270. Zhao Y D, Tu J Y, Liu S B, et al. Design and development of system for mapping granary on basis of WPF 3D application[J]. Transactions of the Chinese Society of Agricultural Engineering, 2016, 32(11): 265-270 (in Chinese with English abstract). DOI:10.11975/j.issn.1002-6819.2016.11.037 |
| [5] |
邵晴, 徐涛, 吉野辰萌, 等. 基于三维激光扫描技术的粮食储量监测系统的设计与试验[J]. 农业工程学报, 2015, 31(20): 262-267. Shao Q, Xu T, Yoshino T, et al. Design and experiment for grain storage monitoring system based on 3-D laser scanning technology[J]. Transactions of the Chinese Society of Agricultural Engineering, 2015, 31(20): 262-267 (in Chinese with English abstract). DOI:10.11975/j.issn.1002-6819.2015.20.036 |
| [6] |
李骅, 尹文庆, 高翔, 等. 基于逆向工程的谷粒三维模型的构建[J]. 西北农林科技大学学报(自然科学版), 2011, 39(12): 201-206. Li H, Yin W Q, Gao X, et al. Construction of three-dimensional model of grain based on reverse engineering[J]. Journal of Northwest A & F University(Natural Science Edition), 2011, 39(12): 201-206 (in Chinese with English abstract). |
| [7] |
Auernhammer H, Demmel M, Muhr T, et al. Yield measurements on combine harvesters[C]//American Society of Agricultural Engineers Winter Meeting, 1993.
|
| [8] |
罗胜彬, 宋春华, 韦兴平, 等. 非接触测量技术发展研究综述[J]. 机床与液压, 2013, 41(23): 150-153. Luo S B, Song C H, Wei X P, et al. Review for the development and research of non-contact measurement technology[J]. Machine Tool & Hydraulics, 2013, 41(23): 150-153 (in Chinese with English abstract). DOI:10.3969/j.issn.1001-3881.2013.23.042 |
| [9] |
付兴兰, 张兆国, 安晓飞, 等. 光电漫反射式联合收割机谷物产量计量系统研发与性能试验[J]. 农业工程学报, 2017, 33(3): 24-30. Fu X L, Zhang Z G, An X F, et al. Development and performance experiment on grain yield monitoring system of combine harvester based on photoelectric diffuse reflectance[J]. Transactions of the Chinese Society of Agricultural Engineering, 2017, 33(3): 24-30 (in Chinese with English abstract). |
| [10] |
姜红花, 刘理民, 柳平增, 等. 面向精准喷雾的果树冠层体积在线计算方法[J]. 农业机械学报, 2019, 50(7): 120-129. Jiang H H, Liu L M, Liu P Z, et al. Online calculation method of fruit trees canopy volume for precision spray[J]. Transactions of the Chinese Society for Agricultural Machinery, 2019, 50(7): 120-129 (in Chinese with English abstract). |
| [11] |
Maghsoudi H, Minaei S, Ghobadian B, et al. Ultrasonic sensing of pistachio canopy for low-volume precision spraying[J]. Computers and Electronics in Agriculture, 2015, 112: 149-160. DOI:10.1016/j.compag.2014.12.015 |
| [12] |
吴明清, 弋晓康, 罗华平, 等. 基于多轮廓模型的红枣体积和表面积在线测量方法[J]. 农业工程学报, 2019, 35(19): 283-290. Wu M Q, Yi X K, Luo H P, et al. On-line measurement method for volume and surface area of red jujube based on multi-contour model[J]. Transactions of the Chinese Society of Agricultural Engineering, 2019, 35(19): 283-290 (in Chinese with English abstract). DOI:10.11975/j.issn.1002-6819.2019.19.035 |
| [13] |
樊仲谋, 冯仲科, 郑君, 等. 基于立方体格网法的树冠体积计算与预估模型建立[J]. 农业机械学报, 2015, 46(3): 320-327. Fan Z M, Feng Z K, Zheng J, et al. Tree crown volume calculation and prediction model establishment using cubic lattice method[J]. Transactions of the Chinese Society for Agricultural Machinery, 2015, 46(3): 320-327 (in Chinese with English abstract). |
| [14] |
Palleja T, Tresanchez M, Teixido M, et al. Sensitivity of tree volume measurement to trajectory errors from a terrestrial LIDAR scanner[J]. Agricultural and Forest Meteorology, 2010, 150(11): 1420-1427. DOI:10.1016/j.agrformet.2010.07.005 |
| [15] |
刘芳, 冯仲科, 杨立岩, 等. 基于三维激光点云数据的树冠体积估算研究[J]. 农业机械学报, 2016, 47(3): 328-334. Liu F, Feng Z K, Yang L Y, et al. Estimation of tree crown volume based on 3D laser point clouds data[J]. Transactions of the Chinese Society for Agricultural Machinery, 2016, 47(3): 328-334 (in Chinese with English abstract). |
| [16] |
Hämmerle M, Höfle B. Effects of reduced terrestrial LiDAR point density on high-resolution grain crop surface models in precision agriculture[J]. Sensors, 2014, 14(12): 24212-24230. DOI:10.3390/s141224212 |
| [17] |
管贤平, 刘宽, 邱白晶, 等. 基于机载三维激光扫描的大豆冠层几何参数提取[J]. 农业工程学报, 2019, 35(23): 96-103. Guan X P, Liu K, Qiu B J, et al. Extraction of geometric parameters of soybean canopy by airborne 3D laser scanning[J]. Transactions of the Chinese Society of Agricultural Engineering, 2019, 35(23): 96-103 (in Chinese with English abstract). DOI:10.11975/j.issn.1002-6819.2019.23.012 |
| [18] |
杨刚, 雷军波, 刘成良, 等. 基于线结构光源和机器视觉的高精度谷物测产系统研制[J]. 农业工程学报, 2019, 35(8): 21-28. Yang G, Lei J B, Liu C L, et al. Development of yield monitoring system with high-precision based on linear structured light source and machine vision[J]. Transactions of the Chinese Society of Agricultural Engineering, 2019, 35(8): 21-28 (in Chinese with English abstract). |
| [19] |
梁秀英, 周风燃, 陈欢, 等. 基于运动恢复结构的玉米植株三维重建与性状提取[J]. 农业机械学报, 2020, 51(6): 209-219. Liang X Y, Zhou F R, Chen H, et al. Three-dimensional maize plants reconstruction and traits extraction based on structure from motion[J]. Transactions of the Chinese Society for Agricultural Machinery, 2020, 51(6): 209-219 (in Chinese with English abstract). |
| [20] |
彭飞, 方芳, 王红英. 基于三维激光扫描的大麦籽粒力学建模与试验[J]. 农业机械学报, 2018, 49(11): 342-348. Peng F, Fang F, Wang H Y. Modeling and experiment on mechanical properties of barley grain based on 3D laser scanning[J]. Transactions of the Chinese Society for Agricultural Machinery, 2018, 49(11): 342-348 (in Chinese with English abstract). DOI:10.6041/j.issn.1000-1298.2018.11.041 |
| [21] |
夏春华, 施滢, 尹文庆. 基于TOF深度传感的植物三维点云数据获取与去噪方法[J]. 农业工程学报, 2018, 34(6): 168-174. Xia C H, Shi Y, Yin W Q. Obtaining and denoising method of three-dimensional point cloud data of plants based on TOF depth sensor[J]. Transactions of the Chinese Society of Agricultural Engineering, 2018, 34(6): 168-174 (in Chinese with English abstract). |
| [22] |
陶依贝. 基于激光三角法的传送带物料体积流量测量方法研究[D]. 南京: 东南大学, 2018. Tao Y B. Research of methods for material volume flow measurement based on laser triangulation[D]. Nanjing: Southeast University, 2018(in Chinese with English abstract). |
| [23] |
张延芝. 基于激光扫描技术的带式输送机非接触式输送量检测系统的应用与研究[D]. 沈阳: 东北大学, 2014. Zhang Y Z. The application and research of the system to measure the conveying capacity by non contact type on conveyor belt[D]. Shenyang: Northeastern University, 2014(in Chinese with English abstract). |
| [24] |
李汉超. 基于激光三角法的物料体积计量方法研究[D]. 合肥: 合肥工业大学, 2015. Li H C. Research of methods for material volume measurement based on laser triangulation[D]. Hefei: Hefei University of Technology, 2015(in Chinese with English abstract). |
| [25] |
张伟洁, 刘刚, 郭彩玲, 等. 基于三维点云的苹果树叶片三维重建研究[J]. 农业机械学报, 2017, 48(S1): 103-109. Zhang W J, Liu G, Guo C L, et al. Apple tree leaf three-dimensional reconstruction based on point cloud[J]. Transactions of the Chinese Society for Agricultural Machinery, 2017, 48(S1): 103-109 (in Chinese with English abstract). DOI:10.6041/j.issn.1000-1298.2017.S0.017 |
| [26] |
González-Ferreiro E, Diéguez-Aranda U, Miranda D. Estimation of stand variables in Pinus radiata D. Don plantations using different LiDAR pulse densities[J]. Forestr, 2013, 85(2): 281-292. |
| [27] |
Jakubowski M K, Guo Q H, Kelly M. Tradeoffs between lidar pulse density and forest measurement accuracy[J]. Remote Sensing of Environment, 2013, 130: 245-253. DOI:10.1016/j.rse.2012.11.024 |
| [28] |
王春艳. 激光测量中光条关键技术研究[D]. 长春: 吉林大学, 2014. Wang C Y. Research on key technologies of light stripe in laser measurement[D]. Changchun: Jilin University, 2014(in Chinese with English abstract). |
| [29] |
孙慧男, 陈旭, 夏朝勇. 稻谷休止角的测定与实验研究[J]. 现代食品, 2018(2): 63-66. Sun H N, Chen X, Xia C Y. Measurement and experiment study on angle of repose of paddy[J]. Modern Food, 2018(2): 63-66 (in Chinese with English abstract). |
| [30] |
崔亮纯. 线结构光三维测量系统关键技术的研究[D]. 广州: 华南理工大学, 2016. Cui L C. Research on key techniques of line-structured light 3-D measurement system[D]. Guangzhou: South China University of Technology, 2016(in Chinese with English abstract). |
| [31] |
刘俊. 移动最小二乘散点曲线曲面拟合与插值的研究[D]. 杭州: 浙江大学, 2011. Liu J. Fitting and interpolation for curve and surface from scattered data using moving least squares method[D]. Hangzhou: Zhejiang University, 2011(in Chinese with English abstract). |