
文章信息
- 冯建英, 岳秀丽, 倪元丽, 章元明
- FENG Jianying, YUE Xiuli, NI Yuanli, ZHANG Yuanming
- 多歧性状上位性关联分析的分层广义混合线性模型方法
- Hierarchical generalized mixed linear model method in epistasis association study for ordinal traits
- 南京农业大学学报, 2017, 40(2): 211-218
- Journal of Nanjing Agricultural University, 2017, 40(2): 211-218.
- http://dx.doi.org/10.7685/jnau.201608015
-
文章历史
- 收稿日期: 2016-08-12


2. 华中农业大学植物科技学院, 湖北 武汉 430070
2. College of Plant Science and Technology, Huazhong Agricultural University, Wuhan 430070, China
上位性在复杂性状遗传剖析、物种进化机制和杂种优势遗传基础解析等方面具有重要作用, 因此有必要研究上位性检测方法[1-3]。基于双亲分离群体数量和多歧性状上位性检测方法, 已有惩罚最大似然[4]、经验贝叶斯[5]、LASSO[6]、分层广义线性模型[7-8]和EBLASSO[9]等, 它们同时考虑主效QTL、QTL间互作和QTL与环境互作效应, 能更全面解析复杂性状的遗传基础。目前, 在人类和植物数量性状关联分析中上位性检测方法有长足的发展, 包括参数[10-13]和非参数方法[14-15]两大类。
作物品种是多次杂交重组的结果, 由它们组成的品种资源群体遗传变异大, 蕴藏可供作物遗传育种利用的优异等位基因, 为育种设计和优异亲本组合预测提供素材。在探索数量性状上位性方面, Wang等[16]的自适应混合LASSO和Lü等[17]的经验Bayes可处理模型变量个数少于样本容量10倍的数据集, Wen等[13]的EBLASSO可处理更大的数据集。若要提高运算速度, 可采用Zhang等[12]的基于GPU计算和混合模型的方法。抗性性状是主要的育种目标, 在统计遗传中称为多歧性状。为了挖掘这类性状的优异等位基因, 有必要探索品种资源群体多歧性状上位性检测方法。然而, 多歧性状的非孟德尔遗传和信息量少等特点, 使得其关联分析研究的工作更加困难。所以, 品种群体多歧性状QTL上位性检测工作相对较少。目前, 混合线性模型和Logistic回归模型、贝叶斯和惩罚似然等参数估计方法以及函数逼近和迭代等技术的应用, 为多歧性状上位性关联分析方法的研究打下坚实基础[9, 18-21]。
Feng等[22]基于伪数据正态逼近算法和经验Bayes算法[23]提出的分层广义线性混合模型方法可检测多歧性状的主效QTL, 本研究在此基础上拓展了多歧性状QTL与环境互作和QTL间互作检测的新方法, 并通过Monte Carlo模拟试验和大豆幼苗主根长耐盐碱性指数分级数据分析, 证实该方法的有效性。
1 材料与方法 1.1 试验材料257份大豆品种的135个SSR分子标记数据及其2009与2010两年耐盐碱性指数分级表型数据[24]用于新方法的试验验证。其中将大豆品种的耐盐碱性指数[24]按照0~20%、20%~40%、40%~60%、60%~80%和80%~100%将其耐盐碱性级别划分为高耐、耐、中耐、感和高感5种, 依次记为1到5, 作为本研究的表型数据。ATI代表耐碱性性状, STI代表耐盐性性状。
用STRUCTURE软件[25]分析135个SSR标记基因型数据。随着亚群数增加, 对数似然函数值增加。因此, 采用ΔK方法和育种经验, 确定亚群数K=4为适宜亚群数[24], 并获得各品种属于各亚群后验概率的Q矩阵, 以控制群体遗传结构。
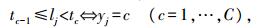
1.2 广义混合线性模型设多歧性状表型观测向量为Y={yj}j=1n, 其中yj是第j品种表型观测值, 分成C类, 即yj的取值属于1~C类。为建立数学模型, 引入一个连续的潜在变量lj与多歧性状表型yj相对应, 即:
|
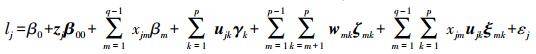
式中:tc为C+1个假定阈值, 且t0=-∞ < t1 < … < tC=+∞。由此, lj的混合线性模型为:
|
(1) |
式中:β0为群体平均值; β00为群体结构效应向量; (β1, …, βq-1)T为环境效应, q为环境个数; 向量γk(k=1, …, p) 是第k个位点的gk-1维QTL效应, gk是位点k的等位基因个数; 向量ζmk是第m个位点和第k个位点的 (gm-1)(gk-1) 维上位性效应; 向量ξmk是 (q-1)(gk-1) 维的QTL与环境互作效应, 与γk、ζmk均为随机效应; εj是随机误差, 服从标准正态分布。(z1T z2T … znT)T是群体结构的Q矩阵; xjm和ujk分别是第j品种的参数βm和γk的哑变量; 向量wmk是参数ζmk的哑变量, 其值由ujm和ujk确定。
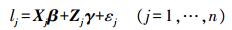
将群体平均值、环境效应和群体结构等固定效应合并记为向量β, 其设计阵记为Xj; 将QTL效应、上位性效应和QTL与环境互作效应等随机效应合并为随机向量γ, 其设计阵记为Zj, 则将模型 (1) 简化为混合线性模型:
|
(2) |
当参数β、γ和t=(t0, t1, …, tC) 已知时, 表型yj条件独立, 其对数似然函数为:

|
(3) |
式中:Φ(·) 为标准正态分布的累积分布函数; θ={t, β, γ}为参数向量; Iyj=c为示性函数。
1.3 参数估计 1.3.1 先验分布在模型 (2) 中, 参数γ为随机效应。采用分层广义线性模型[7], 以解决随机效应个数远远大于样本容量的超饱和线性模型问题。假定每个随机QTL效应γk(k=1, …, vq) 的方差σk2不同, 并通过假定如下的先验分布建立了分层模型:

|
式中:τ和a是常数。通过模拟研究发现, (τ, a)=(1, 0.5) 的效果较好。
1.3.2 参数估计根据正态逼近似然方法[26-27], 可将式 (3) 的似然函数Pr (yj|Xj, Zj, θ) 转化为正态似然函数N(wj|μ0j, σ0j2, t)。其中, 

由牛顿迭代、后验分布和经验Bayes可得到β、γk、σk2、ωk、bk和阈值tc的估计量[22]。
1.3.3 迭代过程1) 初始值设置γk(0)、tc(0)、ωk(0)、σk2(0)和bk(0); 2) 参数σk2、ωk、bk、γk、tc和β由其估计式依次更新; 3) 重复执行第2步, 直到满足预先设定的收敛标准为止。
1.4 统计检验用两步选择方法[17]对所有QTL进行似然比测验 (LRT)。
1.5 Monte Carlo模拟方案用Zhang等[28]的玉米群体来模拟4组试验, 以验证新方法的有效性。假定祖先亲本Founders是连锁平衡的。Non-founders基因型是由它们的亲本基因型产生的, 关联群体由Non-founders品种组成。假设在4条100 cM长的染色体上, 等距离设置44个标记, 每个标记有2个等比例等位基因。4个主效QTL (main-effect QTL, 简记为MQ)、7个上位性QTL (QTL-by-QTL interaction, 简记为QQ) 和2个QTL与环境互作 (QTL-by-environment interaction, 简记为QE) 的位置与效应参数设置见表 1。重复200次。字母Q标“*”表示该QTL含有主效, 即QQ*和Q*Q*分别表示1个和2个位点有主效, Q*E表示主效QTL与环境互作。
| QTL真值True values for QTL parameters | 一步法 One-stepmethod |
变量初筛显著水平Significant level in the selection of variables | ||||||
| 类型 Type |
染色体 Chromosome |
位置/cM Position |
遗传率/% h2 |
0.30 | 0.25 | 0.20 | 0.10 | |
| 主效QTL | 1 | 90 | 3 | 81.0 | 84.5 | 81.0 | 82.0 | 79.5 |
| Main QTL | 2 | 90 | 10 | 97.5 | 98.5 | 98.0 | 98.5 | 100.0 |
| 3 | 10 | 1 | 25.5 | 27.0 | 23.5 | 25.0 | 23.5 | |
| 4 | 10 | 5 | 92.5 | 96.5 | 94.5 | 95.0 | 94.0 | |
| 1 & 3 | 10 & 90 | 5 | 96.0 | 98.0 | 96.5 | 97.0 | 94.5 | |
| 1 & 4 | 50 & 50 | 3 | 89.0 | 79.0 | 82.0 | 82.5 | 70.5 | |
| 1 & 4 | 90 & 10 | 10 | 99.0 | 99.0 | 99.5 | 100.0 | 100.0 | |
| 上位性Epistasis | 2 & 3 | 10 & 10 | 3 | 84.0 | 81.5 | 79.5 | 81.5 | 71.5 |
| 2 & 3 | 50 & 50 | 10 | 98.0 | 99.0 | 100.0 | 99.0 | 99.5 | |
| 2 & 3 | 90 & 10 | 5 | 94.5 | 95.0 | 96.5 | 92.0 | 93.0 | |
| 2 & 4 | 90 & 90 | 5 | 95.5 | 93.5 | 96.5 | 94.0 | 93.5 | |
| 环境互作 | 1 | 50 | 5 | 100.0 | 100.0 | 100.0 | 99.5 | 98.5 |
| Environmental interaction | 2 | 90 | 5 | 100.0 | 97.0 | 96.0 | 97.0 | 92.5 |
在模拟试验1中, Founders数为100, Non-founders数为300, 表型分布设置为1:1:1:1:1、1:2:4:2:1、1:3:9:3:1和8:5:3:1:1共4种类型。在模拟试验2中, Founders数和Non-founders数同模拟试验1, 表型分类数设置为2(1:1)、4(1:3:3:1) 和6(1:3:6:6:3:1) 共3种类型。在模拟试验3中, 表型分布为1:2:4:2:1, Founders数为100, Non-founders数设置为200、300和500共3种类型。在模拟试验4中, 表型分布为1:2:4:2:1, Non-founders数为300, Founders数设置为10、50、75和100共4种情况。
QTL存在的显著性阈值为LOD>2.0。检测到的QTL样本数与重复总数200的比值为QTL检测的统计功效。假阳性效应个数与零效应总数的比值为假阳性率。
2 结果与分析 2.1 Monte Carlo模拟研究 2.1.1 模拟研究4个模拟试验的研究结果见图 1。图 1-a是Founders数100、Non-founders数300、表型分类数5、表型分布1:2:4:2:1条件下, 不同遗传率 (0.01、0.03、0.05和0.10) 对MQ和QQ检测功效影响的模拟结果; 图 1-b是遗传率0.05, 其他参数同图 1-a下, MQ、QQ和QE三者功效比较的模拟结果。结果表明, MQ和QQ检测功效随遗传率增加而增加 (图 1-a); 遗传率小于5%时, 相同遗传率QE和QQ检测功效要高于MQ (图 1-b)。这种趋势在均匀分布和对称分布、分类数较少、遗传率较小、Founder数少和Non-founders数少情况下更明显[29]。

|
图 1 QTL遗传率 (a) 和效应类型 (b) 对其检测功效的影响 Figure 1 Effect of QTL heritability (a) and effect type (b) on its detection power MQ:主效QTL; QQ:上位性QTL; QE:QTL与环境互作; *:有主效 MQ:Main-effect QTL; QQ:Epistasis QTL; QE:QTL-by-environment interaction; *:With main effect |
新方法的假阳性率在不同参数设置情况下均较小 (图 2)。但是当样本容量太小 (如Non-founders数小于10) 时, 假阳性率会较高。这是因为样本容量越小, 数据所包含的信息量越少, 检测结果可靠度和准确度越低。新方法在检测MQ、QQ和QE时, QTL位置和效应以及阈值的估计值偏差都相对较小[29]。

|
图 2 不同表型分布、表型分类数、Non-founders数和Founders数对假阳性率的影响 Figure 2 Effect of phenotypic distribution and the numbers of phenotypic categories, Non-founders and Founders on false positive rate |
模拟试验1研究了表型性状分类数为5时, 不同表型分布对新方法的影响。模拟了均匀分布 (1:1:1:1:1)、对称分布 (1:3:9:3:1和1:2:4:2:1) 和偏态分布 (8:5:3:1:1)4种类型, 结果 (图 3-a和文献[29]) 表明:MQ、QQ和QE的遗传率较小 (如0.03) 时, 对称分布检测功效最高, 且对称分布变异越小 (如1:3:9:3:1) 检测功效越大; 其遗传率较大 (0.05或0.10) 时, 表型分布类型对检测功效的影响较小。

|
图 3 表型分布 (a)、表型分类数 (b)、Non-founders数 (c) 和Founders数 (d) 对统计检测功效的影响 Figure 3 Effect of phenotypic distribution (a) and the numbers of categories (b), Non-founders (c) and Founders (d) on power of QTL detection |
模拟试验2是在表型分布对称条件下, 比较了表型分类数2(1:1)、4(1:3:3:1) 和6(1:3:6:6:3:1)3种情况对新方法的影响。结果 (图 3-b和文献[29]) 表明:MQ、QQ和QE的统计检测功效随分类数增加而增加。这是因为随着分类数增加, 表型观察值提供的生物信息量会增加, 离散表型更接近连续表型。
2.1.4 Non-founders数的影响模拟试验3是在Founders数100时, 研究Non-founders数200、300和500对QTL检测结果的影响。结果 (图 3-c和文献[29]) 表明:Non-founders数越大, MQ、QQ的检测功效越大; 随着遗传率增加, MQ和QQ的检测功效增加; 遗传率为0.05时, QE的功效均较大, 受Non-founders数影响不显著。
2.1.5 Founders数的影响模拟试验4比较了Founders数10、50、75和100时对QTL检测结果影响。结果 (图 3-d和文献[29]) 表明:随着Founders数增加, MQ和QQ的功效均增大, 但增加幅度逐渐减小; 而QE检测功效都较大 (遗传率为0.05), 受Founders数的影响不明显; QQ和QE检测功效大于MQ, 特别地, Founders数越小, 此关系越明显; 当Founders数较小 (如10和50) 时, MQ的存在会显著影响其相关QQ检测功效。
2.2 大豆耐盐碱性上位性QTL检测大豆品种群体各SSR标记的等位基因数目不等, 很多位点等位基因数远大于2, 其效应数为等位基因数减1, 由此QQ效应数远大于样本容量, 导致遗传模型超饱和。本研究采用两步筛选方法以解决该问题。首先, 利用独立性χ2测验筛选标记以剔除遗传模型中明显不显著的效应, 以降低模型维数; 其次, 使用分层广义混合线性模型上位性检测方法分析大豆幼苗根长耐盐碱性数据。
在效应初步筛选时, 需要考虑筛选的显著水平。本研究设置显著水平分别为0.10、0.20、0.25和0.30, 以获得最适显著水平。结果表明, 显著水平大于0.25时的结果比较接近不筛选变量的结果 (表 1), 且假阳性率小于0.8%。因此, 选择0.25作为变量筛选的概率标准。
2.2.1 MQ、QE和QQ的检测用新方法分析大豆耐盐碱指数分级数据, 检测到2个MQ (1个耐碱ATI和1个耐盐STI)、4个QQ (3个ATI和1个STI) 和3个QE (1个ATI和2个STI), 分别位于A1、B2、D1a、D2、F、I、M、N和O共9条染色体上 (表 2)。从表 2可见:耐碱性指数MQ、QQ和QE的累计表型方差解释率 (proportion of phenotypic variance explained, 简记为PVE) 分别为3.15%、26.37%和45.98%。QQ标记sat_274×satt348和QE标记sat_344的PVE均大于10%。耐盐性指数MQ、QQ和QE的累计PVE分别为3.33%、13.27%和14.47%。
| 性状 Trait |
新方法New method | QTL的优异等位基因 Elite allele of detected QTL |
不同方法的相似结果 Similar results from different methods |
||||||||
| 类型 Type |
染色体 Chromosome |
标记 Marker |
位置/cM Position |
方差 Variance |
LOD | 解释率/% PVE |
效应 Effect |
载体品种 Carrier |
|||
| ATI | MQ | 14(B2) | sat_342 | 20.30 | 0.128 1 | 6.95 | 3.15 | -0.79 | 遵义棕子豆 (ATI, 2009◎-HT※, 2010-HT) |
ECMLM; Main model; mrMLM (STI) | |
| 3(N)1(D1a) | satt255satt580 | 76.4862.36 | 0.179 2 | 6.74 | 4.40 | -0.83 | 鸭蛋青 (ATI, 2009-HT, 2010-HT) |
mrMLM; BhGLM (STI) EAM | |||
| 10(O)10(O) | sat_274satt348 | 107.5815.29 | 0.670 4 | 11.80 | 16.50 | -6.20 | 鲁豆1号 (ATI, 2010-HT) |
BhGLM; Main modelECMLM; mrMLM; Main model | |||
| 20(I)17(D2) | satt354satt413 | 46.22113.61 | 0.222 6 | 9.74 | 5.47 | -1.78 | 周01042-10 (ATI, 2009-T, 2010-T) |
BhGLM; mrMLMECMLM; BhGLM (STI) | |||
| QE | 5(A1) | sat_344 | 19.37 | 1.872 6 | 6.04 | 45.98 | -10.39 | 白秋1号 (ATI, 2009-HS, 2010-HT) |
Main model; BhGLM (STI) | ||
| STI | MQ | 10(O) | sat_274 | 107.58 | 0.048 3 | 2.79 | 3.33 | -0.69 | 荣经四坪黄豆 (STI, 2009-T, 2010-T) |
Main model; BhGLM (ATI) | |
| 7(M)13(F) | sat_391satt149 | 1.0218.12 | 0.192 6 | 11.22 | 13.27 | -2.54 | 大悟大黄豆 (STI, 2009-HT, 2010-T) |
EAM (satt149) | |||
| QE | 20(I) | satt270 | 50.11 | 0.107 0 | 4.57 | 7.38 | -0.56 | 临安八月白 (STI, 2009-T, 2010-MT) |
ECMLM; Main model | ||
| QE | 3(N) | satt022 | 102.05 | 0.102 9 | 6.27 | 7.09 | -1.10 | 快豆黄 (STI, 2009-T, 2010-MT) |
EAM; Main model; mrMLM (ATI) | ||
| 注:ATI:耐碱指数; STI:耐盐指数; MQ:主效QTL; QQ:上位性QTL; QE:QTL-环境互作; Main model:用多QTL主效模型[22]定位到相同的结果; ◎:表示年份, 2009年和2010年; ※:表示耐盐碱级别, HT:高耐, T:耐, MT:中耐, S:敏感, HS:高敏。 ATI:Alkaline tolerance index; STI:Salt tolerance index; MQ:Main-effect QTL; QQ:Epistasis QTL; QE:QTL-by-environment interaction; Main model:Similar results detected by main-effect genetic model[22]; ◎Year:2009 and 2010;※Alkaline-salt tolerance, HT:High tolerance, T:Tolerance, MT:Middle tolerance, S:Sensitivity, HS:High sensitivity. | |||||||||||
与Feng等[22]的结果比较, 有2个相似的MQ和3个相似的QE。前者为耐碱性关联标记sat_342(PVE=3.15%) 和耐盐性关联标记sat_274(PVE=3.33%); 后者为耐碱性关联标记sat_344(PVE=45.99%)、耐盐性关联标记satt270(PVE=7.38%) 和耐盐性关联标记satt022(PVE=7.09%)。Feng等[22]采用主效QTL检测方法检测到碱性上位性sat_274×satt348的2个标记与MQ关联; ATI的QQ和STI的MQ同时检测到标记sat_274。标记satt580、satt149和satt022被EAM检测到[24]; 标记sat_342、satt348、satt413和satt270被ECMLM[30]检测到[24]; 标记satt255、satt348、satt354被mrMLM[31]检测到; 标记sat_274和satt354被BhGLM[7]检测到; 根据soybase信息, 标记satt255与耐盐QTL (Salt tolerance 5-1) 关联[32]。
2.2.2 优异等位基因挖掘和亲本组合预测通过极大似然法, 估计品种群体关联标记等位基因效应, 筛选出效应最小即耐盐碱性最强的等位基因, 作为该位点的优异等位基因, 而携带该等位基因的品种为代表性载体材料, 结果见表 2。从表 2可见:与ATI关联的标记sat_342等位基因260 bp的效应最小 (-0.79), 为优异等位基因, 含该等位基因的‘遵义棕子豆’为其代表性载体材料。ATI的QQ (sat_274×satt348) 中, sat_274的412 bp × satt348的232 bp效应最小 (-6.20), 代表性载体材料为高耐的‘鲁豆1号’; STI的QE (satt270) 中, 等位基因252 bp与2009年环境的互作效应最小 (-0.56), 其代表性载体材料为‘临安八月白’, 2年的表型鉴定至少为中等耐性。
从包含所有被检测到优异等位基因的杂交组合中选出性状预测值最小的RILs作为最优亲本组合。结果表明, 任何两品种的组合均无法包含所有被检测到QTL的优异等位基因。为了将耐盐性或耐碱性优异等位基因全包含在内, 可考虑利用多个品种组合, 以实现亲本组合预测。例如‘周01042-10’ב白秋1号’ב鲁豆2号’包含所有被检测到QTL的耐碱性优异等位基因, 可作为改善耐碱性的最优亲本组合; ‘荣经四坪黄豆’ב大悟大黄豆’ב水城棕子豆’ב大黑脐’包含了所有被检测到QTL的耐盐性优异等位基因, 可作为改善耐盐性的最优亲本组合。
2.2.3 候选基因预测分析了大豆耐盐碱性的潜在候选基因信息, 共发现12个与拟南芥耐盐碱性基因同源的大豆基因。它们分别与本文检测到的12个标记关联, 其中2个MQ、4个QQ和3个QE, 其物理距离在24.62~2 235.39 kb之间 (表 3)。发掘的3个与拟南芥耐盐碱基因AT1G69270共线性的大豆基因为Glyma01g31590、Glyma03g32260和Glyma13g04890, Glyma13g04890位于大豆F连锁群上标记satt149附近, 两者相距约175.71 kb。
| 拟南芥耐盐碱性基因 Alkaline-salttolerance genes in Arabidopsis thaliana |
大豆同源基因 Homologous genes in soybean |
大豆同源基因附近的关联标记 Associated marker in this study around soybean homologous gene (SHG) |
|||||
| 染色体 Chromosome |
基因 Gene |
位置/bp Position |
标记 Marker |
位置/bp Position |
SHG的距离/kb Distance to SHG |
||
| AT5G24270(SOS3) | 14 | Glyma14g04460 | 3 041 067~3 043 265 | sat_342 | 2 954 747~2 954 981 | 88.52 | |
| AT1G69270(RPK1) | 1 | Glyma01g31590 | 42 607 297~42 611 243 | satt580 | 44 367 646~44 367 759 | 1 756.40 | |
| 3 | Glyma03g32260 | 40 056 398~40 064 748 | satt255 | 40 344 151~40 344 291 | 279.40 | ||
| 13 | Glyma13g04890 | 5 150 245~5 152 453 | satt149 | 4 976 740~4 977 013 | 175.71 | ||
| AT3G55990(ESK1) | 3 | Glyma03g37830 | 44 311 465~44 314 773 | satt022 | 44 682 505~44 682 712 | 367.73 | |
| 10 | Glyma10g08840 | 7 723 976~7 726 538 | satt348 | 5 491 146~5 491 362 | 2 235.39 | ||
| 20 | Glyma20g24410 | 34 090 029~34 092 464 | satt354 | 33 429 765~33 430 013 | 662.70 | ||
| 20 | Glyma20g24410 | 34 090 029~34 092 464 | satt270 | 34 223 110~34 223 331 | 130.65 | ||
| AT2G47190(MYB2) | 5 | Glyma05g04900 | 4 075 972~4 078 558 | sat_344 | 3 691 696~3 691 992 | 386.86 | |
| 7 | Glyma07g01050 | 622 077~624 114 | sat_391 | 163 089~163 360 | 461.03 | ||
| 10 | Glyma10g35050 | 43 232 666~43 234 194 | sat_274 | 43 209 577~43 209 848 | 24.62 | ||
| AT1G27760(SAT32) | 17 | Glyma17g35340 | 39 294 060~39 300 445 | satt413 | 40 042 651~40 042 961 | 742.21 | |
本研究将品种群体多歧性状的多QTL分层广义混合线性模型关联分析方法[22]推广到了上位性检测。新方法可以同时检测多歧性状的MQ、QQ和QE。在实际应用中, 面对超饱和线性模型实际数据资料, 可以结合卡方测验进行两步筛选, 以实现上位性检测。利用极大化正态逼近的似然和经验贝叶斯估计各关联标记效应, 并实现优异等位基因挖掘和优异亲本组合预测。本研究结果的可靠性已经在文中得以证实。
Monte Carlo模拟试验结果表明, 新方法在统计检测功效和参数估计精确性方面表现较好[29], 且假阳性率比较低; 遗传率、表型分布、表型分类数、Non-founders数和Founders数对检测结果有一定影响, 这与Lü等[17]和Feng等[22]的结果相似。
新方法检测了257个大豆品种耐盐碱性的上位性, 除了标记sat_391, 其他关联标记均可被多QTL分层广义混合线性主效模型、EAM、ECMLM、mrMLM和BhGLM中的至少一种方法所证实。将本研究结果与该257份大豆连续数量性状的EAM和ECMLM定位结果[24]对比, 共检测到7个相同标记; 2个MQ和3个QE被Feng等[22]的主效多QTL方法检测到; 耐碱上位性的2个关联标记sat_274和satt348被Feng等[22]的主效多QTL方法检测到为耐碱性MQ。
耐盐碱性优异等位基因代表性载体材料预测结果, 与所选材料的耐盐碱性试验表型鉴定结果一致。例如, 检测到耐碱性的3个QQ的载体材料:‘周01042-10’‘鸭蛋青’和‘鲁豆1号’至少在2009和2010两年的表型鉴定中为耐性; 检测到耐盐性MQ的载体材料‘荣经四坪黄豆’在两年表现鉴定中均为耐盐性, QQ的载体材料‘大悟大黄豆’至少在两年的表型鉴定中为耐盐性。
由于作物很多重要性状表现为多歧性状, 其表型数据是离散的。因此, 新方法的提出具有应用价值。目前, 关联分析主要是检测主效QTL, 上位性的检测方法还相对较少。因此, 新方法的提出对于推动植物关联分析上位性检测具有积极作用。随着标记数目的增加, 遗传模型中待估效应个数远大于样本容量, 模型的超饱和性越严重。因此, 品种群体多歧性状上位性QTL检测依然面临很大的挑战, 需要继续探索。
| [1] | Fasoulas A C, Allard R W. Nonallelic gene interactions in the inheritance of quantitative characters in barley[J]. Genetics, 1962, 47(7): 899–907. |
| [2] | Zhou X, Stephens M. Genome-wide efficient mixed-model analysis for association studies[J]. Nat Genet, 2012, 44(7): 821–824. DOI: 10.1038/ng.2310 |
| [3] | Segura V, Vilhjálmsson B J, Platt A, et al. An efficient multi-locus mixed-model approach for genome-wide association studies in structured populations[J]. Nat Genet, 2012, 44(7): 825–830. DOI: 10.1038/ng.2314 |
| [4] | Zhang J, Yue C, Zhang Y M. Bias correction for estimated QTL effects using the penalized maximum likelihood method[J]. Heredity, 2012, 108(4): 396–402. DOI: 10.1038/hdy.2011.86 |
| [5] | Xu S. An empirical Bayes method for estimating epistatic effects of quantitative trait loci[J]. Biometrics, 2007, 63(2): 513–521. DOI: 10.1111/biom.2007.63.issue-2 |
| [6] | Yi N J, Xu S. Bayesian LASSO for quantitative trait loci mapping[J]. Genetics, 2008, 179(2): 1045–1055. DOI: 10.1534/genetics.107.085589 |
| [7] | Yi N, Banerjee S. Hierarchical generalized linear models for multiple quantitative trait locus mapping[J]. Genetics, 2009, 181: 1101–1113. DOI: 10.1534/genetics.108.099556 |
| [8] | Yi N J, Liu N J, Zhi D G, et al. Hierarchical generalized linear models for multiple groups of rare and common variants:jointly estimating group and individual-variant effects[J]. PLoS Genet, 2011, 7(12): e1002382. DOI: 10.1371/journal.pgen.1002382 |
| [9] | Huang A H, Xu S Z, Cai X D. Empirical Bayesian LASSO-logistic regression for multiple binary trait locus mapping[J]. BMC Genetics, 2013, 14: 5. |
| [10] | Zhang Y, Liu J S. Bayesian inference of epistatic interactions in case-control studies[J]. Nat Genet, 2007, 39: 1167–1173. DOI: 10.1038/ng2110 |
| [11] | Tang W W, Wu X B, Jiang R. Epistatic module detection for case-control studies:a Bayesian model with a Gibbs sampling strategy[J]. PLoS Genet, 2009, 5(5): e1000464. DOI: 10.1371/journal.pgen.1000464 |
| [12] | Zhang F T, Zhu Z H, Tong X R, et al. Mixed linear model approaches of association mapping for complex traits based on omics variants[J]. Sci Rep, 2015, 5: 10298. DOI: 10.1038/srep10298 |
| [13] | Wen J, Zhao X W, Wu G R, et al. Genetic dissection of heterosis using epistatic association mapping in a partial NCII mating design[J]. Sci Rep, 2015, 5: 18376. |
| [14] | Li J, Dan J, Li C L, et al. A model-free approach for detecting interactions in genetic association studies[J]. Brief Bioinform, 2014, 15: 1057–1068. DOI: 10.1093/bib/bbt082 |
| [15] | Yang N, Lu Y L, Yang X H, et al. Genome wide association studies using a new nonparametric model reveal the genetic architecture of 17 agronomic traits in an enlarged maize association panel[J]. PLoS Genet, 2014, 10(9): e1004573. DOI: 10.1371/journal.pgen.1004573 |
| [16] | Wang D, Eskridge K M, Crossa J. Identifying QTLs and epistasis in structured plant populations using adaptive mixed LASSO[J]. J Agric Biol Environ Stat, 2011, 16: 170–184. DOI: 10.1007/s13253-010-0046-2 |
| [17] | Lü H Y, Liu X F, Wei S P, et al. Epistatic association mapping in homozygous crop cultivars[J]. PLoS ONE, 2011, 6(3): e17773. DOI: 10.1371/journal.pone.0017773 |
| [18] | Coffman C J, Doerge R W, Simonsen K L, et al. Model selection in binary trait locus mapping[J]. Genetics, 2005, 170(3): 1281–1297. DOI: 10.1534/genetics.104.033910 |
| [19] | Li J, Wang S, Zeng Z B. Multiple interval mapping for ordinal traits[J]. Genetics, 2006, 173: 1649–1663. DOI: 10.1534/genetics.105.054619 |
| [20] | Iwata H, Ebana K, Fukuoka S, et al. Bayesian multilocus association mapping on ordinal and censored traits and its application to the analysis of genetic variation among Oryza sativa L.germplasms[J]. Theor Appl Genet, 2009, 118: 865–880. DOI: 10.1007/s00122-008-0945-6 |
| [21] | Hoggart C J, Whittaker J C, De Iorio M, et al. Simultaneous analysis of all SNPs in genome-wide and re-sequencing association studies[J]. PLoS Genet, 2008, 4(7): e1000130. DOI: 10.1371/journal.pgen.1000130 |
| [22] | Feng J Y, Zhang J, Zhang W J, et al. An efficient hierarchical generalized linear mixed model for mapping QTL of ordinal traits in crop cultivars[J]. PLoS ONE, 2013, 8(4): e59541. DOI: 10.1371/journal.pone.0059541 |
| [23] | Xu S. An expectation-maximization algorithm for the Lasso estimation of quantitative trait locus effects[J]. Heredity, 2010, 105: 483–494. DOI: 10.1038/hdy.2009.180 |
| [24] |
张文杰. 大豆幼苗期耐盐碱性的鉴定与关联分析[D]. 南京: 南京农业大学, 2012.
Zhang W J. Evaluation and association mapping for soybean salt-alkaline tolerance at seeding stage[D]. Nanjing:Nanjing Agricultural University, 2012(in Chinese with English abstract). |
| [25] | Pritchard J K, Stephens M, Donnelly P. Inference of population structure using multilocus genotype data[J]. Genetics, 2000, 155: 945–959. |
| [26] | Wolfinger R, O'Connell M. Generalized linear mixed models a pseudo-likelihood approach[J]. J Stat Comput Simul, 1993, 48: 233–243. DOI: 10.1080/00949659308811554 |
| [27] | Gelman A, Carlin J B, Stern H S, et al. Bayesian Data Analysis[M]. 3rd ed. London: Chapman and Hall/CRC, 2014. |
| [28] | Zhang Y M, Mao Y C, Xie C Q, et al. Mapping quantitative trait loci using naturally occurring genetic variance among commercial inbred lines of maize (Zea mays L.)[J]. Genetics, 2005, 169(4): 2267–2275. DOI: 10.1534/genetics.104.033217 |
| [29] |
冯建英. 多歧性状关联分析的分层广义线性混合模型方法[D]. 南京: 南京农业大学, 2013.
Feng J Y. Hierarchical generalized linear mixed model method in the association studies of ordinal traits[D]. Nanjing:Nanjing Agricultural University, 2013(in Chinese with English abstract). |
| [30] | Li M, Liu X L, Bradbury P, et al. Enrichment of statistical power for genome-wide association studies[J]. BMC Biology, 2014, 12: 73. DOI: 10.1186/s12915-014-0073-5 |
| [31] | Wang S B, Feng J Y, Ren W L, et al. Improving power and accuracy of genome-wide association studies via a multi-locus mixed linear model methodology[J]. Scientific Reports, 2016, 6: 19444. DOI: 10.1038/srep19444 |
| [32] | Ha B K, Vuong T D, Velusamy V, et al. Genetic mapping of quantitative trait loci conditioning salt tolerance in wild soybean[J]. Euphytica, 2013, 193(1): 79–88. DOI: 10.1007/s10681-013-0944-9 |