 2005, Vol. 41
文章信息
- Zhang Deqiang, Zhang Zhiyi, Yang Kai, Li Bailian
- 张德强, 张志毅, 杨凯, 李百炼
- QTL analysis of leaf morphology and spring bud flush in (Populus tomentosa×P. bolleana)×P. tomentosa
- 毛新杨×毛白杨叶片表型和春季萌芽时间QTL分析
- Scientia Silvae Sinicae, 2005, 41(1): 42-48.
- 林业科学, 2005, 41(1): 42-48.
-
文章历史
Received date: 2004-04-16
-
作者相关文章


2. 中国农业科学院品种资源研究所 北京 100081;
3. 美国北卡罗莱纳州立大学林学系 北卡罗莱纳州 NC27695-8203
2. Institute of Crop Germplasm, Chinese Academy of Agriculture Beijing 100081;
3. Department of Forestry, North Carolina State University North Carolina State 27695-8203
The size, morphology, anatomy and phenology of leaves are important parameters for estimating the amount of biomass, as has been reported in previous studies in woody plant species (Larson et al., 1971; Bradshaw et al., 1995; Wu et al., 1997; Castro-Diez et al., 2000). In forest trees, the magnitude of leaf area directly affects the efficiency and yield of photosynthesis. It is, therefore, a good predictor of stem volume (Leverenz et al., 1990; Wu et al., 1997). The timing of bud flush determines when new leaves emerge and trees grow. The growing tissues may be killed by late frost if bud flush occurs too early in spring. Conversely, the growing season for trees will have to be shortened due to late initiation of bud flush in spring, which reduces competitive ability and growth potential (Frewen et al., 2000). Hence, analysis of the genetic basis for leaf morphology and the timing of bud flush are important for tree breeding programs.
Quantitative trait locus (QTLs) mapping is a powerful and increasingly accessible tool for characterizing the genetic basis of morphological and adaptive divergence (Tanksley, 1993). QTL maps provide both a broad outline of the genetics of evolutionary change and a first step toward the isolation and identification of the particular genes involved in phenotypic differentiation (Paterson et al., 1991; Mackay, 2001). Genetic and QTL analyses of leaf morphology and adaptive traits have been performed in the population of Eucalyptus nitens, Populus trichocarpa×P. deltoides and Pseudotsuga menziesii (Bradshaw et al., 1995; Wu et al., 1997; Byrne et al., 1997; Jermstad et al., 2001). Previous reports showed that leaf morphology and bud flush have been found to be under strong genetic control and some moderately large QTL effects have been detected. However, the inheritance and genetic mapping of leaf morphology and spring bud flush have not been demonstrated in P. tomentosa.
In this paper, we described the detection and location of QTLs controlling morphological and adaptive traits in a cross between two very close poplar varieties. The interval mapping software package MAPMAKER QTL (Lander et al., 1989) was used to generate the linkage maps and detect the QTLs. The results showed that genome-wide QTL mapping was a promising strategy for the discovery of new genes controlling morphological growth and adaptive traits in forest tree species.
2 Materials and Methods 2.1 Plant MaterialsThe QTL mapping population was founded in 2000 by interspecific backcross between "TB01" clone (P. tomentosa×P. bolleana) and "LM50"clone (P. tomentosa). The backcross progeny and the parents were grown at the nursery of Beijing Forestry University. 120 individuals were randomly selected from this population and used for the present QTL mapping study.
2.2 Methods 2.2.1 Linkage map constructionSeparate genetic linkage maps for "LM50" and "TB01" were constructed with AFLP markers using a pseudo-test-cross mapping strategy and the Kosambi mapping function (Zhang et al., 2004). To increase the number of informative markers available for QTL mapping, additional marker loci were added to the original maps using the "place" command with MAPMAKER 3.0, with the most likely marker placement accepted. The final framework map for "LM50" consisted of 247 markers ordered on 19 major linkage groups. The linked loci spanned approximately 3 265.1 cM of the poplar genome, with an average distance of 13.2 cM between adjacent markers (Fig. 1). For "TB01", the analysis resulted in 146 loci, mapping to 19 linkage groups and covering about 1 992 cM of the genome with an average distance between framework loci of 13.6 cM (Fig. 2).

|
Fig.1 AFLP linkage map of Populus tomentosa clone LM50 used for QTL mapping Only the 19 largest linkage groups were used. Marker names ending with "r" are in reverse linkage phase to those not so designated. |

|
Fig.2 AFLP linkage map of P. tomentosa×P. bolleana clone TB01 used for QTL mapping Only the 19 largest linkage groups were used. Marker names ending with "r" are in reverse linkage phase to those not so designated. |
Leaf morphological traits for leafblade length (LL), leafblade width (LW) and leaf petiole length (LPL) were measured in the October of 2001 in the field. Leaf area (LA) was determined with a Li-Cor 3100 leaf area meter (Bradshaw et al., 1995). The timing of spring bud flush was determined in the 2001 by twice-weekly inspection for the fully expanded leaf on the top stem.
2.2.3 QTL analysisBy underlying the backcross model, based on the individual linkage maps for clone "TB01" and clone "LM50", a LOD score threshold of 2.0 was used to declare the presence of a linked QTL in a given chromosome interval. Additive genetic effects attributed to individual QTL and the percentage of phenotypic variation explained by each QTL, were estimated with the software MAPMAKER/QTL.
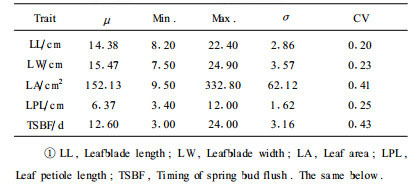
3 Results 3.1 Phenotypic trait analysisThe two original parent lines (P. tomentosa and P. bolleana) differed significantly with respect to leaf traits, including leaf size, shape and the timing of bud flush. The parent P. tomentosa was phenotypically superior over parent P. bolleana for leafblade length, leafblade width, leafblade area and leaf petiole length. For the date of spring bud flush, P. tomentosa was earlier than P. bolleana. The F1 (P. tomentosa×P. bolleana) clone "TB01" showed intermediacy between the two parents for all leaf traits studied. A segregating population was obtained when the F1 was backcrossed with the parental P. tomentosa clone "LM50". A comparison of the phenotypic characteristics of all traits indicated that there was great genetic variation in the P. tomentosa BC1 population for all traits (Tab. 1). The frequency distribution of phenotypes for each trait in the 120 interspecific BC1 families are shown in Fig. 3. All traits showed an approximately normal distribution. Hence, the population was meet for QTL analysis of leaf traits in P. tomentosa.
|
|

|
Fig.3 Phenotypic frequency distributions for five leaf traits in mapping population |
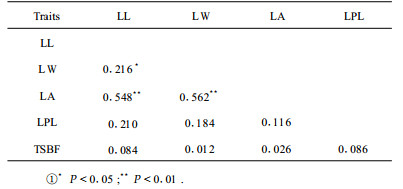
The correlation between two traits was estimated by regressing the phenotypic values of one trait onto those of the second trait. The correlation coefficients among the 5 traits are presented in Tab. 2. Significant associations were found between leafblade length, leafblade width and leafblade area. Both leafblade length and leafblade width were positively correlated with leafblade area. These correlations were highly statistically significant (P < 0.01; r=0.548 and r=0.562).
|
|
QTLs were detected at the threshold of LOD=2.0 using interval mapping with MAPMAKER/QTL, based on the separate parental linkage maps of clone "LM50" and "TB01". A total of 17 QTLs were identified for 5 leaf traits. These QTLs spanned nine linkage groups on the clone "LM50" map and three linkage groups on the clone "TB01". The proportion of phenotypic variation explained by each of these genomic regions varied from 7.6% (TBLG14) to 15.8% (TLG9). Tab. 3 summarized the number and direction of effect of QTL identified, together with their confidence intervals and the percentage of the additive genetic variation explained by each QTL for all traits.
|
|
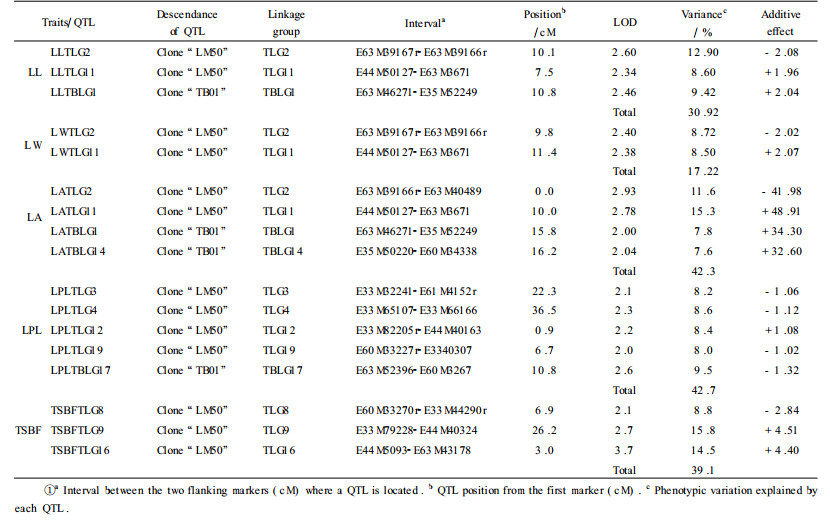
Fourteen putative QTLs associated with leaf morphology, including leafblade length, leafblade width, leaf area and leaf petiole length were identified, with ten on the "LM50" map and four on the "TB01" one. Between two and five statistically significant QTLs were detected for each of these traits (Tab. 3). These individual QTLs explained from 7.6% (on TBLG14) to 15.3% (on TLG11) of the total phenotypic variance and increased the phenotypic absolute values from 32.60 cm2 up to 48.91 cm2. Seven QTLs had positive impact on phenotypic values and another 7 had negative effects.
Co-localization of QTLs controlling correlated traits such as leafblade length, leafblade width and leafblade area were mainly found on linkage group TLG2 and TLG11 in the genetic map of clone "LM50" (Fig. 1), and on linkage group TBLG1 in the linkage map of clone "TB01" (Fig. 2).
3.2.2 Spring bud flushThree putative QTLs affecting the timing of bud flush were identified. One QTL each fell into linkage group TLG8, TLG9 and TLG16, respectively, on the paternal map for clone "LM50". The clone "LM50" alleles increased the number of days to bud flush at TSBFTLG9 and TSBFTLG16 and delayed it at the TSBFTLG8 loci. These individual QTLs explained 8.8% to 15.8% of the total phenotypic variation, and had a positive phenotypic effect of increasing the timing of bud flush by 4.51 and 4.40 days and a negative effect of increasing the number of days to bud flush by 2.84 days. Total phenotypic variation explained by all three putative QTLs was 39.1%. The largest effect was associated with TSBFTLG9, which had additive effects of 4.51 days that accounted for 15.8% of the phenotypic variance.
4 DiscussionMany of the growth, development and adaptation traits in forest trees exhibit continuous phenotypic variation and are inherited quantitatively. The use of molecular markers enables one to identify the map QTLs that are involved in the variation of such complex traits. A QTL mapping strategy could dissect quantitative genetic variation into several loci at the molecular level. Over the past decade, tremendous efforts were invested by many research groups worldwide in mapping a wide spectrum of quantitative genetic variation in nearly all important animals and agricultural crops onto their genome regions. In the case of forest tree species, considerable research efforts were focused on economically important traits such as stem growth, vegetative propagation, wood quality, adaptation and disease resistance. However, surprisingly little is known about the genetic basis of continuous variation for leaf traits in P. tomentosa. In order to elucidate this problem, we first developed the QTL analysis of leaf morphology and the timing of bud flush traits in an interspecific P. tomentosa BC1 population.
4.1 QTL analysis of leaf traits through pseudo-test-cross mapping strategyGrattapaglia and Sederoff (1994) put forward the mapping strategy of pseudo-test-cross through test-cross configuration and mapped the quantitative trait loci controlling growth and wood quality traits in Eucalyptus grandis (Grattapaglia et al., 1996). In the present study, quantitative trait loci affecting leaf morphology and the timing of bud flush traits were detected with genetic maps of clone "LM50" and "TB01". In this paper, we identified 17 putative QTLs which individually explained between 7.6% and 15.8% of the total genetic variation for five leaf traits in P. tomentosa BC1 population (Tab. 3). These results are consistent with classical quantitative genetics theory, that is, leaf morphology and spring bud flush in forest trees appear to be quantitative traits controlled by multiple genes. Estimates of the minimum number of QTLs involved, and their genome location, magnitude and direction of effect were obtained (Tab. 3).
The 17 QTLs found in our study were dispersed over nine linkage groups of "LM50" map and 3 linkage groups of "TB01". Considerable variation was observed in the number of QTLs detected per linkage group. For each of the linkage groups TLG3, TLG4, TLG8, TLG9, TLG12, TLG16, TLG19, TBLG14 and TBLG17, only one QTL was detected for all leaf traits. For TLG2, TLG11 and TBLG1, two or more QTLs spanning their genomic regions were detected (Tab. 3). For each QTL, the direction (positive or negative) of the allele's effect on the target trait was determined. For nine out of the 17 QTLs detected in our study, a positive additive effect on phenotypic value was observed. Of these 9 trait-improving QTLs, 6 (51%) had alleles derived from the clone "LM50", and trait-improving QTL alleles from the clone "LM50" were detected for all leaf traits. Based on the genomic regions of QTLs for leaf morphology and spring bud flush, these two traits seem to be controlled by separate genes.
Correlated traits often have QTLs mapping to the same genomic regions (Veldboom et al., 1994; Xiao et al., 1996), as was observed in the present study. In our study, three QTLs located at the linkage groups TLG2 (E63M39167r-E63M39166r), TLG11 (E44M50127-E63M3671) and TBLG1 (E63M46271-E35M52249). These QTLs were detected for the positive correlated leaf traits leafblade length and leafblade area, leafblade width and leafblade area, respectively. Trait correlations may result from either tight linkage of several genes controlling these traits or the pleiotropic effect of a single gene (Bradshaw et al., 1995; Agrama, 1996).
4.2 Strategy for improving leaf traits using QTL information in P. tomentosaThe identification of QTLs affecting leaf traits in P. tomentosa is an important step in the use of molecular markers for both understanding the genetic factors that determine these traits and genetically improving economically important forest trees. When a genetic map is available from earlier generations such as a first backcross, detection of significant marker-trait associations based on such maps will be useful for Marker-Assisted Selection (MAS) (Tanksley et al., 1996). Our results may provide useful information for P. tomentosa breeding. The parental lines showed marked differences for all leaf traits in the P. tomentosa backcross population, and the QTLs detected explained from 7.6% to 15.8% of the phenotypic variation by single QTL for leaf traits. Previous studies showed that MAS efficiency depended primarily on the heritability of the trait, on the population size and on the proportion of phenotypic variation associated with markers (Whittaker et al., 1995; Laurence et al., 1998). Compared with a previous QTL study done on the F2 progeny of P. trichocarpa×P. deltoides, where from 21.2% to 36.1% of phenotypic variation for leaf area was explained by a single QTL (Wu et al., 1997), the power to detect QTLs in our study was probably reduced due to our use of dominant molecular markers. Use of dominant markers leads to lower LOD scores and also to an under-estimation of the magnitude of explained variation if multiple alleles were segregated at a locus in offspring of out-breeding species (Eck et al., 1994).
The QTL detection with interval mapping strategy requires a large segregation population and effective MAS should have small distance between markers and QTLs (Laurence et al. 1998). In practice, however, population size cannot usually be very large in forest tree studies. In the present study, the population consisted of only 120 progeny. MAS is usually more effective when the distance between markers and QTLs is small (Laurence et al., 1998). Thus, it is important to note that putative QTLs detected in a small sample population and close to a marker sometimes show the same effect as a putative QTL detected in a large population and located at a longer distance from a marker (Lander et al., 1989). Nevertheless, small population size decreases the overall sensitivity of detecting QTLs. Consequently, only major QTLs are usually detected, and minor ones often remain unrevealed. In our study, several markers tightly linked to major QTLs were found. Detection of these markers should provide an opportunity to select promising genotypes at early seedling stages through MAS. However, further studies are necessary to confirm the effects and ability of these QTLs in different environments and years before we can recommend their sustained usage in the P. tomentosa breeding program.
Agrama H A. 1996. Sequential path analysis of grain yield and its components in maize. Plant Breed, 115: 343-346. DOI:10.1111/j.1439-0523.1996.tb00931.x |
Bradshaw H D, Stettler R F. 1995. Molecular genetics of growth and development in Populus Ⅳ: Mapping QTLs with large effects on growth, form, and phenology traits in a forest tree. Genetics, 139: 963-973. |
Byrne M, Murrell J C, Owen J V, et al. 1997. Identification and mode of action of quantitative trait loci affecting seedling height and leaf area in Eucalyptus nitens. Theor Appl Genet, 94: 674-681. DOI:10.1007/s001220050465 |
Castro-Diez P, Puyravaud J P, Cornelissen J H C. 2000. Leaf structure and anatomy as related to leaf mass per area variation in seedlings of a wide range of woody plant species and types. Oecologia, 4: 476-486. |
Eck H J van, Jacobs J M E, Stam P, et al. 1994. Multiple alleles for tuber shape in diploid potato detected by quantitative genetic analysis using RFLPs. Genetics, 137: 303-309. |
Frewen B E, Chen T H H, Howe G T, et al. 2000. Quantitative trait loci and candidate gene mapping of bud set and bud flush in Populus. Genetics, 154: 837-845. |
Grattapaglia D, Sederoff R R. 1994. Genetic linkage maps of Eucalyptus grandis and Eucalyptus urophylla using a pseudo-test-cross: mapping strategy and RAPD markers. Genetics, 137: 1121-1137. |
Grattapaglia D, Bertolucci F L G, Penchel R, et al. 1996. Genetic mapping of quantitative trait loci controlling growth and wood quality traits in Eucalyptus grandis using a maternal half-sib family and RAPD markers. Genetics, 144: 1205-1214. |
Jermstad K D, Bassoni D L, Jech K S, et al. 2001. Mapping of quantitative trait loci controlling adaptive traits in coastal Douglas-fir Ⅰ: Timing of vegetative bud flush. Theor Appl Genet, 102: 1142-1151. DOI:10.1007/s001220000505 |
Lander E S, Botstein D. 1989. Mapping Mendelian factors underlying quantitative traits using RFLP linkage maps. Genetics, 121: 185-199. |
Larson P R, Isebrands J G. 1971. The plastochron index as applied to development studies of cottonwood. Canadian Journal of Forest Research, 1: 1-11. DOI:10.1139/x71-001 |
Laurence M, Charcosset A, Hospital F, et al. 1998. Marker-assisted selection efficiency in populations of finite size. Genetics, 148: 1353-1365. |
Leverenz J W, Hinckley T M. 1990. Shoot structure, leaf area index and productivity of evergreen conifer stands. Tree Physiology, 6: 135-149. DOI:10.1093/treephys/6.2.135 |
Mackay T F C. 2001. Quantitative trait loci in Drosophila. Nat Rev Genet, 2: 11-20. |
Paterson A H, Damon S, Hewitt J D, et al. 1991. Mendelian factors underlying quantitative traits in the tomato: comparison across species, generations and environments. Genetics, 127: 181-197. |
Tanksley S D. 1993. Mapping polygenes. Annu Rev Genet, 27: 205-233. DOI:10.1146/annurev.ge.27.120193.001225 |
Tanksley S D, Grandillo S, Fulton T M, et al. 1996. Advanced backcross QTL analysis in a cross between an elite processing line of tomato and its wild relative L. pimpinellifolium. Theor Appl Genet, 92: 213-224. DOI:10.1007/BF00223378 |
Veldboom L R, Lee M, Woodman W L. 1994. Molecular marker-facilitated studies of morphological traits in an elite maize population Ⅱ: Determination of QTLs for grain yield and yield components. Theor Appl Genet, 89: 451-458. DOI:10.1007/BF00225380 |
Whittaker J C, Curnow R N, Haley C S, et al. 1995. Using marker-maps in marker-assisted selection. Genet Res, 66: 255-265. DOI:10.1017/S0016672300034698 |
Wu R, Bradshaw H D, Stettler R F. 1997. Molecular genetics of growth and development in Populus (Salicaceae) V. Mapping quantitative trait loci affecting leaf variation. American Journal of Botany, 84: 143-153. |
Xiao J, Li J, Tanksley S D. 1996. Identification of QTLs affecting traits of agronomic importance in a recombinant inbred population derived from a subspecific rice cross. Theor Appl Genet, 92: 230-244. DOI:10.1007/BF00223380 |
Zhang D, Zhang Z, Yang K, et al. 2004. Genetic mapping in (Populus tomentosa×P. bolleana) and P. tomentosa Carr. using AFLP markers. Theor Appl Genet, 108: 657-662. DOI:10.1007/s00122-003-1478-7 |