 2000, Vol. 36
文章信息
- WU RONG LING, YIN TONGM ING, HUANG MIN REN, WANG MING XIU
- 邬荣领, 尹佟明, 黄敏仁, 王明庥
- THE APPLICATION OF MARKER ASSISTED SELECTION TO TREE BREEDING
- 分子标记辅助选择在林木育种中的应用
- Scientia Silvae Sinicae, 2000, 36(1): 103-113.
- 林业科学, 2000, 36(1): 103-113.
-
文章历史
Received date: 1999-02-01
-
作者相关文章


2. 南京林业大学林木遗传和基因工程重点实验室 南京 210037
2. 2 College of Forest Resources and Environment, Nanjing Forestry University, Nanjing, Jiangsu 210037
A primary objective of tree breedingis to select for superior genotypes thatdisplay greatgrowth and productivi ty aswell asdesirable wood quality.Fora long time, the efficiency of tree breeding has critically relied on the appli-cation of quantitative genetics (Zobel and Talbert, 1984).The role of quantitative genetics as a theory and tool for guiding tree breeding is unavoidable for two practical reasons.First, most commercially important traits in forest trees, such as stem volume growth, fiber length and wood specific gravity, are quantitatively inherited and are assumed to be regulated by many genes, each with a smalleffectin an additive manner.Second, perhapsmore importantly, forest treesare characterized by long generationintervals, high heterozygosity and high genetic loads (Hamrick and Godt, 1990;Libby, 1992), which restrict the development of such classic genetic materials as inbred lines, collections of characterized mutants and marker stocks in these species.
In fact, these characteristics of forest trees, plus their big individual size and high heterogeneity of environments in which they are grown, also complicate the application of quantitative genetics to tree breeding. In the case where field trials are not established on uniform sites, the heritability for a quantitative trait is often underestimated as a result of environmental noises, which leads to reduced genetic gain when selection is performed. Also, difficulties in producing an adequately large family size for many species often give rise to an unbalanced mating design and, therefore, to biased estimates for genetic parameters (Namkoong and Roberds, 1974). Thus far, the main emphasis in tree genetic improvement has been on the manipulation of additive variance in quantitative traits of economical importance through simple phenotypic selection(Zobel and Talbert, 1984). Despite recent extensions of quantitative genetic theory, an understanding of how alleles interact within and between loci to produce non-additive effects, as well as the utilization of these non-additive effects, has been very limited in forest trees (Namkoong and Kang, 1990; Wu, 1996)
Molecular marker technologies have provided a new horzon for enhancing the theories and methods of quantitative genetics (Tanksley et al., 1989; Tanksley, 1993). By taking advantage of linkage disequilibria between the alleles of neutral markers and of functional quantitative trait loci (QTLs), these technologies can be used to identify individual QTLs that affect the genetic variation of a quantitative trait in a breeding population(Lander and Botstein, 1989). More recently, Wu et al. (1999c) have reviewed basic statistical methods used to map QTLs in forest trees. Some more complicated methods considering complex genetic architecture of forest trees have been proposed by Wu and Han (1999). The challenge now is how to intergrate molecular information into breeding schemes to develop an ef ficient marker-assisted selection (MAS) st rategy. The development of MAS offers a route to utilize the favorable alleles of these important QTLs in commercial populations.
2 Quantitative genetics:An overview 2.1 Genetic variance and heritabilityGenetic and environmental variances and covariances are estimated using the analysis of variance, an analytical method developed by R. A. Fisher in the 1920s. Analyses vary in complexity depending on the genetic st ructure of the experimental population and on the experimental design (i. e., the model), but always have certain features in common. First, the model must include ef fects due to genotype. Second, the model must include an error effect that allows for : (1) tests of the hypothesis that differences among genotypes are significantly different from zero, and (2)estimation of genetic variance and covariance components. Third, effects are usually assumed random if the analytical objectives are to estimate ef fects as variances and covariances.
Table 1 describes a simple analysis of variance model that allows for estimation of genetic, block, genotype × block interaction and residual variances in a clonally replicated field trial (see Wu et al., 1992 and Wu and Stettler, 1994; 1996; 1997; 1998 for examples). Genetic variance and covariance components are estimated by equating genetic expectations (expected mean squares) to observed mean squares(Table 1). The experimental design can be extended to multiple environments, which makes it possible to estimate variance and covariance due to genotype ×environment interaction.
|
|
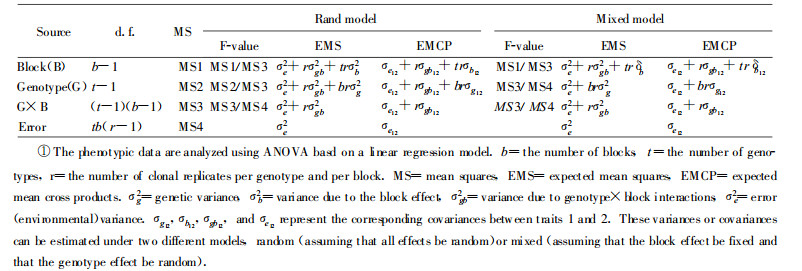
After genetic variance and covariance components are estimated, heritability and genetic correlations can then be estimated between a pair of quantitative traits. Heritability is a ratio of genetic variance to the total phenotypic variance, which can be expressed as narrow-sense heritability based on additive genetic variance or broad-sense heritability based on all genetic variance (Falconer, 1989). Genetic correlation describes the degree to which two cer-tain quantitative traits are genetically correlated throuth either pleiotropic effects or linkage, or both. Genetic correlation is expressed as the ratio of the genetic covariance between the two traits over the product of genecic standard deviations of the two traits (Falconer, 1989). These basic genetic parameters have been used to predict the genetic gain of a quantitative trait that is subject to artificial selection.
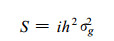
2.2 The prediction of response to selectionTruncation selection for a trait in a population can result in genetic response (R), which is the increase of the mean value of the progeny population (z1) relative to the parental population (z0) (Fig. 1).If the trait is completely controlled by genetic factors, the response to selection should equal the selection differential, S, i.e, the difference between the mean value of the individuals that are selected to produce the next generation (zS) and the mean value of the parental population (z0).Usually, R is less than S, because a quantitative traitisalso affected by environmental factors.The magnitude of R isexpressed as the function of selection intensity, i, (inversely proportional to the proportion of the individuals selected for breeding), narrow-sense heritability (h2), and genetic variance of a trait in the parental population (σg2) :

|
Fig.1 Truncation selection ina programof artificial selection for increase in trait z. In the parental generation, the trainmeanis.Indi-viduals in the stippled region above the truncation point z′are saved for breeding. Their meanis zS, so the selection differential is S =zS -z0.In the progeny generation, the mean hasincreased to z1, and truncation selection continues by breeding from the shaded portion above the truncation point z″.The seletion differential is then S′ =zS′ -z 1.The smaller proportion saved for breeding, the larger the selection differential |
|
When selection continues, one can obtain a cumulative genetic gain over generations.
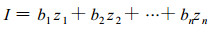
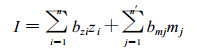
Genetic response can also be estimated for multiple selection criteria.When multiple criteria (say n) are utilized, selection is accomplished based on an index of the form:
|
where I is the index value for individual genotypes, bi are weights applied to each trait in the index and zi is the value of the ith trait.The bi are estimated through maximizing the correlation between the index and the aggregate estimated breeding values of genotypes (Smith, 1936;Hazel and Lush, 1942;Hazel, 1943) :

|
where b is a vector of index weights, P is the phenotypic covariance matrix, G is the genetic covariance matrix, and a isa vectorof economic weights giving the relative value of each traitin the same measurement scale asused forcovariance estimation.
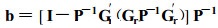
Various modifications of the Smith selection index have been developed to meet special selection objectives. One of the most useful modifications is the restricted selection index(Kempthorne and Nordskog, 1959; Tallis, 1962) that allows genetic change in one or more traits to be held to zero. The restricted selection index is calculated using the same genetic and phenotypic covariance matrices as in the unrestricted index except that they are esimated ac - cording to the matrix equation :
|
where b, P, and a are asbefore and Gr is a modified genetic covariance matrix where rows and columns corresponding to restricted trait have been deleted.
2.3 Quantitative genetics at the molecular levelDuring the past decade, the discovery and development of DNA markers have resulted in ex tensive mapping experiments aimed at the development of MAS in forest trees (Wu et al., 1999d).These mapping experiments move the study of quantitative genetics from the phenotype level to the molecular level, at which the net genetic variation of a quantitative trait is partitioned into individual QTL components. An understanding of geneitic variance at the molecula level will permit us to study the genes involoved in natural variation and to manipulate with greater precision the genes to be necessary for genetic improvement of commercially important traits.The molecular marker-based linkage maps aimed at the identification of important QTLs have been constructed for aspen (Liu and Furnier, 1993), poplar (Bradshaw et al., 1994; Yin et al., 1999; Wu et al., 1999b), eucalyptus (Marques et al., 1998), loblolly pine (Devey et al., 1994;Remington et al., 1999), slash pine (Nelson et al., 1993), maritime pine (Plomion et al., 1996), masson pine (Yin, 1997), and other forest trees, as well as in many crop plants and animal species
3 MAS:Breeding strategy incorporating molecular informationEfficient utilization of molecular marker technology to manipulate loci controlling quantitative traits (QTLs) is dependent on tight linkage between markers and QTLs, both for the identification of linkages and for the subsequent incorporation of the QTLs in breeding programs. The relative importance of Type I and Type II errors in identifying marker-QTL associations varies with the way in which the marker-QTL associations are to be used. The type of genetic control of a quantitative trait (a few loci with large effect, or a large number with smaller effects) determines the manner in which marker-QTL associations can be used through marker-assisted selection (MAS).
3.1 Small numbers of QTLsMAS, when only a small number of QTLs are involved, is similar to selecting for qualitative traits. The only difference is that the marker is not the gene of interest, but is linked to a QTL of interest. If close linkage of the molecular marker to the QTL can be established, favorable alleles can be incorporated into otherwise desirable cultivars or parental lines by backcrossing. The molecular marker is used to monitor the incorporation of the desirable alleles from the donor source. At the same time, selection for the molecular marker genotye of the recurrent parent can be used to speed the recovery of the recurrent parent genotype (Tanksley et al., 1989;Young and Tanksley, 1989). As is true for qualitative traits (see Fehr, 1987), backcrossing will be most effective when a small number of marker-QTL allele combination are involved.
If M isa markerallele linked to Q, a favorable QTLallele, then during backcrossing Mm heterozygotes can be maintained at a frequency of 0.5 by selection.However, the frequency of M allele which is also associated with Q allele will vary with the linkage between M and Q as shown in Fig. 2.If the recombination frequency (r) between the two loci is 0.5, only 50%of BC1 individuals which are M will also be Q.However, if r=0.01, 99%of BC1 individuals carrying M will also be Q.The greater the number of backcrosses, the more important it is to have a tight linkage between the marker and QTL.With r=0.01 between the marker and QTL, 97%of BC3 individuals carrying the desired marker allele would carry the desired QTL allele (Fig. 2)

|
Fig.2 Proportion of Mm backcross individuals which carry the favorable QTL allele under different recombination frequencies and backcross generations |
Tanksley et al. (1981) suggested an use of isozymes to select for the genotype of a recurrent parent in backcrossing. Paterson et al. (1988) suggested that use of marker information could reduce the number of backcrosses required by half. Young and Tanksley(1989) estimated that an introgressed segment could be reduced in two generations, by RFLP marker -assisted selection for recurrent parent genotype, to a size which would require 100 generations of backcrossing without MAS.
The backcrossing procedure is appropriate for traits controlled by a small number of loci. As the number of loci segregating for the trait increases, the number of backcross individuals which must be grown to have a high probability of recovering the favorable marker allele at all loci increases. The use of flanking markers has the advantage of providing tighter linkage of the QTL to the pair of markers but has the disadvantage of reducing the probability of finding all the favorable marker alleles in one individual. Because only a limited number of QTL alleles can be transferred in a backcrossing program, correct identification of marker-QTL associations is essential. Thus, Type Ierrors (a probability of falsely rejecting the null hypothesis of no QTL)are relatively important than Type II errors (a probability of falsely accepting the null hypothesis of no QTL). In general, a genome based αlevel of 0.05 rather a comparison -wise level of 0.05 for identifying marker-QTL associations, as suggested by Lander and Botstein (1989), seems appropriate.
The use of backcrossing to transfer favorable QTL alleles into a breeding population has been successful in tomato (De Vicente and Tanksley, 1993).The cultivated tomato (Lycopersicon esculentum) grows much faster than its wild relative L.pennellii.In an F2 progeny between these two species, two QTLs, dw1 (chromosome 1, extremely overdominant, the ratio of dominant to additive effects=233) and dw2 (chromosome 2, overdominant, the ratio of dominant to additive effects=6), that control the rate of dry matter accumulation were mapped using restricted fragment length polymorphism (RFLP) markers.The F2 individuals that are inferred to carry the favorable alleles for these two QTLs based on linked RFLP markers were transferred into an L.esculentum background via two sequential backcrosses to this parent.Because the BC1 plants used for the parents of BC2 were selected based on the L.esculentum alleles, the average BC2 individual contained a low percentage of L.pennellii alleles (15%).A BC2 population of 142 plants were established in which RFLP markers linked to both dw1 and dw2 were scored.It was found thatFRLP markers linked to the two QTLswere significantly associated withincrease in biomass accumulation.Moreover, the gene action of each QTL was the same as that observed in the F2 (i.e., the heterozygous individual had increased biomass production).These results indicate that both of the overdominant QTLs detected in the F2 have been transferred into the BC2 where most of the other L.pennellii alleles had been eliminated.QTLs detected in the F2 have been transferred into the BC2 where most of the other L.pennellii alleles had been eliminated.
Results from De Vicente and Tanksley' s (1993) study are encouraging for the genetic improvement of forest trees through interspecific hybridization (Stettler et al., 1996). Although interspecific F1 hybrids may display heterosis, hybridization is often accompanied by undesirable genes, a phenomenon referred to as linkage drag (Young and Tanksley, 1989). The use of molecular markers has provided a way to monitor and facilitate interspecific gene transfer and to mitigate linkage drag, improving the prospects for succssful hybridization between different species in forest trees. In a simulation study, it is demonstrated that marker-assisted backcrossing has greater efficiency to remove undesirable genes that are linked or unlinked to the target genes than a traditional backcrossing approach(Fig. 3). Hospital et al. (1997)discussed several theoretical issues related to backcrossing introgression, such as the numbers of markers and their relative positions with functional QTLs and populations size.

|
Fig.3 Comparison through sim ulation of backcrossbreeding using either a traditional approach or MAS. For traditional backcross breeding, " graphical" genotypes were generated for randomly selected individuals from various backcross generations derived from a single BC1 individual. For MAS, graphical genotypes were generated from a simulated RFLP-assisted backcross breeding program, 30 progeny were generated at each backcross generation and the best genotype was used as the parent for the next generation. (a)Rate of return to the recurrent parent genome in regions unlinked to genes being introgressed, indicating that MAS achieves complete conversion in only three backcrosses as compared to a minim um of six for conventional selection. Chromosomes are indicated by vertical bars. (b)Rate of return to the recurrent parent genome in regions of the chromosome flanking the target gene, indicating that MAS achieves the same level of conversion in only two backcrosses as would be achieved in 100 backcrosses through conventional methods.Adapted from Ribaut and Hoisington(1998) |
If the trait of interest is controlled by a large number of QTLs, some with small effect, the probability of identifying marker loci linked to all the QTLs is low. Thus, the question arises as to when selection with marker loci will be as effective as selection based on phenotype. Aselection index including both molecular marker information and phenotypic scores, each appropriately weighted, will always produce more prog ress from selection than phenotypic selection unless heritability of the trait is 1.0(Niemann-Sorenson and Robertson, 1961; Smith, 1967; Lande and Thompson, 1990; Lande, 1992). The index of an individual (I) withphenotypes zi, i=1, 2, …, n, and molecular scores mj, j=1, 2, …, n′, is written as:
|
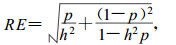
where bzi and bmj are the weight coefficients for the phenotype of the ith trait and the molecular information of the jth marker, respectively.Assuming that zi and I are normally distributed, the efficiency of this selection index (RE) (exprssed as a ratio of the rate of response in the mean phenotype per generation under index selection to the rate of response under conventional phenotypic selection) is derived as :
|
when a single trait and a single marker are considered.In the above equation, h2 is the heritability of the trait and p the proportion of the additive genetic variance in the trait that is associated with the marker locus.It can be seen that the efficiency of MAS is determined by h2 and p.MAS will be very efficient when a quantitative trait has a low heritability and if a substantial fraction of the additive genetic variance is associated with the markers.Smith (1967) showed MAS to be more efficient than phenotypic selection when the proportion of additive variance accounted forby the markerloci isgreater than the heritability of the trait.This comparison wasbased onequal selection intensities and equal time per generation for marker-assisted and phenotypic selection.The approriate comparisons forplant breeding applications need to consider relative selection intensities, time required per cycle, and pollination control for the two methods (Michelmore and Shaw, 1988).
In cases where a number of QTLs, each of relatively small effect, are being used for selection, Type II errors, failure to identify associations when they exist, become of greater importance. Whereas a Type Ierror reduces heritability associated with the marker loci, a Type II error will exclude genetic variance which is actually associated with marker loci and proclude selection at loci. Thus, the use of 0.05 or even 0.1 probability level for identifying marker-QTL associations may be appropriate.
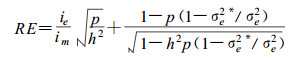
3.3 Early selectionDespite its significant importance in tree breeding, the efficiency of early selection has still been unclear. Quantitative genetics has been used to estimate the heritabilities of a uantitative trait and genetic correlations across different ages and further predict the efficiency of early selection (Namkoong and Kang, 1990; Wu et al., 1992). However, such prediction is not accurate because QTLs affecting early -mature correlations have not been incorporated (but see Wu et al., 1999a). MAS can be very useful to estimate the effectiveness and efficiency of early selection. When selection based on molecular markers at early stages (e. g., embryos or seedlings)is followed by conventional phenotypic selection of mature traits, the efficiency of this two -stage MAS is approximately (Lande and Thompson, 1990) :
|
where ie and im are the intensity of selection on molecular scores in the early stage and on mature phenotypes, respectively, and σe2and σe2* are the variances of molecular score in the early stage and after the early marker selection, respectively.If strong selection intensity at an early stage is used, σe2*will be close to σe2and, thus, RE is critically depend on the ratio of selection intensity at different stages and the squared root of the ratio of p to h2.The early selection strategy based on molecular markers can lead to substantial efficiency because the intensity of selection in early stage is generally set to be very strong in forest trees (Namkoong and Kang, 1990).
3.4 Multi-trait improvementTo date, most studies have concentrated on MAS for a single trait. Where marker effects are significant for more than one trait, selection for alleles affecting each trait in the desired direction should enhance simultaneous improvement for each trait. Alternatively, a selection index approach to simultaneous improvement of more than one trait could be applied to molecular marker information. Each of these alternatives has advantages and disadvantages. Use of only those loci with positive effects for both traits assures that both traits will be improved. However, it sacrifices potential gain for each trait individually and may limit prog ress for net worth. Assessing the efficiency of simultaneous improvement for multiple traits through MAS should be based on results from multi-trait mapping experiments in which genetic correlation among different traits is associated with specific pleiotropic or linked QTLs. The theory for multi-trait mapping can also be used to map QTLs which are responsible for genotype×environment interaction (Jiang and Zeng, 1995). More advanced theories and technologies should be developed for utilizing QTLs affecting multiple traits or genotype × environment interactions through the MAS strategy.
3.5 Factors affecting the efficiency of MASThere are many factors that affect the efficiency of MAS. These factors inclued :(1) gametic phase of QTLs, (2) re-evaluation of markers each generation, (3) total number of markers in the genome, (4) number of markers contributing to the index, (5)heritability of a trait and (6)population size. The influences of these factors on MAS have been studied using computer simulations (Hospital et al., 1992; 1997; Zhang and Smith, 1992; Gimelfarb and Lande, 1994)
The response of MAS is much larger if initial populations is in total coupling phase (where the effects of all QTL alleles on a chromosome are in the the same direction)than in total repulsion phase (where the effects of adjacent QTL alleles on a chromosome are in opposite directions). The efficiency of selection is substantially higher if genetic markers contributing to the molecular score are re-evaluated each generation than if they are evaluated only once. Increasing the numbers of markers on a chromosome or the numbers of markers included in the selection index does not necessarily result in more efficient selection and too many markers may actually lower the efficiency. The inclusion of too many markers would add much noise in estimation (Zhang and Smith, 1992).The efficiency of MAS declines noticeably with increasing heritability. This is expected since the phenotype becomes a better predictor of the individual' sgenotypic value when heritability is high and, hence, less information about the genetic value is gained by using genetic markers (Lande and Thompson, 1990; Zhang and Smith, 1992). Population size is the most important factor affecting the efficiency of MAS, which increases substantially with the increase of population size.
4 ConclusionsStrauss et al. (1992)argued that the main limitation of MAS might be the lacking of linkage disequilibria in forest tree populations. However, this seems not to be a problem because the obstacle of linkage equilibrium can be overcome by using divergent crosses. In a number of tree species, genetic linkage maps have been constructed based on linkage relationships among molecular markers (Wu et al., 1999d). Many simulation studies have demonstrated that MAS can effectively utilize the linkage disequilibrium between genetic markers and QTLs created by the cross of divergent lines (Zhang and Smith, 1992; Gimelfarb and Lande, 1994).
Although the actual potential of MAS in tree breeding is unclear, theory and results in crop plants suggest that it will work to increase the speed of backcross conversions and that it should be an effective aid to selection. MAS may be especially valuable for polygenic trait improvement in forest trees because this technique need not change the traditional breeding strategy currently used by tree breeders. Traditional phenotypic selection is not accurate but time-consuming. Through a molecular monitoring of genotypes, many individuals that do likely not perform well at lat estages of grow th should be culled off at early stages, even at embryo stages, which thus reduces the scale of progeny testing.
A number of experiments are now under way to construct genetic maps using molecular markers and to identify key QTLs for quantitative traits based on the map. The growing explosion of new molecular technology and applications should give rise to the development and revisions of MAS strategies.Recent efforts in comparative genetic analysis allow the identification across different plant species of gene sequences involved in the expression of target traits. The superior alleles identified among genomes at those target genes can be used as DNA markers to develop efficient screening techniques. Finally, technological developments, including automation, allele-specific diagnostics and DNA chips, will make MAS approaches based on large-scale screening much more powerful and effective.
AcknowledgmentsThe senior author thanks all members of the Forest Biotechnology Group at North Carolina State University for encouragement about writing this review. We are grateful to anonymous referees for constructive comments on an early version of this manuscript. This work is partly supported by the NCSU Biotechnology Industrial Associates and the National Natural Science Foundation of China(39770628).
Bradshaw, H.D., Jr., M.Villar, B. D.Watson, K. G. Otto, S. Stewart, and R.F. Stettler. 1994. Molecular genetics of grow th and development in Populus.III.A genetic linkae map of a hybrid poplar composed of RFLP, STS, and RAPD markers.Theor.Appl. Genet., 89: 551~ 558
|
Devey M.E., Fiddler T.A. , Liu B.H., Knapp S.J. , Neale D. B. . 1994. An RFLP linkage map for loblolly pine based on a three-generation outbred pedigree. Theor. Appl. Genet., 88: 273-278. |
De Vicente, M. C., and S. D. Tanksley.1993. QTL analysis of transgressive segregation in an interspecific tomato cross.Genetics, 134: 585~596
|
Falconer, D. S. 1989. Introduction to quantitative genetics, 4th edn.Longman Scientific and Technical, London
|
Fehr, W. R. 1987. Principles of cultivar development.Vol.1: Theory and technique.Macmillan Publishing Co., NY
|
Gimelfarb A., Lande R.. 1994. Simulation of marker assisted selection in hybrid populations. Genet.Res., 63: 39-47. DOI:10.1017/S0016672300032067 |
Hamrich, J. L., and M. J. W. Godt 1990.Allozyme diversity in plant species, p. 43-63. In: H. D. Brow n, T. Clegg, A. L.Kahler and B. S.Weir (eds.), Plant population genetics, breeding and genetic resources.Sinauer Assoc., Sunderland, Mass
|
Hazel L.N.. 1943. The genetic basis for constructing selection indexes. Genetics, 28: 476-490. |
Hazel L.N., Lush J. L.. 1942. The efficiency of three methods of selection. J. Hered., 33: 393-399. DOI:10.1093/oxfordjournals.jhered.a105102 |
Hospital F, Charcosset A.. 1997. Marker-assisted introgression of quantitative trait loci. Genetics, 147: 1469-1485. |
Hospital F., Chevalet C., Mulsant P.. 1992. Using markers in gene introgression breeding programs. Genetics, 132: 1199-1210. |
Jiang C., Zeng Z.-B. . 1995. Multiple trait analysis of genetic mapping for quantitative trait loci. Genetics, 140: 1111-1127. |
Kempthorne O., Nordskog A. W.. 1959. Restricted selection indices. Biometrics, 16: 10-19. |
Lande, R. 1992.Marker-assisted selection in relation to traditional methods of plant breeding, p. 437~ 452.In: H. T. Stalker, and J. P.Murphy (eds.), Plant breeding in the 1990s. CAB International, Wallingford, UK
|
Lande, R., and R. Thom pson. 1990. Efficiency of marker-assisted selection in the improvement of quantitative. Genetics 124: 743~ 756 Libby, W. J. 1992. Use of genetic variation for breeding forest trees, p. 101 ~ 117。In: H. T. Stalker, and J. P. Murphy Lander, E. S., and D. Botstein. 1989. Mapping Mendelian Factors underling quantitative traits using RFLP linkage maps. Genetics 121: 185~ 199 (eds.), Plant breeding in the 1990s. CAB International, Wallingford, UK
|
Lande, R., and R. Thompson. 1990. Efficiency of marker-assisted selection in the improvement of quantitative traits. Genetics 124: 743~ 756
|
Libby, W. J. 1992.Use of genetic variation for breeding forest trees, p. 101~ 117.In: H. T. Stalker, and J. P. Murphy (eds.), Plant breeding in the 1990s. CAB International, Wallingford, UK
|
Liu Z., Furnier G. R.. 1993. Inheritance and linkage of allozymes and RFLPs in tembling aspen. J. Hered., 84: 419-424. DOI:10.1093/oxfordjournals.jhered.a111365 |
Marques C.M., Araujo J.A. , Ferreira J.G., Whetten R., O' Malley D.M. , Liu B.-H., Sederoff R.. 1998. AFLP genetic maps of Eucalyptus globulus and E.tereticornis. Theor. Appl.Genet., 96: 727-737. DOI:10.1007/s001220050795 |
Mather, K.and L.Jinks. 1982.Biometrical genetics, 3rd edn. Chapman &Hall, London
|
Michelmore R.W., Shaw D. V.. 1988. Quantitative genetics: Character dissection. Nature, 335: 672-673. DOI:10.1038/335672a0 |
Moreau L, Charcosset A., Hospital F., Gallais A.. 1998. Marker-assisted selection efficiency in populations of finite size. Marker-assisted selection efficiency in populations of finite size.Genetics, 148: 1353-1365. |
Namkoong G., Kang H.. 1990. Quantitative genetics of forest trees. Plant Breed Rev., 8: 139-188. |
Namkoong G., Roberds J.. 1974. Choosing mating designs to efficiently estimate genetic variance components for trees. Silvae Genet., 23: 45-53. |
Neimann-Sorenson A., Robertson A.. 1961. The association betw een blood groups and several production characters in three Danish cattle breeds. Acta Agric.Scand., 11: 163-196. DOI:10.1080/00015126109433054 |
Nelson C.D., Nance W.L. , Doudrick R. L. . 1993. A partial genetic linkage map of Slash pine (Pinuselliotti Englem var.elliottii)based on random amplified polymorphic DNAs. Theor. Appl. Genet., 87: 145-151. |
Paterson A.H., Lander E.S., Hewitt J.D., Paterson S., Lincoln S.E., Tanksley S. D.. 1988. Resolution of quantitative traits into Mendelian factors by using a complete RFLP linkage map. Nature, 335: 721-726. DOI:10.1038/335721a0 |
Plomion C., Durel C.-E., O' Malley D. M.. 1996. Genetic dissection of height in maritime pine seedlings raised under accelerated grow th conditions. Theor. Appl. Genet., 93: 849-858. |
Remington D.L., Whetten R.W., Liu B.-H., O′ Malley D. M.. 1999. Construction of an AFLP genetic map with nearly complete genome coverage in Pinus taeda. Theor Appl Genet, 98: 1279-1292. DOI:10.1007/s001220051194 |
Ribaut J.-M., Hoisington D.. 1998. Marker-assisted selection: new tools and strategies. T rend.Plant Sci., 3: 236-239. DOI:10.1016/S1360-1385(98)01240-0 |
Smith H.F.. 1936. Adiscriminant function for plant selection. Ann.Eugen., 7: 240-250. DOI:10.1111/j.1469-1809.1936.tb02143.x |
Smith C.. 1967. Improvement of metric traits through specific genetic loci. Anim.Prod., 9: 349-358. |
Stettler, R. F., L. Zsuffa, and R. Wu.1996. The role of hybridization in the genetic manipulation of Populus, p.87 ~ 112. In: R. F.Stet-tler, H. D.Bradshaw, Jr., P. E. Heilman, and T. M. Hinckley (eds.), Biology of Populus and its implications for management and con-servation. NRC Research Press, National Research Council of Canada, Ottawa, ON
|
Strauss S.H., Lande R., Namkoong G.. 1992. Limitations of molecular-marker-aided selection in forest tree breeding. Can.J.For. Res., 22: 1050-1061. DOI:10.1139/x92-140 |
Tallis G.M. 1962. Aselection index for optimum genotype. Biometrics, 18: 120-122. DOI:10.2307/2527716 |
Tanksley S.D. 1993. Mapping genes. Annu.Rev. Genet., 27: 205-233. DOI:10.1146/annurev.ge.27.120193.001225 |
Tanksley S.D., Medina-Filho H., Rick C. M. . 1981. The effect of isozyme selection on metric characters in an interspecific backcross of tomato: Basis of an early screening procedure. Theor.Appl. Genet., 60: 291-296. DOI:10.1007/BF00263721 |
Tanksley S.D., Young N.D., Paterson A.H., Bonierbale M. W.. 1989. RFLP mapping in plant breeding: new tools for an old science. Bio Technology, 7: 257-264. |
Westman, A. L., and S. Kresovich.1997.Use of molecular marker techniques for description of plant genetic variation, p. 9 ~ 48.In: J. A. Callow, J. A.Ford-Lloyd, and H. J.Newbury (eds.), Biotechnology and plant genetic resources: Conservation and use.CAB Interna-tional, Oxford, UK
|
Wu R.L. 1996. Detecting epistatic genetic variance with a clonally replicated design:Models for low-vs. high-order nonallelic interaction. Theor. Appl.Genet., 93: 102-109. |
Wu R.L., Bradshaw H.D. , Stettler R. F. . 1999a. Developmental quantitative genetics of grow th in Populus. Theor. Appl. Genet., 97: 1110-1119. |
Wu, R. L., and Y. F.Han.1999.Genetic mapping of quantitative trait loci underlying complex genotype-phenotype relationships in forest trees. Silvae Genet., 47(in press)
|
Wu, R. L., Y. F.Han, J. J. Fang, L.Li, M. L.Li, and Z.-B. Zeng. 1999b. An integrated linkage map of Populus based on AFLP markers.Theor.Appl. Genet., (in review)
|
Wu, R. L., H. X. Liu, and Y. F. Han. 1999c. Statistical methods formapping quantitative trait loci in forest trees. Scient. Scient. Silvae Sini.,35(2): 100 ~ 117
|
Wu, R. L., Z.-B. Zeng, S. E.McKeand, S. E., and D.M. O ′ Malley. 1999d.The case for molecular mapping in forest trees.Plant Breed. Rev., (in press)
|
Wu R.L., Stettler R. F. . 1994. Quantitative genetics of grow th and development in Populus. I. Athree-generation comparison of tree ar-chitecture during the first two years of grow th.Theor. Appl. Genet., 88: 1046-1054. |
Wu R.L., Stettler R. F. . 1996. The genetic resolution of juvenile canopy structure andfunction in a three-generation pedigree of Populus. Trees, 11: 99-108. |
Wu R.L., Stettler R. F. . 1997. Quantitative genetics of grow th and development in Populus. II.The partitioning of genotype×environ-ment interaction in stem grow th. Heredity, 78: 124-134. |
Wu R.L., Stettler R. F.. 1998. Quantitative geneticsof grow th anddevelopment in Populus. III. Phenotypic plasticity of crow nstructure and function. Heredity, 81: 299-310. |
Wu R.L., Wang M.X., Huang M. R. . 1992. Quantitative genetics of yield breeding for Populus short rotation culture. I. Dynamics of genetic control and selection models of yield traits. Can. J.For.Res., 22: 175-182. |
Yin D.M., Huang M.R. , Wang M.X. , Zhu L.H. , Zhai W.X. . 1997. Construction of moleular linkage map in masson pine using RAPD markers and megagametophy tes from a single tree. Acta Botanica Sinica, 39(7): 607-612. |
Yin, D. M., M. R. Huang, M. X. Wang, L. H. Zhu, P He, W. X. Zhai. 1999. RAPD Linkage mapping in a Populus adenopoda ×Populusalba F1 Family.Acta Botanica Sinica (in press)
|
Young N.D., Tandsley S. D.. 1989. RFLP analysis of the size of chromosomal segments retained around the Tm-2 locus of tomato during backcross breeding. Theor. Appl.Genet., 77: 353-359. DOI:10.1007/BF00305828 |
Zhang W., Smith C. . 1992. Computer simulation of marker-assisted selection utilizing linkage disequilibrium. Theor.Appl. Genet., 83: 813-820. |
Zobel, B., and J.Talbert. 1984.Applied tree im provement.John Wiley & Sons, New York
|