
Enhancing External Combustion Efficiency in Stirling Engine Combustors: Influence of Oxygen Atmosphere, Ejection Ratio, and Pressure
https://doi.org/10.1007/s11804-024-00451-0
-
Abstract
Knowing the optimal operating parameters of Stirling engines is important for efficient combustion through adaptability to changed pressures and oxygen atmospheres. In this study, the optimum operating conditions for efficient combustion in a singular Stirling engine combustor at different oxygen atmospheres were investigated and determined. Numerical simulations were performed to investigate the effects of ejection ratio and pressure on combustion performance. In an oxygen/carbon dioxide atmosphere, the results show that increasing the ejection ratio substantially alters the flame distribution in the Stirling engine combustor, increasing heat transfer and external combustion efficiency. In contrast, increasing the ejection ratio reduces the average and maximum temperatures of the Stirling engine combustor. Increased pressure affects the flame distribution in the Stirling engine combustor and impedes the flow and convective heat transfer in the combustor, reducing the overall external combustion efficiency at pressures above 6.5 MPa. In an air/carbon dioxide atmosphere, an increased ejection ratio reduces the average and maximum temperatures in the Stirling engine combustor. However, the overall flame distribution does not change substantially. The external combustion efficiency tends to increase and then decrease because of two opposing factors: the increase in the convective heat transfer coefficient and the decrease in the temperature difference. Increasing pressure inhibits forced convection heat transfer in the Stirling engine combustor, reducing external combustion efficiency, which drops from 78% to 65% when pressure increases from 0.2 MPa to 0.5 MPa.Article Highlights● The study provides insight into the ideal operating conditions for efficient combustion of Stirling engine combustors in different oxygen environments.● The effects of ejection ratio and pressure on combustion performance are investigated through a series of numerical simulations, providing new insights into the combustion processes within these engines.● Varying the ejection ratio in different atmospheres affects the flame distribution, as well as changing the heat transfer and the external combustion efficiency of the Stirling engine.● Higher pressures adversely affect flame distribution and convective heat flow within the combustor, thereby reducing overall external combustion efficiency. -
1 Introduction
The Stirling engine is a type of external heating engine (Solomon and Qiu, 2018). Theoretically, the Stirling engine has the highest thermal efficiency of all heat engines because its ideal efficiency is equal to the Carnot efficiency (Thombare and Verma, 2008). Stirling engines offer several unique advantages, including high efficiency, low noise, stability, and low emissions, as well as the flexibility to use different fuels (Ahmed et al., 2020; Kongtragool and Wongwises, 2003; Hachem et al., 2018).
An optimization direction of future Stirling engines is toward increasing the conversion efficiency of heat to mechanical or electrical energy (Buhre et al., 2005; Gao et al., 2019; Kongtragool and Wongwises, 2007), building more accurate mathematical models (Petrescu et al., 2002; Campos et al., 2012), and developing more sophisticated and accurate algorithms (Gheith et al., 2015; Costea and Feidt, 1998; Xiao et al., 2014). Cardozo et al. (2014) evaluated the effect of pressure on combustion efficiency. They found that the pressure affected temperature and heat absorption, and the optimization of these factors achieved an overall system efficiency of 72%. Researchers have studied the heat transfer medium and heating tube configuration of Stirling engines. Zhang et al. (2016) investigated the feasibility of using powder as a heat transfer medium in a Stirling engine for a renewable combined heat and power system and demonstrated that particle motion and mixing in a fluidized bed is not hindered by finned heat exchanger tubes and that high-efficiency particle motion and mixing as well as good external heat transfer can be achieved. Another direction of optimization is to expand the application range of Stirling engines in industry and applications. Because of its unique advantages, the Stirling engine is an ideal solution for efficient energy conversion, e. g., power generation (Cheng and Huang, 2021), medical devices, waste-to-energy conversion (Song et al., 2015), space propulsion, high-altitude power supplies, and cogeneration systems (Hafez et al., 2016; Mancini et al., 2003). Using different fuels or oxidizers, Stirling engines can be adapted for use in different industries and applications. For instance, Nishiyama et al. (2007) designed a combined heat and power system using a pulverized coal combustion process. They verified the performance and efficiency of this system using wood powder as fuel through combustion tests. In most application scenarios, Stirling engine burners can draw air directly from the external environment for combustion; no special storage or delivery systems are required, and air combustion is safer and less likely to cause fires or explosions. High-pressure oxygen combustion can recover and recycle more heat energy, thus improving the external combustion efficiency (Hong et al., 2009). Tu et al.(2015) performed numerical simulations and experimental studies on oxygen-fuel flameless combustion and found that oxygen combustion results in higher thermal efficiency and better flame stability and ignition characteristics. Meanwhile, pressurized oxygen combustion has a higher potential for carbon capture and storage (Deng et al., 2022; Xia et al., 2016).
As discussed, the existing literature primarily addresses the performance of Stirling engines within a singular atmospheric condition, typically air or oxygen. However, considering the distinct advantages associated with air and oxyfuel combustion, how to strategically leverage these advantages based on real-world operational scenarios remains an open question. In this study, the performance of a multiatmosphere Stirling engine combustor is investigated using numerical simulation, focusing on the effects of ejection ratio and pressure on the performance in different oxygen atmospheres. The results guide the development of Stirling engine combustors adapted to different oxygen atmospheres.
2 Numerical methods
Numerical analysis is performed using Ansys Fluent with the finite volume method. The basic set of conservation equations includes the conservation of mass (Li and Ju, 2022), conservation of momentum (Kazemi et al., 2021), and conservation of energy (Jia and Zong, 2022).
The governing equations of conversation of mass are given as Eq. (1):
$$ \partial \rho / \partial t+\left(\rho v_i\right) / \partial x_i=Q $$ (1) where ρ is the density of matter; vi is the velocity in the direction of scale i; Q is the mass source term; t is time.
The governing equations of conversation of momentum are given as Eq. (2):
$$ \begin{aligned} \frac{\partial}{\partial t}\left(\rho v_i\right) & +\frac{\partial}{\partial x_j}\left(\rho v_j v_i\right)=-\frac{\partial p}{\partial x_i}+\frac{\partial \tau t_{j i}}{\partial x_j}+\rho g_i \\ & +\sum\limits_k \frac{\rho_k}{t_{r k}}\left(v_{k i}-v_i\right)+v_i G+F_i \end{aligned} $$ (2) where p is the static pressure; vi is the velocity in the direction of scale i; ρ is the density of the mixture; G is the mass source term; t is time; ρgi denotes the buoyancy-affected gravitational term. $\sum_k \frac{\rho_k}{\tau_{r k}}\left(v_{k i}-v_i\right)+v_i G+F_i$ denotes the interacting force source term, and ∂τji denotes the stress tensor.
The governing equation for energy conservation is Eq. (3):
$$ \frac{\partial(\rho T)}{\partial t}+\operatorname{div}(\rho v T)=\operatorname{div}\left(\frac{k}{c_p} \operatorname{grad} T\right)+\frac{S_T}{c_p} $$ (3) where S T = Sh + φ, Sh = ρq is the heat contribution per unit volume from the heat source or due to radiation or other physical and chemical causes. φ is the portion of mechanical energy converted to thermal energy because of viscous action, called the dissipation function.
The model based on the Reynolds-averaged N–S system of equations is used in this paper (Rizk et al., 2023). The sub-model of the turbulence model adopts the most widely used realizable k − ε model, a deformation of the standard k − ε model. Mathematical constraints are used to improve the performance of this model, which can predict the cyclonic flow more accurately (Nagao et al., 2020).
The k − ε equation requires a regularized wall function, and in this study, we chose to use the standard wall function that is most widely used at high Reynolds numbers, which uses the typical logarithmic law (Li et al., 2023).
$$ U^*=\frac{1}{\kappa} \ln \left(E y^*\right) $$ (4) $$ U^*=\frac{U_P C_\mu^{1 / 4} k_P^{1 / 2}}{\tau_w / \rho} $$ (5) $$ y^*=\frac{\rho C_\mu^{1 / 4} k_P^{1 / 2} y_P}{\mu} $$ (6) where k = 0.418 7 is the Kamen constant; E = 9.793 is an empirical constant; Up and kp are the velocity turbulent kinetic energy, respectively, at the center of the grid immediately adjacent to the wall; μ is the kinetic viscosity (Zhang et al., 2022).
In this paper, oxygen, carbon dioxide, and water are chosen as detection values, and the calculation converges when their absolute errors are set to less than 0.001 (Ghamari et al., 2022).
The Stirling engine combustor comprises several components: cyclone chamber, injector, igniter, combustion chamber, heat exchanger, flame baffle, and exhaust gas recirculation. To facilitate calculation, this study simplifies the structure of the Stirling engine combustor based on practical considerations. Figure 1 depicts a schematic of the combustor. The upper portion of the computational domain represents the cyclone chamber, with a mass flow inlet set as the inlet boundary condition. The lower portion of the combustor corresponds to the compact heat transfer tube region and is replaced by a porous media zone. The porous media model is used to simulate the influence of the heater tube on flow and heat transfer. The flue gas outlet and the flue gas recirculation outlet of the combustor are defined as pressure outlets.
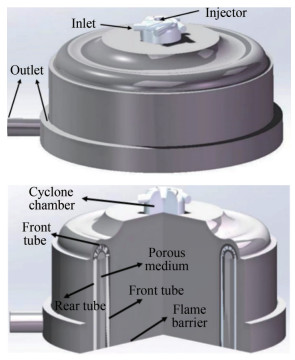 Figure 1 Structure of the combustor
In this study, the combustion system introduces highpressure oxygen or air through the injector. However, oxyfuel combustion or air-fuel combustion leads to high temperature inside the combustor, so to control the combustion temperature inside the combustor, a certain amount of recirculated flue gas must be introduced to form a mixture to participate in the combustion, forming two combustion atmospheres: an oxygen/carbon dioxide atmosphere and an air/carbon dioxide atmosphere. The study sets the air/carbon dioxide atmosphere pressure range between 0.2 MPa and 0.6 MPa and the oxygen/carbon dioxide atmosphere pressure range between 5.0 MPa and 7.0 MPa. These pressures consider external combustion efficiency; meanwhile, CO2 at 5.0–7.0 MPa can be directly liquefied at room temperature and compressed under much lower energy consumption (Yan et al., 2012). The ejection ratio is the ratio of the recirculated exhaust gas to the intake gas (air or oxygen). According to the existing Stirling engine combustor and certain experimental calculations, the ejection ratio is 7.0–9.0 in the oxygen/carbon dioxide atmosphere and 0.2–0.6 in the air/carbon dioxide atmosphere. The gas phase boundary conditions for these models are found in Tables 1 and 2. Table 1 presents the parameters for the oxygen/carbon dioxide atmosphere, whereas Table 2 describes those for the air/carbon dioxide atmosphere. In conditions 1–5, the ejection ratio is adjusted without changing the pressure, fuel, or oxidizer supply. In conditions 6–8, the pressure is changed without changing the ejection ratios, fuel, or oxidizer supply.
Table 1 Boundary conditions of the gas phase in the oxygen/carbon dioxide atmosphereCondition No.1 No.2 No.3 No.4 No.5 No.6 No.7 No.8 Ejection ratio 7.0 7.5 8.0 8.5 9.0 8.0 8.0 8.0 Pressure (MPa) 6.5 6.5 6.5 6.5 6.5 5.0 6.0 7.0 Fuel intake (kg/h) 3.2 3.2 3.2 3.2 3.2 3.2 3.2 3.2 Oxygen intake (kg/h) 11.8 11.8 11.8 11.8 11.8 11.8 11.8 11.8 Recirculating flue gas intake (kg/h) 82.9 88.9 94.8 100.0 112.0 94.8 94.8 94.8 Percentage of oxygen (%) 16.4 15.7 15.1 14.5 13.6 15.1 15.1 15.1 Percentage of carbon dioxide (%) 57.7 58.1 58.6 59.0 59.6 58.6 58.6 58.6 Percentage of water vapor (%) 25.9 26.1 26.4 26.5 26.8 26.4 26.4 26.4 Table 2 Boundary conditions of the gas phase in the air/carbon dioxide atmosphereCondition No.1 No.2 No.3 No.4 No.5 No.6 No.7 No.8 Ejection ratio 0.2 0.3 0.4 0.5 0.6 0.5 0.5 0.5 Pressure (MPa) 0.2 0.2 0.2 0.2 0.2 0.3 0.4 0.5 Fuel intake (kg/h) 3.2 3.2 3.2 3.2 3.2 3.2 3.2 3.2 Air intake (kg/h) 66.7 66.7 66.7 66.7 66.7 66.7 66.7 66.7 Recirculating flue gas intake (kg/h) 13.3 20.0 26.7 33.3 40.0 33.3 33.3 33.3 Percentage of oxygen (%) 19.5 18.1 16.9 15.9 15.0 15.9 15.9 15.9 Percentage of carbon dioxide (%) 2.9 4.0 5.0 5.8 6.5 5.8 5.8 5.8 Percentage of water vapor (%) 1.3 1.8 2.2 2.6 2.9 2.6 2.6 2.6 To ensure accurate calculations, a grid-independence analysis is conducted. Because of the complex geometry and the considerable size differences between each part, four different grid cell numbers are tested for verification: 4.3 million cells, 4.6 million cells, 5.0 million cells, and 5.6 million cells. Grid independence is assessed by examining the magnitude of the average temperature within the combustor. Figure 2 displays the average temperature inside the combustor for the various grid cell numbers. The difference remains below 1% with changed cell numbers. Considering accuracy and computational efficiency, 4.3 million grid cells are used for all the subsequent numerical simulations.
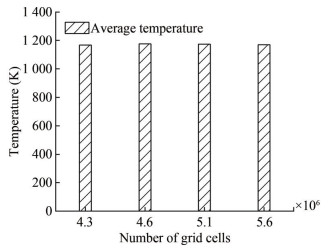 Figure 2 Average temperature in the combustor with different grid cell numbers
The temperature distribution in the combustor has an important effect on the combustion performance of the Stirling engine. To verify the accuracy of the simulation, a specific type of Stirling engine combustor is tested using multi-point thermocouple temperature measurements. Six measurement points are selected at three different heights between the front and rear rows of heating tubes, as depicted in Figure 3. The experimental conditions include a fuel injection flow rate of 3.2 kg/h, an ejection ratio of 8.5, and a pressure of 6.5 MPa. Diesel is used as the fuel in the temperature measurement tests. Figure 3 compares the experimental and the simulated results. The maximum error obtained is 7.4%, which satisfies the calculation requirements and confirms the accuracy of the simulation results.
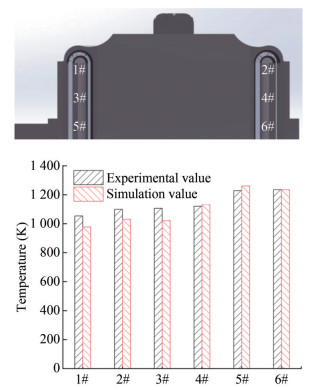 Figure 3 Temperature at multiple measurement points
3 Results and discussion
Combustor performance evaluation involves temperature and velocity distribution analyses as well as external combustion efficiency. In this study, we examined the temperature and velocity distributions at different ejection ratios and pressures to identify the optimal distributions for favorable heat transfer characteristics. In addition, we analyzed the heat transfer process and external combustion efficiency to improve external combustion efficiency.
3.1 Effect of the ejection ratio on the temperature and velocity fields
Figure 4 illustrates the temperature distribution in the combustor at different ejection ratios in the oxygen/carbon dioxide atmosphere. For ejection ratios of 7.0, 7.5, and 8.0, the high-temperature region is concentrated in the cyclone chamber and the top region of the combustor. In contrast, for the ejection ratios of 8.5 and 9.0, the flame assumes a horn shape within the combustor, with the high-temperature area concentrated at the center. Generally, as the ejection ratio increases, the flame gradually moves from the top to the center of the combustor. This shift is due to the higher inlet gas flow and greater axial velocity after the cyclone chamber, resulting in the relocation of the combustion area toward the center. Table 3 presents the average and maximum temperatures in the combustor for different ejection ratios. The average and maximum temperatures decrease with increasing ejection ratio.
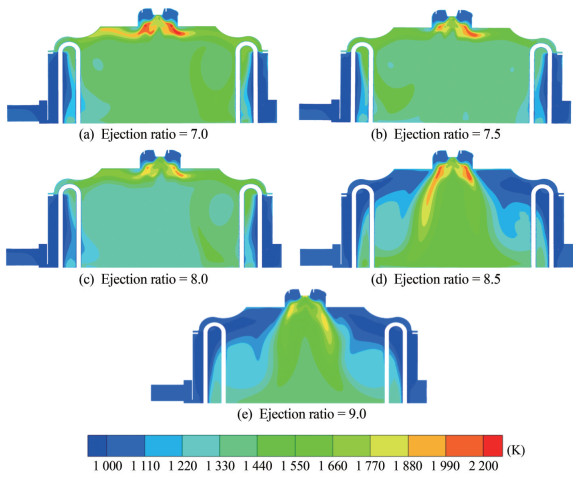 Figure 4 Temperature distribution with different ejection ratios in the oxygen/carbon dioxide atmosphereTable 3 Maximum and average temperatures in the combustor in the oxygen/carbon dioxide atmosphere
Ejection ratios 7.0 7.5 8.0 8.5 9.0 Maximum temperature (K) 2 280.3 2 258.1 2 215.3 2 267.4 2 150.1 Average temperature (K) 1 235.4 1 220.9 1 167.1 1 062.4 1 052.6 Figure 5 shows the velocity distribution for different ejection ratios in the oxygen/carbon dioxide atmosphere, clarifying the flow characteristics within the combustor as the ejection ratio increases. Compared to the temperature distribution, the velocity distribution shows a more pronounced reflux at the bottom of the combustor for ejection ratios above 8.5, which exerts a greater influence on the bottom region. Figure 6 presents the axial velocity at different ejection ratios. The maximum velocity within the combustor increases with the ejection ratio. For all ejection ratios, the velocity increases and then decreases as the height decreases, reaching its peak at a height of 0.12 m. When the ejection ratios are 7.0, 7.5, or 8.0, the velocity remains almost constant at 0.2 m/s below a height of 0.11 m. However, for ejection ratios of 8.5 and 9.5, the velocity at a given height increases substantially.
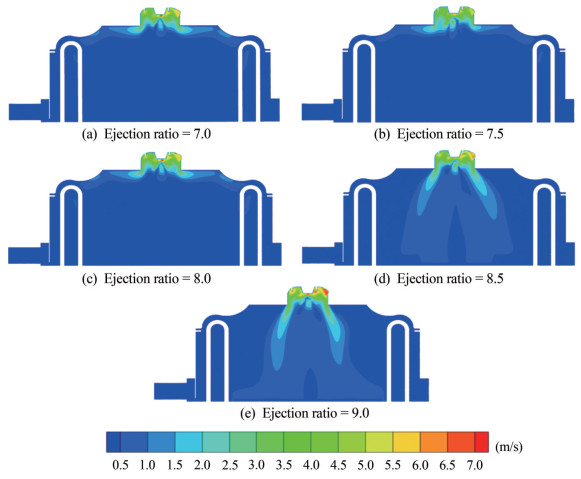 Figure 5 Velocity distribution of different ejection ratios in the oxygen/carbon dioxide atmosphere
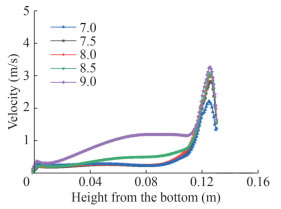 Figure 6 Axial velocity distribution at different ejection ratios in the oxygen/carbon dioxide atmosphere
Figure 7 shows the temperature distribution in the air/ carbon dioxide atmosphere for different ejection ratios, and the high-temperature region presents a similar distribution for all the ejection ratios. The temperature at the top of the combustor and the porous medium is maintained at approximately 1 000 K. In contrast, the center of the combustor is maintained at over 1 600 K. Table 4 provides the maximum and average temperatures in the combustor for the air/carbon dioxide atmosphere. Increasing the ejection ratio from 0.2 to 0.6 decreases the maximum and average temperatures by 520 K and 210 K, respectively.
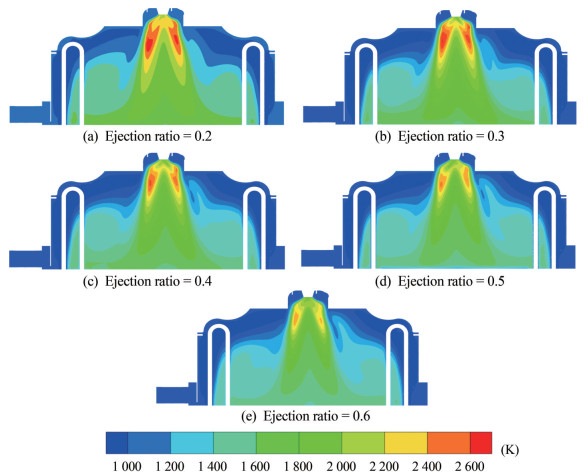 Figure 7 Temperature distribution at different ejection ratios in the air/carbon dioxide atmosphereTable 4 Maximum and average temperatures in the combustor in the air/carbon dioxide atmosphere
Ejection ratios 0.2 0.3 0.4 0.5 0.6 Maximum temperature (K) 2 512.4 2 129.1 2 085.1 2 057.4 1 992.1 Average temperature (K) 1 361.4 1 248.9 1 169.2 1 162.4 1 151.6 Figure 8 shows the velocity distribution at different ejection ratios in the air/carbon dioxide atmosphere. In contrast to the velocity distribution of the oxygen/carbon dioxide atmosphere, the velocity distribution remains similar with different ejection ratios. Figure 9 shows the axial velocity distribution of the combustor at different ejection ratios. For all ejection ratios, the velocity increases and then decreases as the height decreases, reaching its peak at a height of 0.12 m. At the same time, the velocity at a given height increases with the ejection ratio.
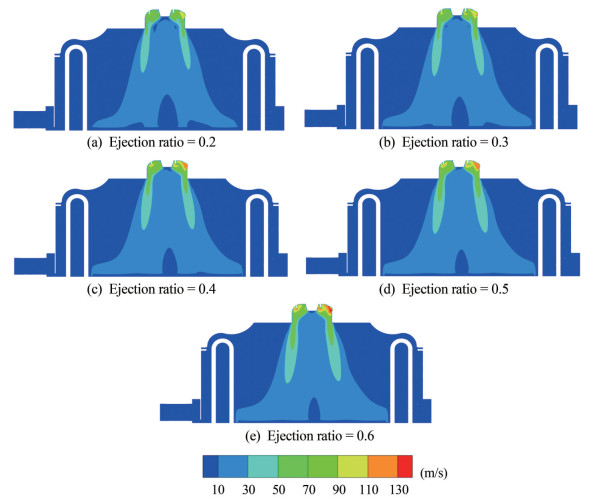 Figure 8 Velocity distribution at different ejection ratios in the air/carbon dioxide atmosphere
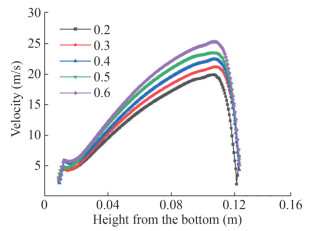 Figure 9 Axial velocity distribution at different ejection ratios in the air/carbon dioxide atmosphere
3.2 Effect of pressure on the temperature and velocity fields
Figures 10 and 11 illustrate the temperature distributions under different atmospheres as a function of pressure. In the oxygen/carbon dioxide atmosphere, at pressures of 5.0 MPa, 6.0 MPa, and 6.5 MPa, the flames have irregular shapes and are concentrated at the top of the combustor. When the pressure reaches 7.0 MPa, the flame distribution suddenly changes, and the flame shifts from the top of the combustor to being concentrated in the center of the combustor. Pressure has less influence on the temperature field in the air/ carbon dioxide atmosphere. The temperature distribution remains largely constant at different pressures.
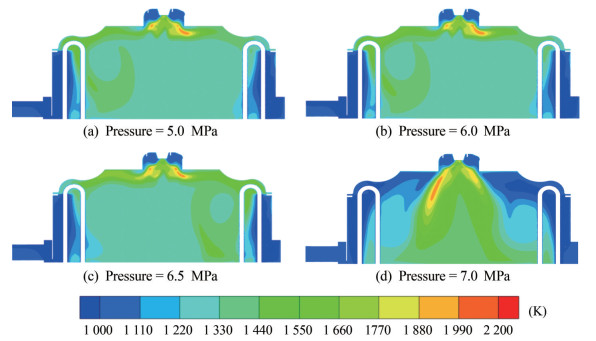 Figure 10 Temperature distribution at different pressures in the oxygen/carbon dioxide atmosphere
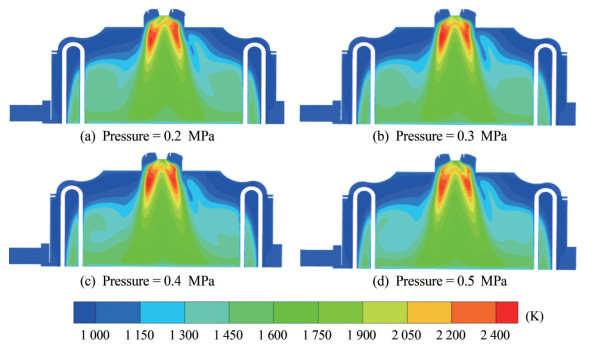 Figure 11 Temperature distribution at different pressures in the air/carbon dioxide atmosphere
Figure 12 shows the velocity distribution at different pressures in the oxygen/carbon dioxide atmosphere. At a pressure of 5.0 MPa, the Stirling engine combustor is divided into several velocity regions distributed at the top, middle, and near the heater tubes in the combustor. As the pressure increases to 6.0 MPa, the flow becomes more concentrated. As the pressure continues to increase to 7.0 MPa, the airflow is separated from the top of the combustor and flows toward the center of the combustor. Figure 13 shows the axial velocity distribution in the combustor. The change in pressure unsubstantially affects the velocity distribution within the combustor. At all pressures, the axial fluid velocity initially increases and then decreases with decreasing height, peaking at 0.12 m.
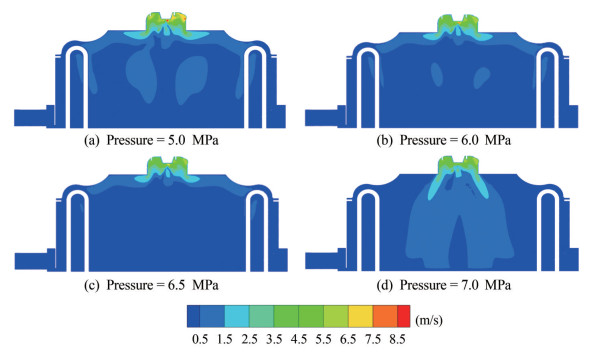 Figure 12 Velocity distribution at different pressures in the oxygen/carbon dioxide atmosphere
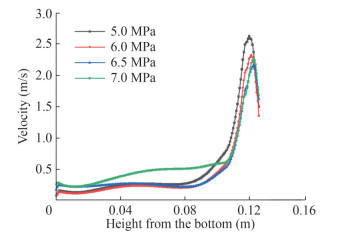 Figure 13 Axial velocity distribution at different pressures in the oxygen/carbon dioxide atmosphere
Figure 14 shows the velocity distribution at different pressures in the air/carbon dioxide atmosphere. Despite the similar velocity field patterns at different pressures, the flow velocity in the combustor decreases considerably with increasing pressure. Figure 15 shows the axial velocity distribution in the combustor at different pressures in the air/carbon dioxide atmosphere. Pressure limits the velocity inside the combustor. As the pressure increases, the maximum velocity in the combustor decreases considerably, and the axial velocity decreases more rapidly at pressures of 5.0, 6.0, and 6.5 MPa than at 7.0 MPa. Moreover, the axial velocity inside the combustor initially increases and then decreases with decreasing height.
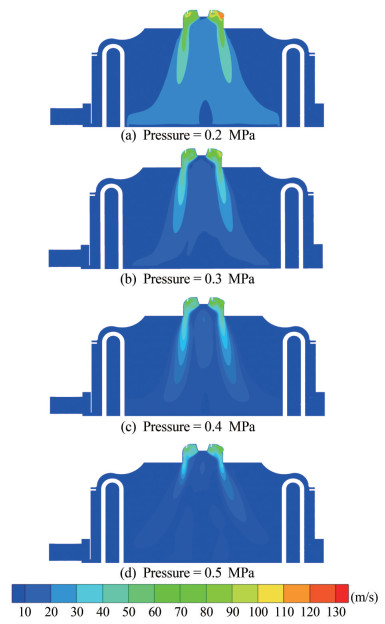 Figure 14 Velocity distribution at different pressures in the air/ carbon dioxide atmosphere
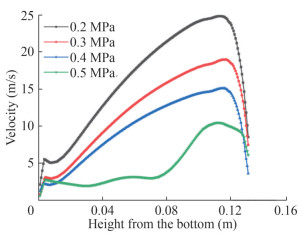 Figure 15 Axial velocity distribution of the combustor at different pressures in the air/carbon dioxide atmosphere
3.3 Effect of a changed oxygen atmosphere on external combustion efficiency
The heat exchange in the combustor depends mainly on the heating tubes, which are divided into three parts: the front-, rear-, and top-row heating tubes. The front-row heating tubes have the greatest effect on heat exchange, and the front-row heating tubes have the least effect.
Figures 16(a) and (b) show the trend of heat exchange and external combustion efficiency with respect to variation in the ejection ratio in the different atmospheres. In the oxygen/carbon dioxide atmosphere, for lower ejection ratios, the flame is concentrated at the top of the combustor, resulting in incomplete heat transfer from the front-row tubes and lower overall external combustion efficiency. As the ejection ratio increases, the flame gradually moves toward the center of the combustor. At an ejection ratio of 8.5, the flame is completely concentrated at the center of the combustor, and the external combustion efficiency reaches a maximum value of 89%. This result is obtained because of constant heat exchange from the top tube, limited heat exchange from the rear exhaust tube, and considerably increased heat exchange from the front exhaust tube. This increase in heat exchange from the front tube plays a crucial role in the overall heat exchange and external combustion efficiencies.
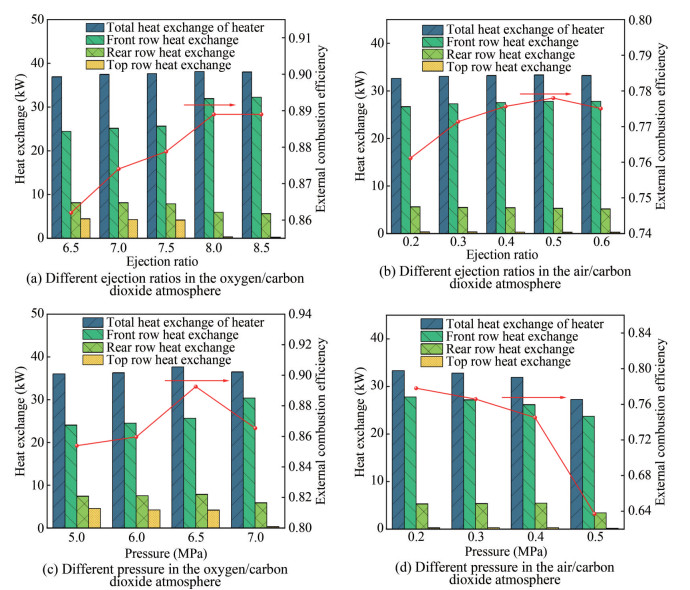 Figure 16 External combustion efficiency and heat exchange in the oxygen/carbon dioxide and air/carbon dioxide atmospheres
In the air/carbon dioxide atmosphere, heat exchange and external combustion efficiency initially increase with the ejection ratio, peaking at 78% when the ejection ratio is 0.5. Thereafter, heat exchange and external combustion efficiency decline. This trend is influenced by two opposing factors. First, the average temperature inside the air combustor decreases with increasing ejection ratio, limiting heat exchange. Second, the enhanced gas flow inside the combustor enhances the convective heat exchange. These two factors lead to the initial increase and subsequent decrease in heat exchange and external combustion efficiency.
Figures 16(c) and (d) show the trend of heat exchange and external combustion efficiency with pressure variation at different atmospheres. In the oxygen/carbon dioxide atmosphere, external combustion efficiency increases and then decreases with increasing pressure, reaching a maximum value of 89% at 6.5 MPa. Higher pressure enhances combustion completeness, increasing external combustion efficiency. However, the increased pressure also restricts gas flow in the combustor, thereby inhibiting heat transfer and reducing external combustion efficiency at pressures above 6.5 MPa. In the air/carbon dioxide atmosphere, front-row exchange, rear-row exchange, top-row exchange, and total heat exchange decrease progressively with increasing pressure. The external combustion efficiency hence decreases rapidly as pressure increases. Increasing the pressure from 0.2 MPa to 0.5 MPa causes a 13% decrease in external combustion efficiency. This decrease occurs because the speed of the combustor considerably decreases as the pressure increases, which weakens the convective heat transfer, and the pressurization cannot offset the promotion of combustion.
In summary, the ejection ratio indirectly influences the heat transfer and external combustion efficiency by affecting the flame distribution in the combustor. Changes in pressure have two opposite effects on external combustion efficiency, i.e., promoting more complete combustion but potentially restricting gas flow and weakening heat transfer within the burner.
4 Conclusions
In this study, a numerical model of a Stirling engine combustor is developed to study the distribution of temperature and velocity fields in different oxygen atmospheres with different ejection ratios and pressures and the effects of ejection ratio and pressure on the amount of heat transfer and external combustion efficiency. This research has implications for Stirling engine applications in the industrial sector. Integrating the portability of air combustion with the increased efficiency of oxy-fuel combustion may enhance the utility of Stirling engines in challenging conditions. The main conclusions are as follows:
1) Varying the ejection ratio and pressure can effectively change the flame distribution in the oxygen/carbon dioxide atmosphere but has little effect on that in the air/carbon dioxide atmosphere. Appropriate flame distribution can prevent the occurrence of localized high temperatures that could cause burnouts in the Stirling engine combustor and additionally improve the heat exchange capacity and lead to higher external combustion efficiency.
2) In the oxygen/carbon dioxide atmosphere, the external combustion efficiency increases with the ejection ratio, reaching a maximum value of 89% at an ejection ratio of 8.5. In the air/carbon dioxide atmosphere, the external combustion efficiency increases and then decreases as the ejection ratio increases, reaching a maximum value of 78% at an ejection ratio of 0.5.
3) In the oxygen/carbon dioxide atmosphere, a pressure increase initially leads to more complete combustion, and the external combustion efficiency reaches a maximum value of 89% at 6.5 MPa. A further increase in pressure begins to inhibit the heat exchange in the combustor, thus reducing the external combustion efficiency. In the air/carbon dioxide atmosphere, the external combustion efficiency decreases rapidly as pressure increases. An increase in the pressure from 0.2 MPa to 0.5 MPa decreases external combustion efficiency by 13%.
Competing interest Dong Han is an editorial board member for the Journal of Marine Science and Application and was not involved in the editorial review, or the decision to publish this article. All authors declare that there are no other competing interests. -
Figure 1 Structure of the combustor
Figure 2 Average temperature in the combustor with different grid cell numbers
Figure 3 Temperature at multiple measurement points
Figure 4 Temperature distribution with different ejection ratios in the oxygen/carbon dioxide atmosphere
Figure 5 Velocity distribution of different ejection ratios in the oxygen/carbon dioxide atmosphere
Figure 6 Axial velocity distribution at different ejection ratios in the oxygen/carbon dioxide atmosphere
Figure 7 Temperature distribution at different ejection ratios in the air/carbon dioxide atmosphere
Figure 8 Velocity distribution at different ejection ratios in the air/carbon dioxide atmosphere
Figure 9 Axial velocity distribution at different ejection ratios in the air/carbon dioxide atmosphere
Figure 10 Temperature distribution at different pressures in the oxygen/carbon dioxide atmosphere
Figure 11 Temperature distribution at different pressures in the air/carbon dioxide atmosphere
Figure 12 Velocity distribution at different pressures in the oxygen/carbon dioxide atmosphere
Figure 13 Axial velocity distribution at different pressures in the oxygen/carbon dioxide atmosphere
Figure 14 Velocity distribution at different pressures in the air/ carbon dioxide atmosphere
Figure 15 Axial velocity distribution of the combustor at different pressures in the air/carbon dioxide atmosphere
Figure 16 External combustion efficiency and heat exchange in the oxygen/carbon dioxide and air/carbon dioxide atmospheres
Table 1 Boundary conditions of the gas phase in the oxygen/carbon dioxide atmosphere
Condition No.1 No.2 No.3 No.4 No.5 No.6 No.7 No.8 Ejection ratio 7.0 7.5 8.0 8.5 9.0 8.0 8.0 8.0 Pressure (MPa) 6.5 6.5 6.5 6.5 6.5 5.0 6.0 7.0 Fuel intake (kg/h) 3.2 3.2 3.2 3.2 3.2 3.2 3.2 3.2 Oxygen intake (kg/h) 11.8 11.8 11.8 11.8 11.8 11.8 11.8 11.8 Recirculating flue gas intake (kg/h) 82.9 88.9 94.8 100.0 112.0 94.8 94.8 94.8 Percentage of oxygen (%) 16.4 15.7 15.1 14.5 13.6 15.1 15.1 15.1 Percentage of carbon dioxide (%) 57.7 58.1 58.6 59.0 59.6 58.6 58.6 58.6 Percentage of water vapor (%) 25.9 26.1 26.4 26.5 26.8 26.4 26.4 26.4 Table 2 Boundary conditions of the gas phase in the air/carbon dioxide atmosphere
Condition No.1 No.2 No.3 No.4 No.5 No.6 No.7 No.8 Ejection ratio 0.2 0.3 0.4 0.5 0.6 0.5 0.5 0.5 Pressure (MPa) 0.2 0.2 0.2 0.2 0.2 0.3 0.4 0.5 Fuel intake (kg/h) 3.2 3.2 3.2 3.2 3.2 3.2 3.2 3.2 Air intake (kg/h) 66.7 66.7 66.7 66.7 66.7 66.7 66.7 66.7 Recirculating flue gas intake (kg/h) 13.3 20.0 26.7 33.3 40.0 33.3 33.3 33.3 Percentage of oxygen (%) 19.5 18.1 16.9 15.9 15.0 15.9 15.9 15.9 Percentage of carbon dioxide (%) 2.9 4.0 5.0 5.8 6.5 5.8 5.8 5.8 Percentage of water vapor (%) 1.3 1.8 2.2 2.6 2.9 2.6 2.6 2.6 Table 3 Maximum and average temperatures in the combustor in the oxygen/carbon dioxide atmosphere
Ejection ratios 7.0 7.5 8.0 8.5 9.0 Maximum temperature (K) 2 280.3 2 258.1 2 215.3 2 267.4 2 150.1 Average temperature (K) 1 235.4 1 220.9 1 167.1 1 062.4 1 052.6 Table 4 Maximum and average temperatures in the combustor in the air/carbon dioxide atmosphere
Ejection ratios 0.2 0.3 0.4 0.5 0.6 Maximum temperature (K) 2 512.4 2 129.1 2 085.1 2 057.4 1 992.1 Average temperature (K) 1 361.4 1 248.9 1 169.2 1 162.4 1 151.6 -
Ahmed F, Huang HL, Ahmed S, Wang X (2020) A comprehensive review on modeling and performance optimization of Stirling engine. International Journal of Energy Research 44: 6098–6127. https://doi.org/10.1002/er.5214 Buhre BJP, Elliott LK, Sheng CD, Gupta RP, Wall TF (2005) Oxyfuel combustion technology for coal-fired power generation. Progress in Energy and Combustion Science 31: 283–307. doi.org/10.1016/j.pecs.2005.07.001 Campos MC, Vargas JVC, Ordonez JC (2012) Thermodynamic optimization of a Stirling engine. Energy 44: 902–910. doi.org/10.1016/j.energy.2012.04.060 Cardozo E, Erlich C, Malmquist A, Alejo L (2014) Integration of a wood pellet burner and a Stirling engine to produce residential heat and power. Applied Thermal Engineering 73: 671–680. doi.org/10.1016/j.applthermaleng.2014.08.024 Cheng CH, Huang JS (2021) Development of tri-generation system combining Stirling cooler and Stirling engine. International Journal of Energy Research 45: 21006–21022. doi.org/10.1002/er.7159 Costea M, Feidt M (1998) The effect of the overall heat transfer coefficient variation on the optimal distribution of the heat transfer surface conductance or area in a Stirling engine. Energy Conversion and Management 39: 1753–1761. doi.org/10.1016/s0196-8904(98)00063-6 Deng Y, Li J, EE (2022) Emerging roles of liquid metals in carbon neutrality. Frontiers in Energy 16: 393–396. doi.org/10.1007/s11708-022-0829-5 Gao G, Huang H, Yang Y, Damu A (2019) Performance simulation of a low-swirl burner for a Stirling engine. International Journal of Energy Research 43: 1815–1826. doi.org/10.1002/er.4407 Ghamari I, Mahmoudi HR, Hajivand A, Seif MS (2022) Ship roll analysis using CFD-derived roll damping: Numerical and experimental study. Journal of Marine Science and Application 21: 67–79. doi.org/10.1007/s11804-022-00254-1 Gheith R, Hachem H, Aloui F, Ben Nasrallah S (2015) Experimental and theoretical investigation of Stirling engine heater: Parametrical optimization. Energy Conversion and Management 105: 285–293. doi.org/10.1016/j.enconman.2015.07.063 Hachem H, Gheith R, Aloui F, Ben Nasrallah S (2018) Technological challenges and optimization efforts of the Stirling machine: A review. Energy Conversion and Management 171: 1365–1387. doi.org/10.1016/j.enconman.2018.06.042 Hafez AZ, Soliman A, El-Metwally KA, Ismail IM (2016) Solar parabolic dish Stirling engine system design, simulation, and thermal analysis. Energy Conversion and Management 126: 60–75. doi.org/10.1016/j.enconman.2016.07.067 Hong J, Chaudhry G, Brisson JG, Field R, Gazzino M, Ghoniem AF (2009) Analysis of Oxy-fuel combustion power cycle utilizing a pressurized coal combustor. Energy 34: 1332–1340. doi.org/10.1016/j.energy.2009.05.015 Jia JB, Zong Z (2022) Experimental study on the configuration hydrodynamics of trimaran ships. Journal of Marine Science and Application 21: 46–55. doi.org/10.1007/s11804-022-00281-y Kazemi H, Doustdar MM, Najafi A, Nowruzi H, Ameri MJ (2021) Hydrodynamic performance prediction of stepped planing craft using CFD and ANNs. Journal of Marine Science and Application 20: 67–84. doi.org/10.1007/s11804-020-00182-y Kongtragool B, Wongwises S (2003) A review of solar-powered Stirling engines and low temperature differential Stirling engines. Renewable & Sustainable Energy Reviews 7: 131–154. doi.org/10.1016/s1364-0321(02)00053-9 Kongtragool B, Wongwises S (2007) Performance of a twin power piston low temperature differential Stirling engine powered by a solar simulator. Solar Energy 81: 884–895. doi.org/10.1016/j.solener.2006.11.004 Li LJ, Zhao BB, Sun BK (2023) Surface waves induced by a moving submarine model. Journal of Marine Science and Application 22: 84–91. doi.org/10.1007/s11804-023-00318-w Li S, Ju Y (2022) Review of the LNG intermediate fluid vaporizer and its heat transfer characteristics. Frontiers in Energy 16: 429–444. doi.org/10.1007/s11708-021-0747-y Mancini T, Heller P, Butler B, Osborn B, Schiel W, Goldberg V, Buck R, Diver R, Andraka C, Moreno J (2003) Dish-Stirling systems: An overview of development and status. Journal of Solar Energy Engineering-Transactions of the ASME 125: 135–151. doi.org/10.1115/1.1562634 Nagao J, Pillai AL, Kurose R (2020) Investigation of temporal variation of combustion instability intensity in a back step combustor using LES. Journal of Thermal Science and Technology 15: 36–37. doi.org/10.1299/jtst.2020jtst0036 Nishiyama A, Shimojima H, Ishikawa A, Itaya Y, Kambara S, Moritomi H, Mori S (2007) Fuel and emissions properties of stirling engine operated with wood powder. Fuel 86: 2333–2342. doi.org/10.1016/j.fuel.2007.01.040 Petrescu S, Costea M, Harman C, Florea T (2002) Application of the Direct Method to irreversible Stirling cycles with finite speed. International Journal of Energy Research 26: 589–609. doi.org/10.1002/er.806 Rizk MA, Belhenniche SE, Imine O, Kinaci OK (2023) Cavitation predictions of E779A propeller by a RANSE-based CFD and its performance behind a generic hull. Journal of Marine Science and Application 22: 273–283. doi.org/10.1007/s11804-023-00342-w Solomon L, Qiu S (2018) Computational analysis of external heat transfer for a tubular Stirling convertor. Applied Thermal Engineering 137: 134–141. doi.org/10.1016/j.applthermaleng.2018.03.070 Song Z, Chen J, Yang L (2015) Heat transfer enhancement in tubular heater of Stirling engine for waste heat recovery from flue gas using steel wool. Applied Thermal Engineering 87: 499–504. doi.org/10.1016/j.applthermaleng.2015.05.028 Thombare DG, Verma SK (2008) Technological development in the Stirling cycle engines. Renewable & Sustainable Energy Reviews 12: 1–38. doi.org/10.1016/j.rser.2006.07.001 Tu YJ, Liu H, Chen S, Liu ZH, Zhao HB, Zheng CG (2015) Numerical study of combustion characteristics for pulverized coal under Oxy-MILD operation. Fuel Processing Technology 135: 80–90. doi.org/10.1016/j.fuproc.2014.10.025 Xia F, Yang Z, Adeosun A, Gopan A, Kumfer BM, Axelbaum RL (2016) Pressurized Oxy-combustion with low flue gas recycle: Computational fluid dynamic simulations of radiant boilers. Fuel 181: 1170–1178. doi.org/10.1016/j.fuel.2016.04.023 Xiao G, Chen C, Shi B, Cen K, Ni M (2014) Experimental study on heat transfer of oscillating flow of a tubular Stirling engine heater. International Journal of Heat and Mass Transfer 71: 1–7. doi.org/10.1016/j.ijheatmasstransfer.2013.12.010 Yan W, Dong J, Ren H (2012) Economic analysis of the power station with pressurized Oxy-fuel combustion and CO2 capture. Journal of Power Engineering 32: 712–717 Zhang H, Gowing T, Degreve J, Leadbeater T, Baeyens J (2016) Use of particle heat carriers in the Stirling engine concept. Energy Technology 4: 401–408. doi.org/10.1002/ente.201500274 Zhang WC, Wu LH, Jiang XW, Feng XS, Li YP, Zeng JB, Liu CD (2022) Propeller design for an autonomous underwater vehicle by the lifting-line method based on OpenProp and CFD. Journal of Marine Science and Application 21: 106–114. doi.org/10.1007/s11804-022-00275-w
