
Experimental and Numerical Study on Vortex-Induced Vibration Suppression by Helical Strakes on Subsea Pipelines
https://doi.org/10.1007/s11804-025-00650-3
-
Abstract
A numerical simulation analysis is conducted to examine the unsteady hydrodynamic characteristics of vortex-induced vibration (VIV) and the suppression effect of helical strakes on VIV in subsea pipelines. The analysis uses the standard k − ε turbulence model for 4.5- and 12.75-inch pipes, and its accuracy is verified by comparing the results with large-scale hydrodynamic experiments. These experiments are designed to evaluate the suppression efficiency of VIV with and without helical strakes, focusing on displacement and drag coefficients under different flow conditions. Furthermore, the influence of important geometric parameters of the helical strakes on drag coefficients and VIV suppression efficiency at different flow rates is compared and discussed. Numerical results agree well with experimental data for drag coefficient and vortex-shedding frequency. Spring-pipe self-excited vibration experimental tests reveal that the installation of helical strakes substantially reduces the drag coefficient of VIV within a certain flow rate range, achieving suppression efficiencies exceeding 90% with strake heights larger than 0.15D. Notably, the optimized parameter combination of helical strakes, with a pitch of 15D, a fin height of 0.2D, and 45° edge slopes, maintains high suppression efficiency, thereby exhibiting superior performance. This study provides a valuable reference for the design and application of helical strakes and VIV suppression in subsea engineering.-
Keywords:
- Subsea pipeline ·
- Helical strakes ·
- Vortex-induced vibration ·
- Lift-drag coefficient ·
- Suppression
Article Highlights● The unsteady hydrodynamic characteristics of vortex-induced vibration in subsea pipelines are analyzed.● A large-scale self-excited vortex-induced vibration experiment in subsea pipelines with helical strakes is conducted.● A structural dynamic behavior numerical model of subsea pipelines with helical strakes is established to suppress vortex-induced vibration.● The displacement, drag coefficient, and suppression effect of the helical strakes on vibration in subsea pipelines are determined through experiments and numerical simulations. -
1 Introduction
Deep-sea oil and gas exploitation heavily relies on jumpers to connect manifolds, wellheads, and pipelines, requiring high strength, stability, and durability. Marine pipelines are subjected to structural stresses and random wave action, inducing periodic motion during the extraction process. Additionally, the continuous flow of water induces considerable deformations, leading to vortex-induced vibration (VIV) (Mao et al., 2023). VIV is a flow phenomenon in marine pipelines attributed to periodic vortex shedding generated at the back of the ocean current (Williamson and Govardhan, 2004). This phenomenon is characterized by multiple degrees of freedom and a strongly periodic flow field around the pipelines (Han et al., 2016; Ulveseter et al., 2018). The influence of VIV becomes highly unsteady and disordered as water depth increases, leading to fatigue failure of underwater risers (Trim et al., 2005). VIV notably reduces the lifespan of pipelines; therefore, this aspect should be considered in the initial design stage. Current research on VIV in marine pipelines and its suppression mechanisms typically combines computational fluid dynamics numerical calculations and experiments to investigate the generation mechanisms and control strategies of VIV in deep-water pipelines. Establishing correlations between vibration reduction characteristics and the structural parameters of marine pipelines will allow for reliable predictions of VIV dynamic behaviors.
Several research groups have studied the mechanisms of VIV in risers and pipelines, focusing on multi-modal responses, internal and external wave‒flow interactions, three-dimensional unsteady characteristics, and suppression methods (Assi et al., 2022; Zhao, 2023; Chen et al., 2024). These studies employ theoretical methods, numerical calculations, and model experiments (Korkischko and Meneghini, 2010; Lou et al., 2016; Yin et al., 2017; Zhu et al., 2021), with a particular emphasis on eliminating or weakening VIV. Various suppression devices have been proposed, including separate vortex suppression devices, wake stabilization suppressors, and fin-type suppression devices based on bionics. The methods aim to delay boundary layer separation through additional devices or structures, thereby reducing the velocity difference between the shear layer and the wake region. Consequently, the shedding and separation of the irregular vortex induced by the velocity difference were suppressed, thereby ultimately optimizing and altering the pressure and flow field velocity distribution.
Helical strakes are widely applied in the marine engineering field as an important and effective method for suppressing VIV. Numerous theoretical analyses and experimental studies have investigated the parameters affecting the suppression efficiency of helical strakes, including Reynolds number (Huang, 2011; Ranjith et al., 2016), pitch, number of screw heads, fin height (Quen et al., 2014; Quen et al., 2018), coverage (Gao et al., 2016; Gao et al., 2017), and surface roughness. Li et al. (2020) conducted experiments to analyze the suppression of VIV and its effect on the dynamic response of risers using helical strakes. Ren et al. (2019) discussed the suppression effects of helical strakes on VIV in flexible risers and the fatigue damage induced by VIV under oscillating flow. Gao et al. (2015; 2017) studied the vibration response characteristics of risers, evaluating the suppression effects of helical strakes. Xu et al. (2017) combined theoretical and experimental methods to assess the influence of different shape helical strakes on flexible cylinders across various Reynolds number ranges, observing considerable reductions in strain amplitude, displacement amplitude, and response frequency. Sui et al. (2016) presented and verified VIV suppression on a cylinder installed with helical strakes by varying the heights, pitches, coverages, and cross-sections through wind tunnel experiments, revealing that helical strakes can alter vibration frequencies and suppress vortex shedding of circular cylinders by varying the separation points. Guo et al. (2023) adopted large eddy simulation to investigate the impact of high-speed submarine turbidity currents on the generation of turbulent vortex streets behind fixed-span pipelines and established predictive methods for drag and lift coefficients, as well as Strouhal numbers. Wu et al. (2024) employed the immersed boundary method and lattice Boltzmann flux solver to explore the VIVs of a single cylinder across different reduced velocities, revealing complex wake vortex patterns and changes in vibration dynamics with varying gap spacing and flow speed.
Existing research primarily focuses on exploring VIV suppression mechanisms through theoretical analysis, numerical simulations, and laboratory-scale models, often overlooking the complexities of real ocean environments. Additionally, most experiments have concentrated on scaled-down models, with limited research on the hydrodynamic characteristics of full-scale pipelines under complex marine conditions. Moreover, previous studies have generally addressed the influence of one or a few parameters on vibration responses, lacking comprehensive analyses of the coupled effects of multiple parameters.
To address these limitations, this study conducts full-scale self-excited VIV experiments on 4.5- and 12.75-inch pipelines, alongside numerical simulations, to comprehensively investigate the suppression efficiency of helical strakes and the drag coefficients of pipelines under various working conditions. These efforts bridge the gap in existing scaled-down experiments, enhancing the applicability of the findings to engineering practices. A finite element model that incorporates the structural parameters of helical strakes is established, facilitating a systematic analysis of the effects of different pitches, fin heights, and coverage rates on VIV and vortex shedding frequencies. This analysis helps identify the optimal design parameters and provides a robust foundation for the multiparameter optimization design of helical strakes. Through large-scale experiments and numerical simulations, this study reveals the suppression mechanisms of helical strakes on VIV under complex flow conditions. Additionally, the study explores the effects of turbulence, shear flows, and other nonuniform flow conditions on vibration responses.
2 Research models and numerical methods
2.1 Calculation and test model
The flow field model, consistent with the experiment setup, is selected and shown in Figure 1, with detailed design parameters listed in Table 1.
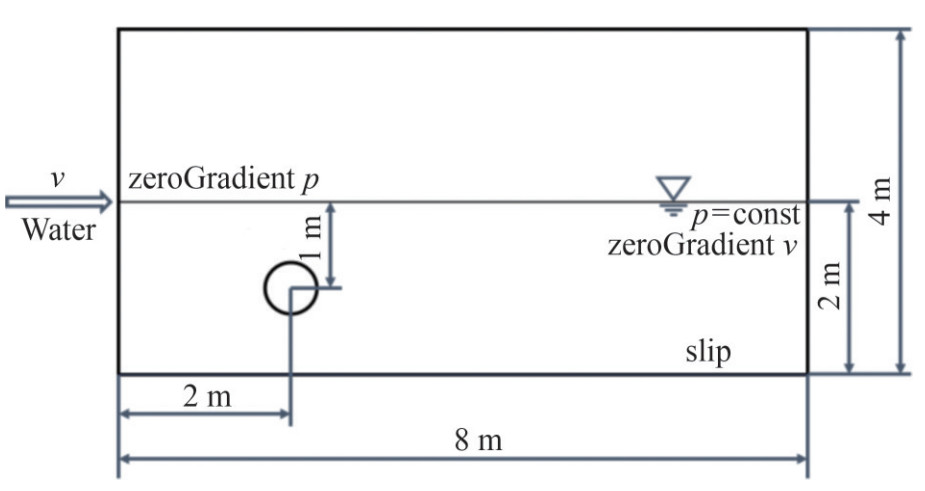 Figure 1 Schematic of flow field conditionsTable 1 Basic parameters of pipe, helical strakes, and flow field model
Pipe parameters 4.5-inch 12.75-inch Pipe diameter (m) 0.115 0.326 Pipe length (m) 4.580 4.580 Height from top (m) 1 1 Height from bottom (m) 1 1 Length from entrance (m) 2 2 A three-dimensional model of the helical strakes for VIV suppression on subsea pipelines is established using SolidWorks. Along the axis, Figure 2 shows the front view of the full helical strakes model for 4.5- and 12.75-inch pipelines selected for the hydrodynamic diameter. This model features a pitch of 15D and a fin height of 0.2D. Figure 3 illustrates the bare pipe model, the model without an installation slot, and the model with an installation slot, where the fin edge slopes are set at 45° and 60°.
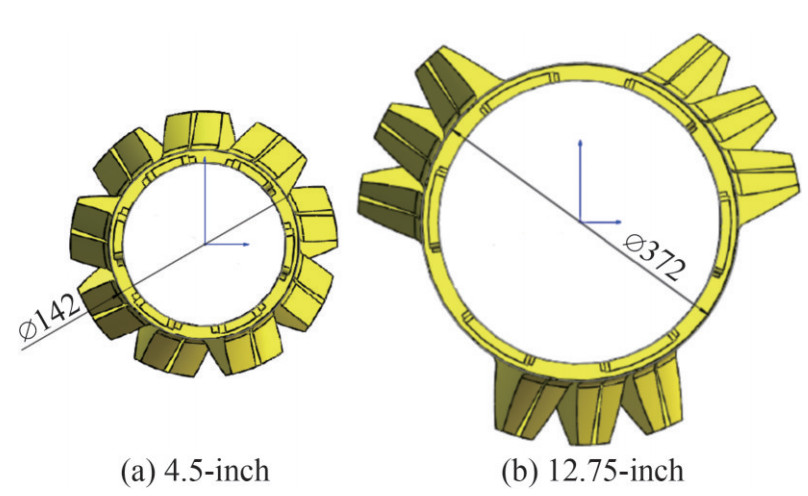 Figure 2 Structure diagram of full helical strakes model
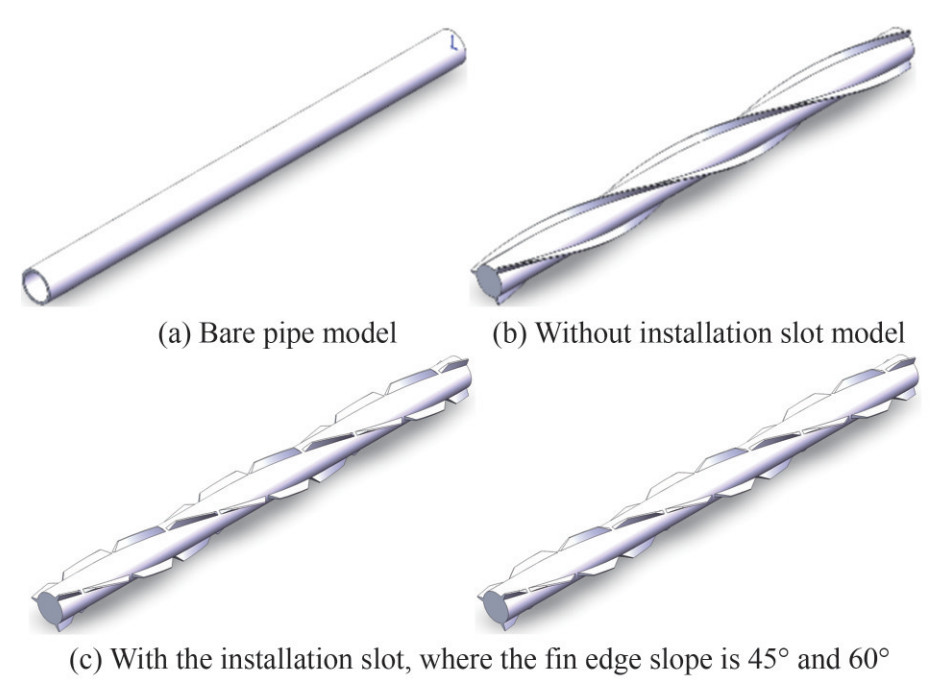 Figure 3 Helical strakes model
To improve numerical accuracy and minimize the influence of the inlet boundary on the subsea pipelines and the outlet boundary on the wake, the distance from the center point of the pipe to the inlet and outlet boundaries of the flow field is set to be longer than 10D and 30D, respectively, where D denotes the pipe diameter. Additionally, the distance between the pipe and the boundary of the two transverse walls is set to exceed 10D. The computational domain comprises the pipe model and the external flow field. The flow field calculation domain outside the pipe is established in ANSYS ICEM, where local boundary layer refinement is performed on the pipe wall to effectively capture the vortex-shedding structure.
2.2 Verification of the independence of mesh number and time step
An unsteady-state sensitivity study is conducted to identify the optimal simulation parameters, focusing on the calculation of mesh number and flow time step. In these studies, the SST k − ω turbulence model is selected and applied at a flow velocity of 0.5 m/s. The selected flow rate not only represents common operating conditions but also applies to actual engineering application scenarios. By calculating the Reynolds number of the pipeline, the low flow rate simplifies the fluid-structure interaction simulation requirements. While this approach reduces numerical instability, it still captures the key details of eddy current dynamics, especially in terms of grid generation and time step length. Simultaneously, the flow velocity can be directly compared with the experimental data points, improving the accuracy and credibility of the simulation results. Overall, the flow rate of 0.5 m/s is selected due to its relevance to typical operating environments, its applicability to accurately characterize the fluid dynamics involved in this study, and its practicality in ensuring robust experimental and calculation results.
To improve the simulation of the boundary layer flow and ensure the accuracy of the numerical simulation, the mesh near the wall area is refined, ensuring a sufficient number of nodes to capture the flow in the boundary layer (Ji et al., 2011; Bennia et al., 2016). The y+ value represents the distance from the nearest mesh element node in the near-wall region to the wall area and is a dimensionless parameter defined as follows:
$$Y^{+}=\frac{\sqrt{\frac{\tau_\omega}{\rho}} \Delta n}{v}$$ (1) ANSYS ICEM software is utilized to divide the computational domain into hexahedral structured meshes, and five groups of meshes with different densities are selected to verify their independence, as detailed in Table 2. The results indicate that the lift-drag coefficient of the pipe model remains unchanged across the five groups of meshes with different densities, and the errors compared to the theoretical values are all within 1%, meeting the mesh independence requirements. Therefore, considering computational resources, time, and accuracy, the final selection for the computational domain mesh comprises 1 527 096 units. Additionally, three different time steps, Δt = 5 × 10⁻³ s, Δt = 5 × 10⁻² s, and Δt = 1 × 10⁻² s, were tested to assess the effect of the time step Δt on numerical simulation precision. The results show that the variations between the three time steps are minimal. Therefore, balancing numerical accuracy with computational cost, the final selected time step is Δt = 5 × 10⁻² s.
Table 2 Verification of mesh sizeMesh Number of mesh Lift coefficient Drag coefficient Mesh 1 603 698 0.21 0.68 Mesh 2 1 527 096 0.22 0.68 Mesh 3 2 178 528 0.22 0.69 Mesh 4 3 153 286 0.22 0.69 Mesh 5 4 561 447 0.22 0.69 2.3 Turbulence model
2.3.1 Governing equations
The governing equations for fluid motion are based on Reynolds-averaged Navier‒Stokes equations as follows:
$$\frac{\partial \rho}{\partial t}+\nabla \cdot(\rho \boldsymbol{u})=0$$ (2) $$\begin{aligned} \frac{\partial \rho \boldsymbol{u}}{\partial t}+\nabla \cdot(\rho \boldsymbol{u} \boldsymbol{u})= & -\nabla p+\nabla \cdot\left[\left(\mu+\mu_t\right) \times \nabla \boldsymbol{u}\right]+ \\ & \frac{1}{3} \nabla \cdot\left[\left(\mu+\mu_t\right) \nabla \boldsymbol{u}\right] \end{aligned}$$ (3) where ρ is the density of the mixed phase, kg/m3; μ is the dynamic viscosity coefficient, kg/m3; μt is the turbulent viscosity coefficient, kg/m3; v is the kinematic viscosity, m2/s; u is the velocity vector, m/s; p is pressure, Pa; and t is time, s.
2.3.2 Turbulence model
To accurately simulate the flow characteristics of subsea pipelines covered with helical strakes, the standard k − ε turbulence model is employed to solve the Navier‒Stokes equations. This model is widely recognized for its robustness and simplicity in turbulent flow predictions, making it particularly useful in engineering applications. The standard k − ε turbulence model effectively considers the turbulence effect by solving two separate transport equations: one for the turbulent kinetic energy k and the other for the dissipation rate ε. The transport equation for turbulent kinetic energy k is given by:
$$\frac{\partial \rho k}{\partial t}+\nabla \cdot(\rho \boldsymbol{u} k)=\nabla \cdot\left[\left(\mu+\frac{\mu_t}{\sigma_k}\right) \nabla k\right]+P_k-\rho \varepsilon$$ (4) where ρ is the fluid density; u is the velocity vector; μ is the molecular viscosity; μt is the turbulent viscosity, modeled as μt = ρCμk2 /ε; σk is the turbulent Prandtl number for k, typically equal to 1.0. Pk represents the production of turbulent kinetic energy due to mean velocity gradients and is defined as follows:
$$P_k=\mu_t\left(\nabla \boldsymbol{u}+(\nabla \boldsymbol{u})^{\mathrm{T}}\right): \nabla \boldsymbol{u}$$ (5) The transport equation for the dissipation rate of turbulent kinetic energy ε is given by:
$$\frac{\partial \rho \varepsilon}{\partial t}+\nabla \cdot(\rho \boldsymbol{u} \varepsilon)=\nabla \cdot\left[\left(\mu+\frac{\mu_t}{\sigma_{\varepsilon}}\right) \nabla \varepsilon\right]+C_{1 \varepsilon} \frac{\varepsilon}{k} P_k-C_{2 \varepsilon} \rho \frac{\varepsilon}{k} \varepsilon$$ (6) where C1ε and C2ε are empirical constants, typically set to 1.44 and 1.92, respectively; σε is the turbulent Prandtl number for ε, generally taken as 1.3.
2.4 Boundary conditions
The upper and lower solid walls employ the sliding boundary condition, where the magnitude and direction of the sliding velocity align with the inlet boundary velocity. The inlet boundary condition is set as a velocity inlet, with flow velocities of 0.5, 1.0, and 1.5 m/s. Meanwhile, the outlet boundary condition is set as a pressure outlet, with the outlet pressure specified as 0 Pa.
In the unsteady calculation, the time step is set to 0.05 s, with a maximum number of 20 iterations per time step over a total simulation time of 100 s. During the calculation period, the variation curves of the lift and drag coefficients are continuously monitored. The characteristic length is defined as the pipe diameter, and the characteristic area is the projected pipe area in the incoming flow direction. During the solution process, the convection discrete term of the governing equation uses a second-order high-precision format, while the time-term discrete format employs a second-order backward Euler difference format. The maximum residual error is used as the convergence criterion for the solution, with a convergence accuracy set to 10−5.
3 Results and analysis
3.1 Hydrodynamic test verification
Experiments are conducted in the large-scale wave tank at the Tianjin Academy of Water Transport Engineering Science, Ministry of Transport, to verify the accuracy of the numerical simulations. The tank measures 456 m in length and 5 m in width and has a water depth of 12 m in the test section, as shown in Figure 4. The testing process adhered to the SL155-2012 "Hydraulic (Conventional) Model Test Regulations" standard (Ministry of Water Resources 2012). For each test group, the flow rate of the water circulation through the tank's pump was controlled to simulate the water flow conditions of a real marine environment.
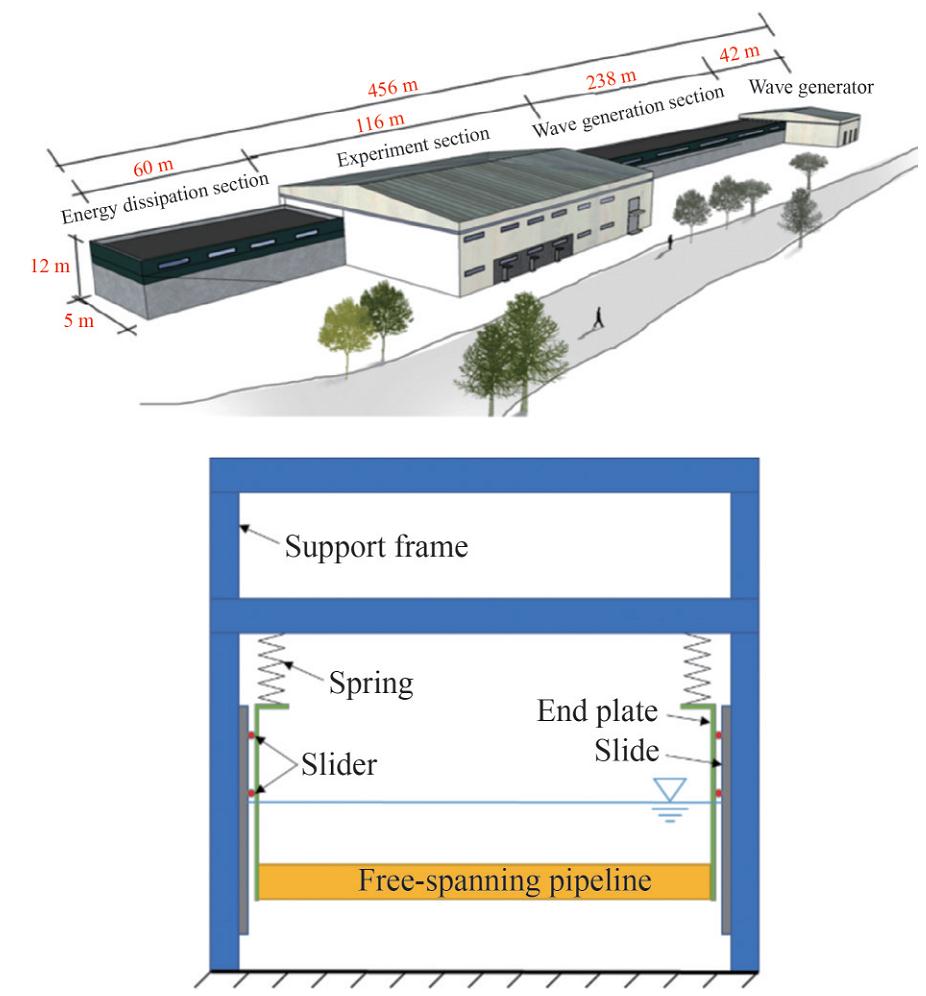 Figure 4 Schematic of the test tank and the self-excited oscillation test device
The test wave generator is driven by four synchronous servo motors, each with a power of 6 × 260 kW. The maximum wave-making capacities that can be tested are as follows: a maximum wave height of 3.5 m for regular waves, a maximum solitary wave of 2 m, and a maximum flow capacity of 20 m3/s. The system supports a variety of wave spectra, including the regular wave spectrum JONSWAP, as well as other arbitrary spectra, with wave-making periods ranging from 2–10 s. The equipment in the test section includes a vertical guide to direct the flow, a fixed connecting plate, a test pipe supported by a beam, springs at both ends, and two connecting rods. The vertical guide rails restrict the test pipe to only vibrate in the longitudinal direction, preventing lateral vibration, and their length exceeds that of the test pipe. The lower ends of the two connecting plates are connected to each end of the test pipe, while the upper ends are connected to springs, which are fixedly connected to the beam at the top of the water tank, as shown in Figure 4.
To accurately measure the flow velocity through the pipe model and ensure the reliability of the test results, six flow meters were arranged in the incoming flow direction of the pipe model. The test devices and experimental system are shown in Figure 5. The displacement amplitude during the test is monitored using pull wires positioned on both sides of the track, with displacement sensors operating at a sampling frequency of 20 Hz and a maximum range of 1 m. Compared to non-contact sensors, these sensors offer higher measurement accuracy, as shown in Figure 6. The instrument is designed for easy measurement, and circular baffles are installed at both ends of the pipe model to avoid irregular structures on both sides of the water tank from affecting the upstream core area. The schematic of the installation position is shown in Figure 7.
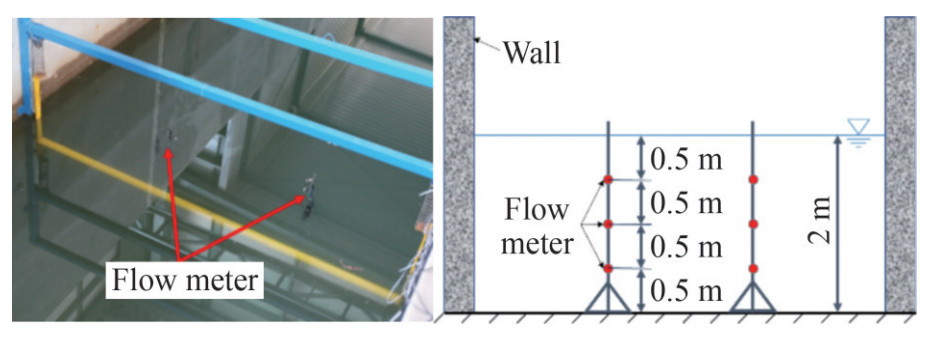 Figure 5 Flow meter distribution and test arrangement
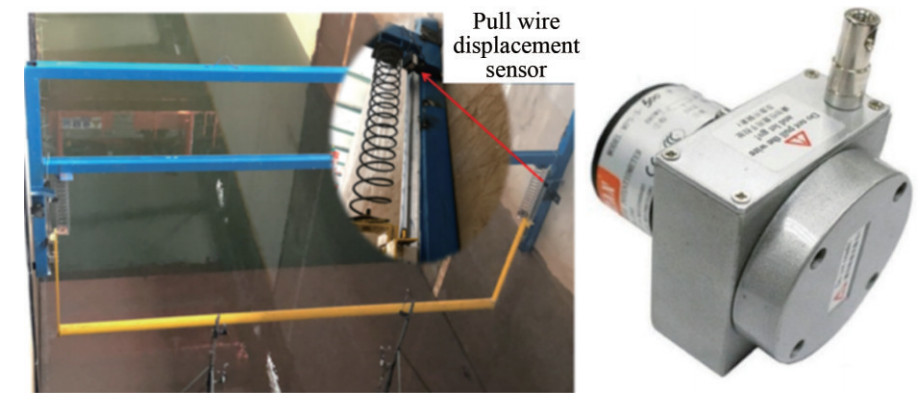 Figure 6 Pull wire displacement sensor and test arrangement
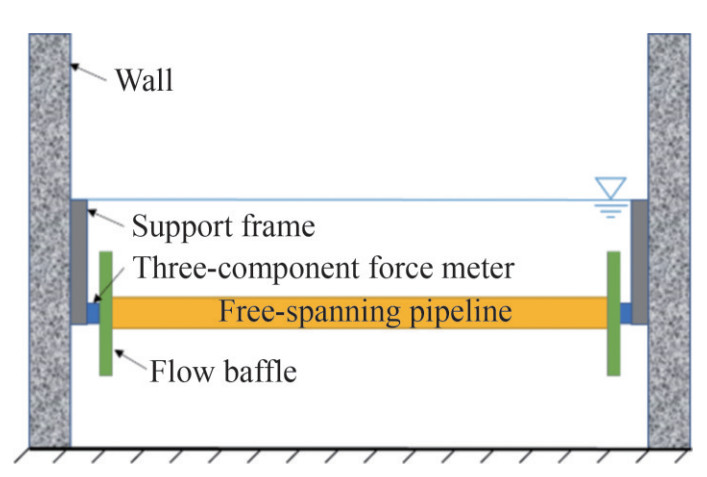 Figure 7 Installation diagram of a three-component force meter sensor
3.1.1 Stiffness sensor calibration
The tests are performed separately before and after the installation of the helical strakes and the subsequent vortex shedding across four different flow rates. Assuming a Strouhal number St of 0.2, the spring stiffness for the VIV spring is calculated using Equation (7). The results, which determine the spring stiffness rate for different pipe diameters and flow rates, are shown in Figure 8. The slope represents the tensile stiffness of the spring, which are 1 434.9, 2 934, 4 516.9, and 11 072 N/m.
$$k=\frac{4 {\rm{ \mathsf{ π}}}^2 S t^2 U^2\left(m+m_a\right)}{D^2}$$ (7) 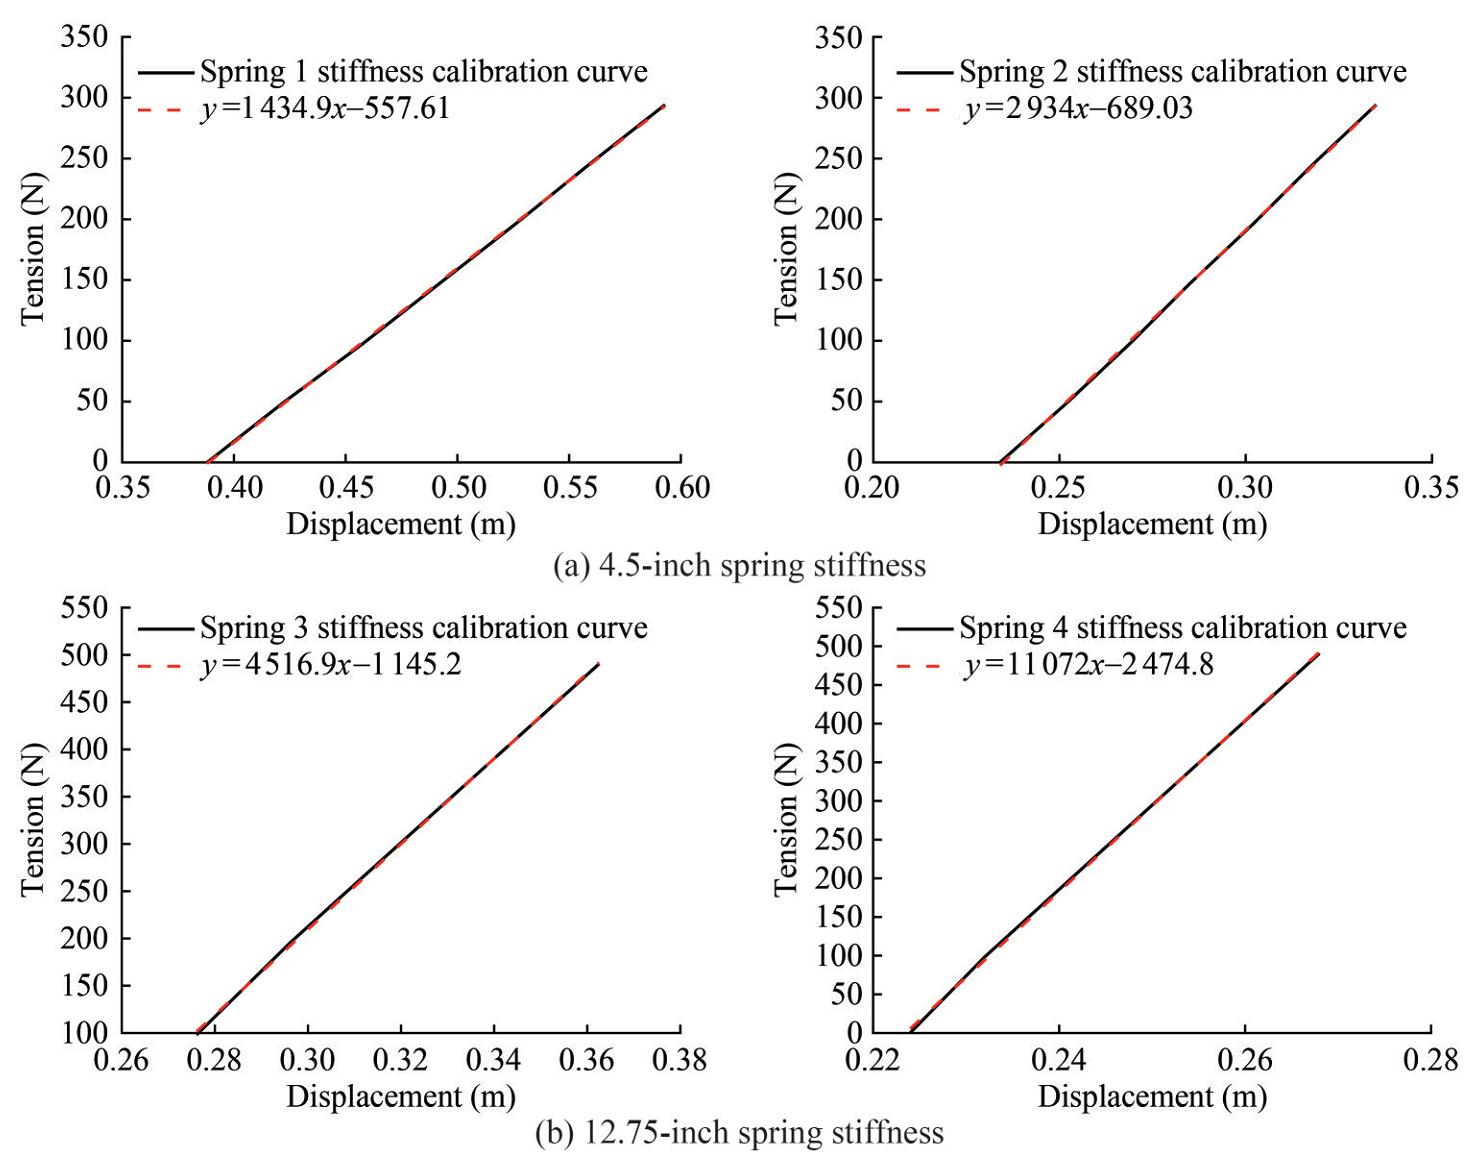 Figure 8 Calibration curve of spring stiffness
3.1.2 Displacement sensor calibration
The calibration results of the two displacement sensors, along with the trend lines between the calibration and the two measured values, are shown in Figure 9. The slope of the line represents the average relative error of the two displacement sensors, which are 2.2% and 2.7%. These values confirm that the accuracy of the test displacement measurements meets the requirements. During the experiment process, wire displacement sensors were used to monitor and validate the displacement at both ends of the pipeline. These sensors were installed on either side of the experimental setup, offering superior measurement precision compared to non-contact alternatives. Positioned above the pipeline ends, the sensors moved synchronously with the springs, capturing real-time vertical displacement data. The displacement amplitudes of the pipeline during self-excited oscillations were recorded using these sensors. Additionally, three-component force sensors were mounted at the pipeline ends. To mitigate interference from irregular tank structures affecting the inflow core region of the suspended pipeline model, circular baffle plates were attached at both ends of the pipeline. The calibration of the wire displacement sensors adhered to the specifications outlined in JJF1305-2011.
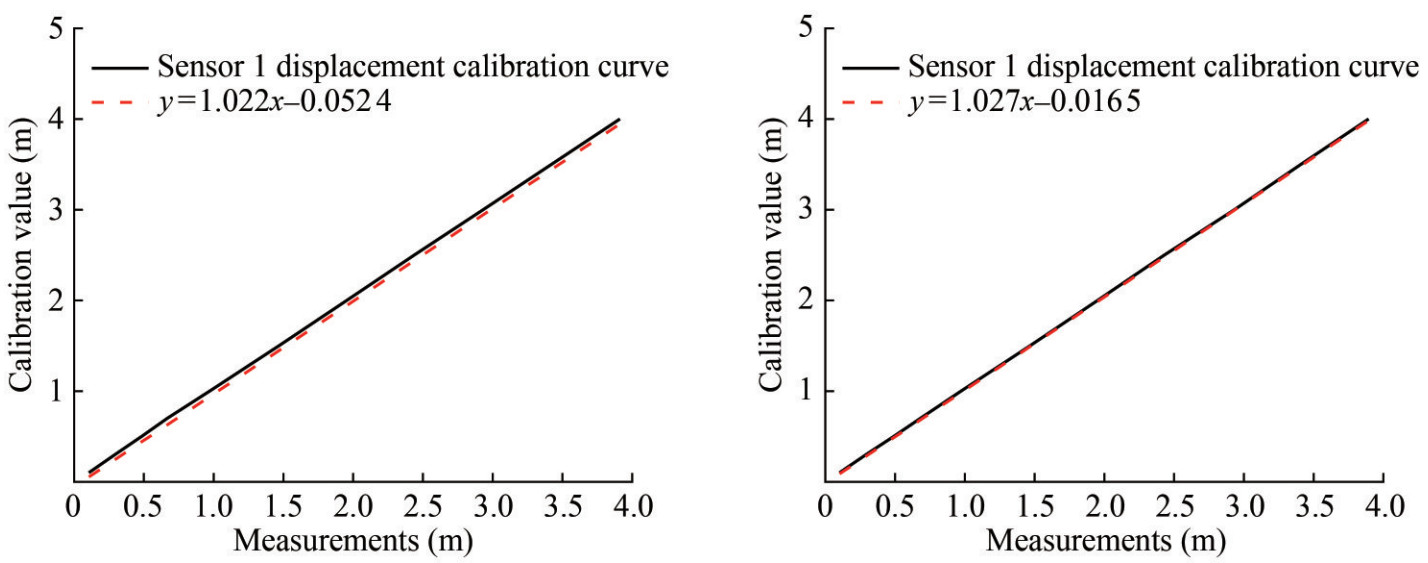 Figure 9 Calibration results of displacement sensor
3.1.3 Force sensor calibration
For the 50 and 200 kg force sensors used in the 4.5- and 12.75-inch pipe models, respectively, the calibration results and the trend line between the calibration and measured values are shown in Figure 10. The figure indicates that the error of the load cell is less than 5%, which meets the accuracy requirements for the drag test.
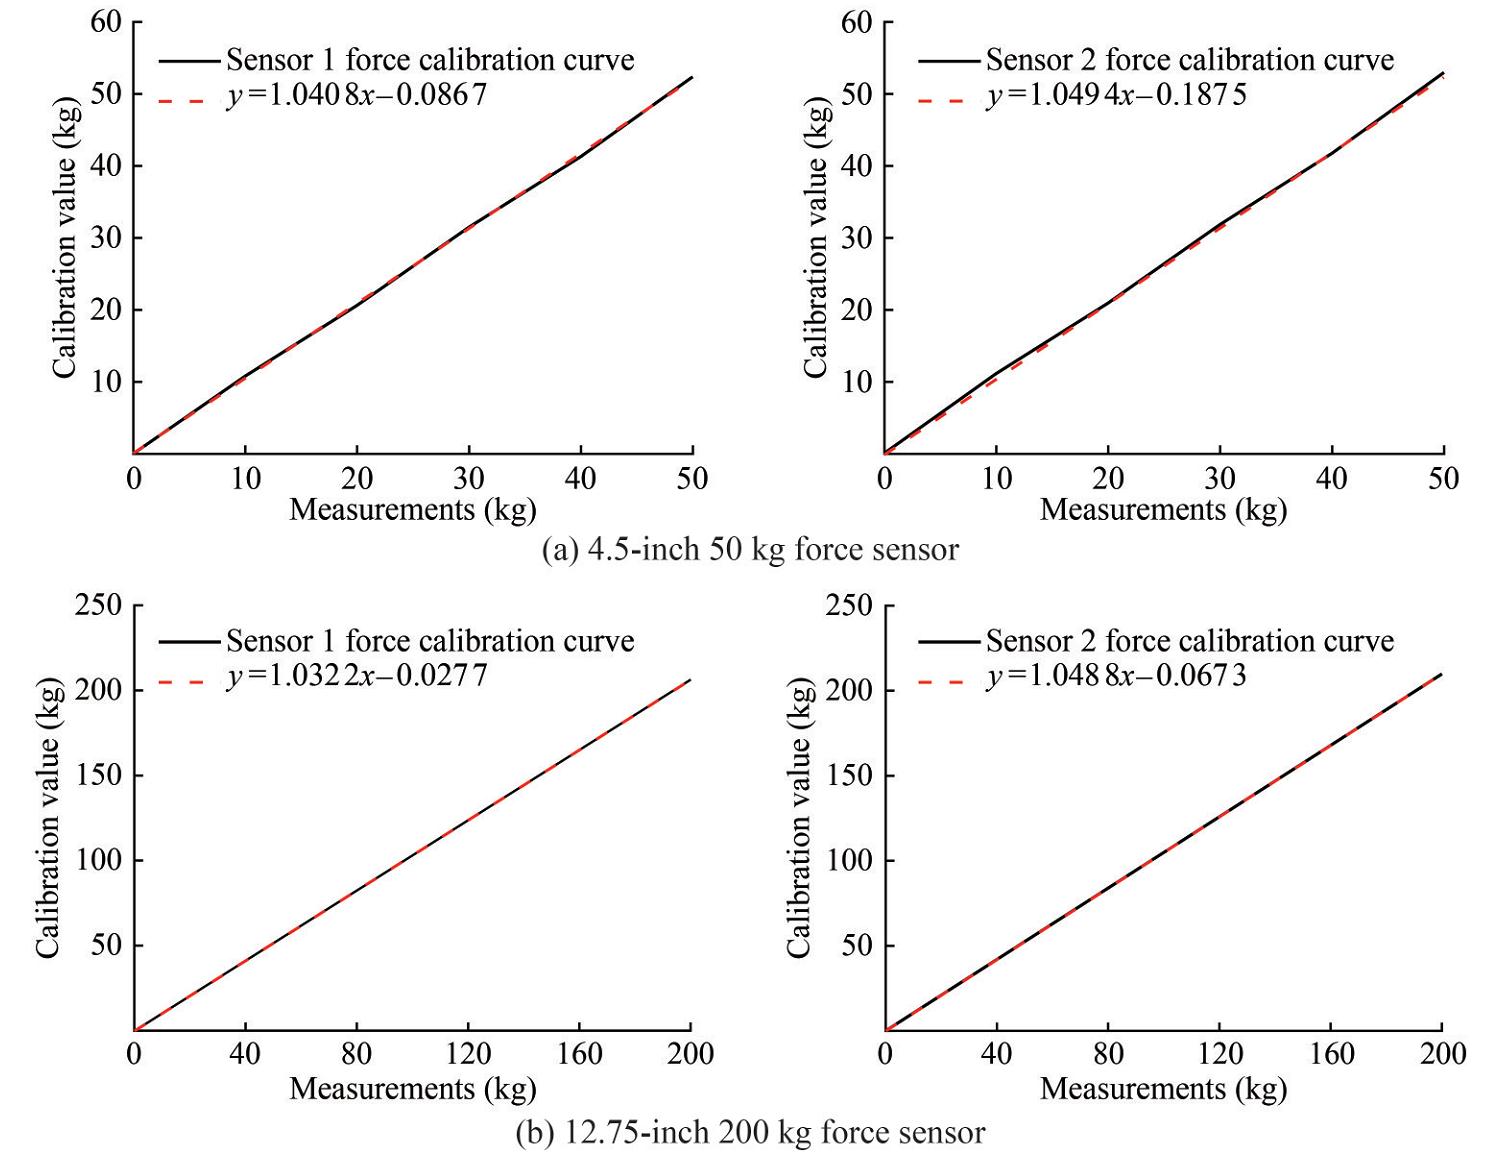 Figure 10 Calibration results of force sensor's errors
3.1.4 Hydrodynamic test plan
Two sizes of pipe models were used in the test, with diameters of 4.5 and 12.75 inches, each measuring 4.58 m in length. Helical strakes were installed on the surface of the test pipes. For the 4.5-inch helical strakes, the fin height is 28.4 mm, and the skin thickness is 10.05 mm; for the 12.75-inch helical strakes, the fin height is 82.64 mm, and the skin thickness is 20 mm. Considering that part of the helical strakes may fall off during the actual installation process, a 30% helical strake shedding test scheme is conducted to verify the vibration suppression effectiveness of the remaining strakes on the subsea pipelines. The test models are depicted in Figures 11 and 12.
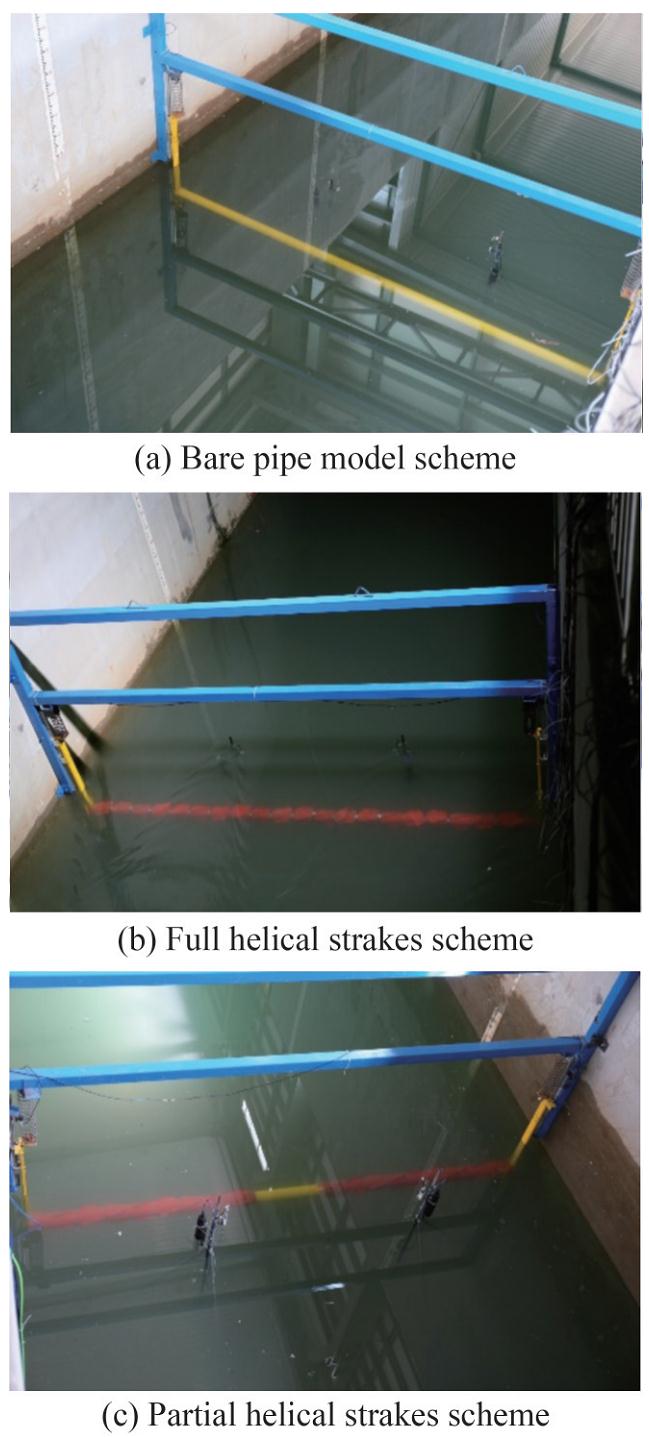 Figure 11 4.5-inch pipe test model scheme
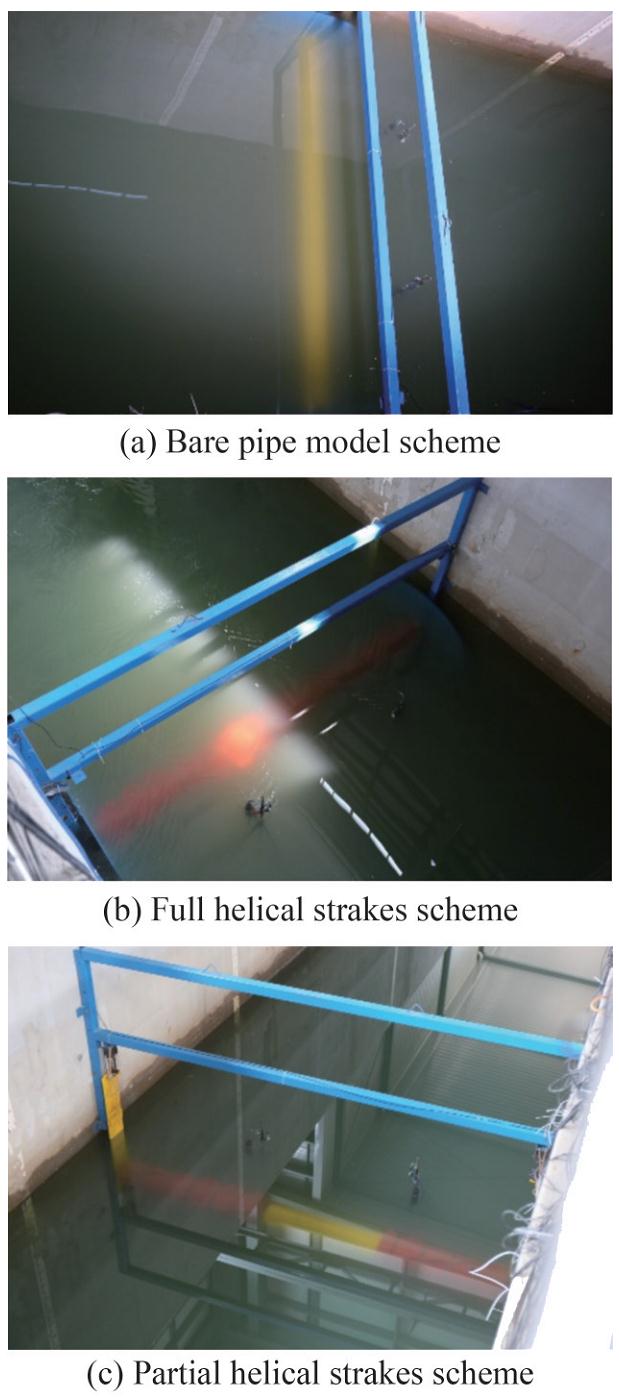 Figure 12 12.75-inch pipe test model scheme
3.2 Suppression efficiency test
The experimental procedure was systematically conducted as follows: once the water flow in the tank reached a stable state, a flowmeter was used to determine the vertical motion amplitude of the pipeline, as measured by the displacement sensors. The corresponding flow velocity was then recorded. Under identical flow velocity conditions, the motion amplitudes were separately measured for the fully covered helical strake configuration, the partially detached helical strake configuration, and the bare pipe. The differences in these amplitudes were used to evaluate the suppression effects.
To improve result accuracy and address error analysis, the initial 5 s of flow data were excluded to eliminate unstable flow effects. The average displacement was calculated using the stable portion of the data from the middle to later stages, and the differences in motion amplitude were used to quantify the suppression effects. During the experimental analysis, the following statistical processing methods were primarily applied: 1) detection and removal of outliers, along with data smoothing; 2) calculation of mean values through aggregation trend analysis; 3) periodicity and volatility analyses were performed to capture and interpret the dynamic motion characteristics. This methodology ensured the accuracy, reliability, and adequate reflection of the derived suppression effects of the experimental conditions.
3.2.1 Determination of the drag coefficient of the bare pipe model
The experimental design is used to investigate the suppression effect of the helical strakes at a flow velocity of 0.5 m/s. Figure 13 shows the original flow velocity data for the 4.5-inch bare pipe model and the pipe model with fully covered helical strakes. Notably, the flow velocity during testing fluctuates. Thus, the fluctuation range of the flow velocity, as measured by multiple velocity meters, is smaller after the installation of the helical strakes under the same flow conditions.
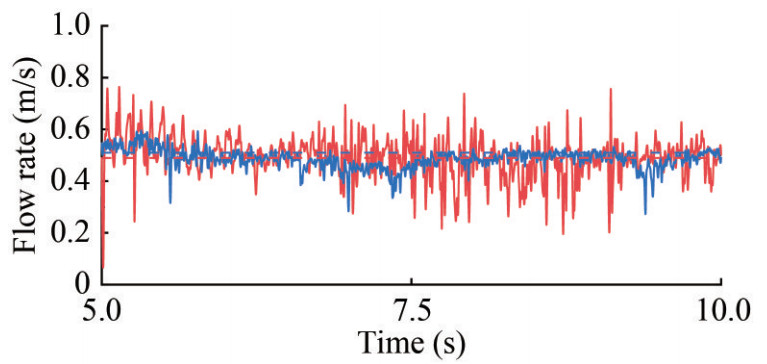 Figure 13 Original flow velocity data for bare pipe test and the pipe model with fully covered helical strakes (0.5 m/s)
Figure 14 presents the original displacement data for the bare pipe model and the pipe model with fully covered helical strakes under a flow velocity condition of 0.5 m/s. Notably, the bare pipe model exhibits a maximum average displacement of 152.16 mm, whereas the pipe model with fully covered helical strakes shows a dramatic reduction of 0.20 mm. This finding demonstrates that the arrangement of helical strakes notably reduces the motion amplitude of the pipe.
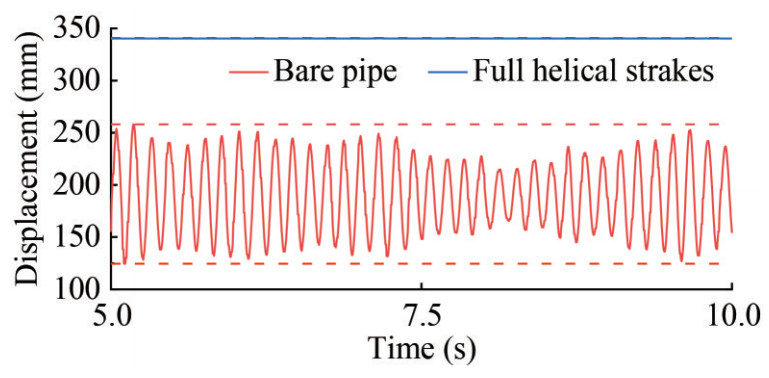 Figure 14 Original displacement data for the bare pipe model and the pipe model with fully covered helical strakes (0.5 m/s)
After stabilizing the water flow in the tank, the displacement sensor measures the vertical movement amplitude A0 of the measurement pipe using the flow meter, thereby determining the flow rate. The motion amplitudes A1 and A2 are then measured, and the suppression effects η1 and η2 are calculated using Equations (8) and (9). The test results are detailed in Table 3.
$$\eta_2=\frac{A_0-A_1}{A_0} \times 100 \% $$ (8) $$\eta_2=\frac{A_0-A_2}{A_0} \times 100 \%$$ (9) Table 3 Results of suppression rate for full coverage helical strakes and partially coverage pipe modelPipe diameter Bare pipe Full helical strakes 70% Coverage of helical strakes Flow rate (m/s) Displacement (mm) Flow rate (m/s) Displacement (mm) Suppression rate η1 (%) Flow rate (m/s) Displacement (mm) Suppression rate η2 (%) 4.5-inch 0.53 228.65 0.52 0.12 99.95 0.52 0.15 99.94 0.92 241.50 0.92 0.58 99.76 0.91 0.58 95.31 1.18 108.48 1.16 0.81 99.26 1.15 1.17 98.70 1.57 49.15 1.54 0.94 98.10 1.52 1.26 97.32 12.75-inch 0.53 308.35 0.52 10.67 96.85 0.51 9.72 96.85 0.93 220.80 0.84 3.32 98.50 0.89 15.32 93.06 1.18 195.70 1.23 3.20 98.36 1.15 13.91 92.89 1.55 171.82 1.60 9.27 94.61 1.52 9.78 94.31 The flow rate during the test, corresponding to the time when the pipe undergoes self-excited oscillation, ranges between 0.5 and 1.6 m/s. As shown in Table 3, the suppression efficiency of the 4.5-inch pipe model with fully covered helical strakes at the specified flow rates exceeds 98%. These results indicate that fully covered helical strakes are highly effective in suppressing VIV on subsea pipelines. Using the same test method, the displacement of the subsea pipe is measured at each flow velocity with 70% coverage of the helical strakes. The suppression efficiency is calculated and analyzed using the provided formula, as shown in Table 3.
Table 3 illustrates that, even with only 70% coverage of the pipes by helical strakes, the suppression of VIV remains extremely high. Consequently, in practical applications where installation issues or subsea currents cause up to 30% shedding of the helical strakes, the remaining strakes continue to effectively reduce the damage caused by VIV to the pipes. Testing for the 30% helical strake shedding scheme is conducted at different flow rates between 0.5 and 1.5 m/s. The results reveal that the suppression efficiency for the 4.5-inch pipe with partially shed helical strakes exceeds 97% and that for the 12.75-inch pipe is greater than 92%.
3.2.2 Determination of drag coefficient of pipe model with helical strakes
Two different flow rates are selected to measure the drag coefficient of the pipes with helical series. The original data for the flow velocity is 0.5 m/s, and the corresponding drag on the suspended pipe is shown in Figure 15. The average drag force is 908.29 N.
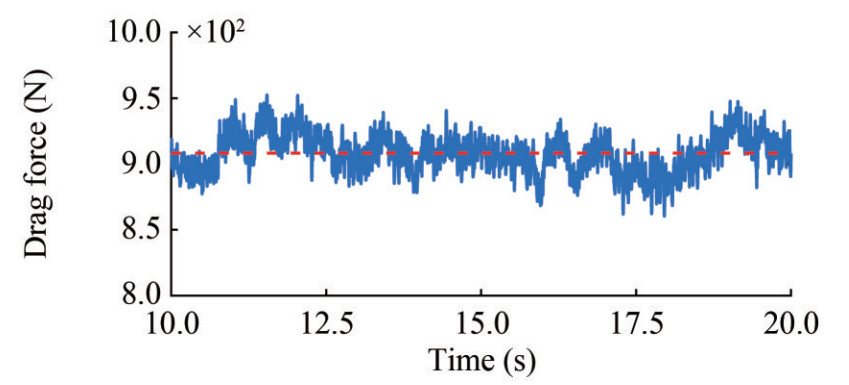 Figure 15 Original drag force data for the pipe model with fully covered helical strakes (0.5 m/s)
According to the measured drag values of the subsea pipe model with full coverage of the helical strakes at different flow rates, the corresponding drag coefficient can be calculated as follows:
$$C_d=\frac{F_d}{\frac{1}{2} \rho l u^2 d}$$ (10) As shown in Table 4, the drag coefficients of the 4.5-inch pipe model with full helical strakes range from 1.00 to 1.46, while those of the 12.75-inch pipe model with full helical strakes range from 0.92 to 1.49. The drag coefficients for both pipes are below 1.6. Considering the potential effects of the free liquid surface and the false bottom, the drag values for the 12.75-inch pipe model are higher than those observed in the bare pipe model.
Table 4 Results of drag coefficient for full coverage helical strakes pipe modelPipe diameter Flow rate (m/s) Hydrodynamic diameter (m) Shadow area (m2) Drag force (N) Drag coefficient 4.5-inch 0.52 0.142 0.65 87.91 1.00 0.92 0.142 0.65 389.02 1.41 1.16 0.142 0.65 617.04 1.41 1.54 0.142 0.65 1124.77 1.46 12.75-inch 0.52 0.372 1.70 207.83 0.92 0.84 0.372 1.70 708.56 1.18 1.23 0.372 1.70 1886.80 1.27 1.60 0.372 1.70 4319.50 1.49 Aiming to determine the drag coefficient of pipes with helical strakes under various flow conditions and evaluate the suppression efficiency of VIV, different parameter combinations are optimized through numerical simulations. Through the self-excited oscillation and drag force experiments, the fully covered helical strakes design achieves an excellent suppression rate exceeding 90% across a flow velocity range between 0.5 and 1.6 m/s. Additionally, for the installation scheme with 70% coverage of helical strakes, the suppression efficiency still exceeds 90%. The drag coefficient of the 4.5-inch pipe with fully helical strakes ranges from 1.00 to 1.54 within the flow velocity range of 0.5‒ 1.6 m/s, remaining below 1.6 at all tested flow velocities. These results meet the engineering and technical requirements, and the design parameters of the helical strakes provide a valuable reference for future engineering applications.
3.3 Research on key parameters of helical strake suppression effect
3.3.1 Numerical method validation
Figures 16 and 17 show the lift-drag coefficient curves for the bare pipe model, respectively, while Figure 18 displays the power spectral density distribution. The hydrodynamic experimental data obtained from the 4.5-inch rare pipe at a flow velocity of 0.5 m/s were compared with the numerical results to verify the accuracy of the numerical simulation. The comparison shows that the drag coefficient of the 4.5-inch rare pipe agrees well with the experimental results, demonstrating a maximum error lower than 5.9%. The fast Fourier transform of the lift coefficient reveals a Strouhal number of approximately 0.18 for the flow field under the specified pipe diameter, which deviates by only 0.02 from the oscillation experimental results. Further analysis indicates the shedding frequency of the vortex street is 0.316 Hz. These initial comparisons confirm the applicability and accuracy of the numerical simulation method used in this study.
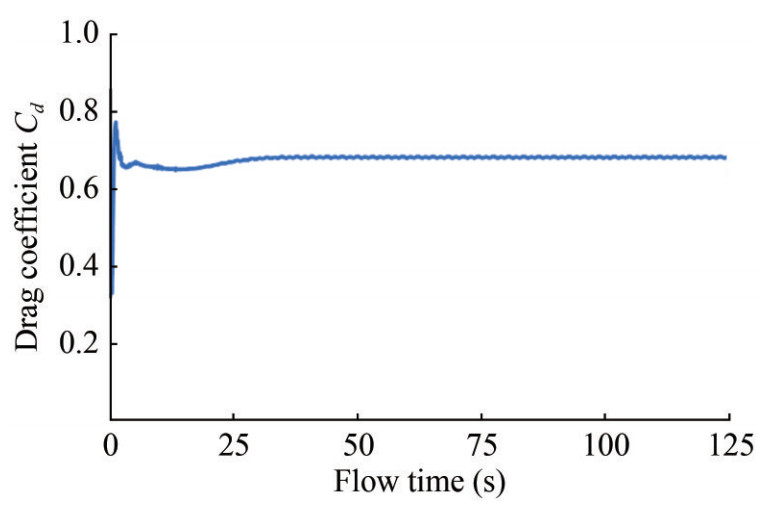 Figure 16 Drag coefficient curve of 4.5-inch bare pipe model (0.5 m/s)
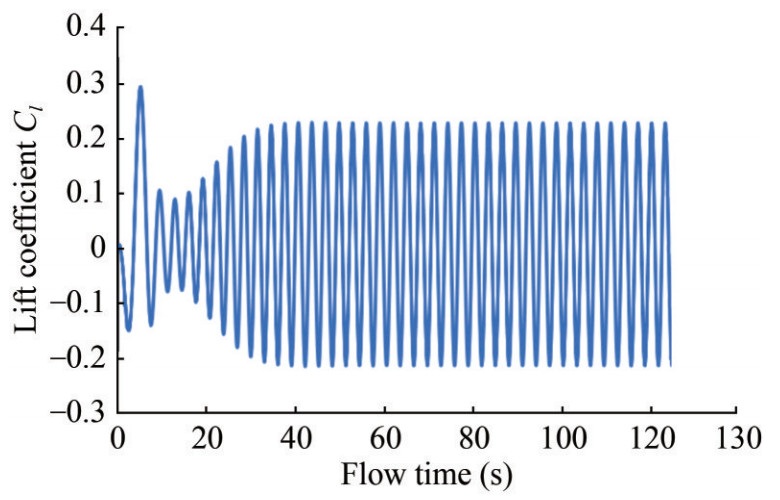 Figure 17 Lift coefficient curve of 4.5-inch bare pipe model (0.5 m/s)
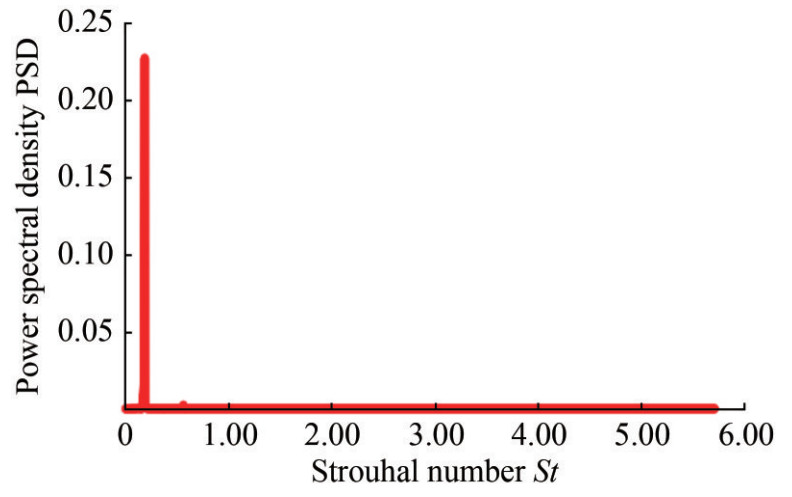 Figure 18 Power spectral density of 4.5-inch bare pipe model (0.5 m/s)
3.3.2 Influence of pitch and fin height on suppression effect
Table 5 presents the drag force coefficient and VIV suppression efficiency for each helical strakes model at flow velocities of 0.5, 1.5, and 2.5 m/s. The results show that when the fin height of the helical strakes is larger than 0.15D, the suppression efficiency reaches more than 90%. However, as the strake height decreases, the drag coefficient decreases when the strake height is 0.25D, and the drag coefficient decreases to approximately 2.1; when the strake height is 0.15D, the drag coefficient reduces to approximately 1.5. Across the flow velocity range of 0.5–2.5 m/s, the strakes with appropriate fin height and pitch effectively suppress the VIV response of the pipes, reducing the damage caused by VIVs. Furthermore, the drag force in the flow direction exerts an additional force on the pipe, serving as the excitation force for VIV. Although this additional force typically does not generate fluctuations, the long-term stress accumulation in the flow field may lead to fatigue damage of the crossflow pipe due to vortex shedding vibrations. Therefore, the model should aim to reduce the drag coefficient while effectively minimizing vortex shedding to suppress the VIV of the pipe. Aiming to improve economic benefits, the cost of manufacturing raw materials and processing should be minimized while still ensuring the helical strakes effectively suppress VIV. Overall, a pitch of 17.5D results in an excessively high drag coefficient to meet industry standards and actual requirements. The following optimization should focus on models with a pitch of 15D and a fin height of 0.2D to enhance the VIV suppression effect.
Table 5 Drag coefficient and VIV suppression efficiency of each helical strakes model at different flow rates at a 4.5-inch pipeFlow rate (m/s) Drag coefficient Cd Suppression rate η (%) 0.5 (m/s) 1.5 (m/s) 2.5 (m/s) 0.5 (m/s) 1.5 (m/s) 2.5 (m/s) Bare Pipe 0.68 0.68 0.69 ‒ ‒ ‒ 17.5D‒0.25D 2.07 2.12 2.02 99.1 98.8 98.5 17.5D‒0.20D 1.82 1.89 1.90 98.2 99.2 98.4 17.5D‒0.15D 1.75 1.76 1.77 99.7 98.4 97.2 15.0D‒0.25D 1.96 1.91 1.92 97.2 98.9 98.6 15.0D‒0.20D 1.81 1.82 1.83 94.0 95.2 95.2 15.0D‒0.15D 1.65 1.65 1.66 96.2 94.6 94.5 3.3.3 Influence of the width and density of the bandage installation groove on the suppression effect
The main factors affecting the suppression effectiveness of helical strakes include the pitch of the strake, the fin height, and the coverage rate. In engineering applications, the installation process of helical strakes is critical, typically involving the assembly of two semicircular strake sections to form a complete circle around the pipe, which is tightly fixed to the pipe body using a bandage. Investigating the influence of the bandage installation groove width and the fin edge slope on the restraining effect of the helical strakes is crucial.
Table 6 presents the results for a single-pitch model with a pipe diameter of 4.5 inches, a pitch of 15D, and a fin height of 0.2D. For this model, the arrangement comprises 6 grooves when the width is 28 mm and 12 grooves when the width is 56 mm, ensuring uniform distribution along the pipe length. The drag coefficient, lift coefficient, and VIV suppression efficiency of the pipe models with helical strakes are presented in Table 6. The overall drag coefficient after installing the groove is lower than that of the previous one, simultaneously enhancing the VIV suppression efficiency. Additionally, increasing the width and number of the bandage installation grooves helps to reduce the drag coefficient. The main reason is that increasing the width and number of installation grooves notably decreases the upstream area at the installation strakes, resulting in reduced drag exerted on the subsea pipe.
Table 6 Comparison of different installation groove parameter models with 15D pitch and 0.2D height at 4.5-inch pipeInstallation slot parameters Drag coefficient Cd Suppression rate η (%) Bare pipe 0.68 ‒ No mounting slot 1.82 95.2 28 mm × 60° 1.80 96.2 56 mm × 60° 1.78 94.9 28 mm × 12 ‒ 0° 1.75 95.4 28 mm × 12 ‒ 45° 1.59 98.8 28 mm × 12 ‒ 60° 1.48 92.0 3.3.4 Influence of fin edge slope on suppression effect
Table 6 presents the numerical results for the helical strakes on a 4.5-inch pipe with a pitch of 15D, a fin height of 0.2D, an installation groove width of 28 mm, spacing of 12 grooves per pitch length, and inclinations of 45° and 60°. Overall, the suppression efficiency of both helical strakes models, with a fin height of 15D, a pitch of 0.2D, and inclinations of 45° and 60°, exceeds 90%. The drag force coefficients for both models are less than 1.6, aligning with the industry practices. When considering suppression efficiency and drag parameters, the pipe model with a fin height of 15D, a pitch of 0.2D, and a slope of 45° demonstrates superior suppression efficiency.
3.3.5 Influence of helical strake shedding on suppression efficiency
After the installation of the helical strakes, the subsea pipelines must be hoisted into the air, passed through the splash zone, and then lowered and installed in place. During this process, the pipe is affected by dynamic loads from external waves, currents, and the motion response of the operating ship, which can lead to potential damage or misalignment. These conditions frequently result in the detachment and damage of the helical strakes. Therefore, considering the influence of helical strake shedding on the suppression efficiency during the lowering installation process is necessary. The main consideration is that the helical strakes may shed after the straps break, potentially exposing the bare pipe and causing leakage. The following numerical calculations assume that the helical strakes on the middle section of the pipe are shed.
Table 7 presents the numerical results for helical strakes on a 4.5-inch pipe featuring a pitch of 15D, a fin height of 0.2D, a width of 28 mm, a pitch of 12 slots per pitch, and a slope of 45° under different shedding conditions. The data reveal that even when 10%, 20%, and 30% of the helical strakes on the 4.5-inch pipe shed, the suppression efficiency remains above 90%. Additionally, the drag coefficient decreases to varying degrees as the shedding ratio increases.
Table 7 Effects of different shedding ratios on the drag coefficient and suppression efficiency at 4.5-inch pipePipe diameter and shedding ratio Drag coefficient Cd Suppression rate η (%) 4.5-inch-0% 1.59 98.8 4.5-inch-10% 1.22 97.2 4.5-inch-20% 1.09 97.8 4.5-inch-30% 1.03 95.6 4 Discussions
The experimental conditions presented in this study have several limitations. 1. Model and scale constraints. 1) Limited pipeline dimensions: This study focused on pipelines with diameters of 4.5 inches and 12.75 inches. These sizes may not adequately represent the characteristics of extremely small or large-diameter pipelines, particularly in terms of VIV and suppression efficiency. 2) Scaling effects: Although validated through numerical simulations, the scaling effects inherent in reduced-scale models may result in discrepancies when the results are extrapolated to large-scale marine engineering applications. 2. Simplified fluid dynamics: The experiments were conducted under specific flow conditions, such as selected velocity ranges, without considering complex oceanographic factors such as waves, tides, or variable turbulence intensities. This limitation could affect the real-world applicability of the findings. 3. Geometric parameter range. 1) Narrow scope of strake parameters: Although various geometric configurations were investigated, the study did not explore the full range of possible parameter combinations, such as large pitch values or a wide variation in fin heights. 2) Simplistic geometries: Only specific strake geometries were evaluated, overlooking potential designs such as asymmetric or variable-pitch strakes. 4. Optimization challenges: The optimization process primarily targeted suppression efficiency and drag coefficients without a comprehensive evaluation of other critical factors such as cost-effectiveness, manufacturing complexity, or environmental considerations.
5 Conclusions
The VIV suppression effect and unsteady hydrodynamic behaviors of helical strakes on subsea pipelines have been investigated using numerical simulation and experiments. The spring-pipe self-excited vibration experiment of 4.5-and 12.75-inch pipes was conducted to investigate the suppression efficiency and drag force coefficient of subsea pipelines with fully and partially covered helical strakes. The main conclusions are summarized as follows:
1) Helical strakes with a height greater than 0.15D achieved a suppression efficiency exceeding 90%. A decrease in the height of helical strakes led to a corresponding decline in the drag coefficient of the pipes, with the most substantial reduction in VIV observed in subsea pipelines equipped with helical strake heights of 0.15D. Notably, helical strakes with a pitch of 15D provided high suppression efficiency while keeping material costs relatively low when compared to those with lower pitch values.
2) As the width and number of bandage installation grooves increased, the drag coefficient effectively decreased, and the VIV suppression effect was improved. Particularly, helical strakes with a pitch of 15D, fin height of 0.2D, installation groove of 28 mm, and a fin edge slope of 45° demonstrated better suppression efficiency for the 4.5-inch pipe. These factors should be comprehensively considered in the design and practical application of helical strakes.
3) Additionally, the designed helical strakes maintained a suppression efficiency above 90% across the tested flow velocity range of 0.5–1.5 m/s, notably influencing the drag coefficient. This efficiency was also preserved even with up to 30% shedding of the strakes, emphasizing their durability and effectiveness under practical operational conditions. The drag force coefficient varies from 1.00 to 1.54 for the 4.5-inch pipe and 0.95 to 1.49 for the 12.75-inch pipe, both of which meet the engineering requirements for subsea applications.
Therefore, in future research, the proposed method should be verified and expanded to larger pipeline diameters under extreme working conditions. Additionally, a broad range of operating conditions, such as unsteady flow fields and complex flow field environments, should be considered. Finally, the following aspects of the helical strakes must also be considered: 1) Manufacturing cost assessment; 2) Installation and maintenance cost assessment; 3) Economic comparison; 4) Practical feasibility assessment of the design; 5) Comparison with existing solutions. By incorporating operational and maintenance costs, along with assessments of service life, the cost-effectiveness over the entire engineering lifecycle should be calculated to highlight the economic advantages of helical strake designs and provide a comprehensive basis for decision-making in engineering design and optimization.
Competing interest The authors have no competing interests to declare that are relevant to the content of this article. -
Figure 1 Schematic of flow field conditions
Figure 2 Structure diagram of full helical strakes model
Figure 3 Helical strakes model
Figure 4 Schematic of the test tank and the self-excited oscillation test device
Figure 5 Flow meter distribution and test arrangement
Figure 6 Pull wire displacement sensor and test arrangement
Figure 7 Installation diagram of a three-component force meter sensor
Figure 8 Calibration curve of spring stiffness
Figure 9 Calibration results of displacement sensor
Figure 10 Calibration results of force sensor's errors
Figure 11 4.5-inch pipe test model scheme
Figure 12 12.75-inch pipe test model scheme
Figure 13 Original flow velocity data for bare pipe test and the pipe model with fully covered helical strakes (0.5 m/s)
Figure 14 Original displacement data for the bare pipe model and the pipe model with fully covered helical strakes (0.5 m/s)
Figure 15 Original drag force data for the pipe model with fully covered helical strakes (0.5 m/s)
Figure 16 Drag coefficient curve of 4.5-inch bare pipe model (0.5 m/s)
Figure 17 Lift coefficient curve of 4.5-inch bare pipe model (0.5 m/s)
Figure 18 Power spectral density of 4.5-inch bare pipe model (0.5 m/s)
Table 1 Basic parameters of pipe, helical strakes, and flow field model
Pipe parameters 4.5-inch 12.75-inch Pipe diameter (m) 0.115 0.326 Pipe length (m) 4.580 4.580 Height from top (m) 1 1 Height from bottom (m) 1 1 Length from entrance (m) 2 2 Table 2 Verification of mesh size
Mesh Number of mesh Lift coefficient Drag coefficient Mesh 1 603 698 0.21 0.68 Mesh 2 1 527 096 0.22 0.68 Mesh 3 2 178 528 0.22 0.69 Mesh 4 3 153 286 0.22 0.69 Mesh 5 4 561 447 0.22 0.69 Table 3 Results of suppression rate for full coverage helical strakes and partially coverage pipe model
Pipe diameter Bare pipe Full helical strakes 70% Coverage of helical strakes Flow rate (m/s) Displacement (mm) Flow rate (m/s) Displacement (mm) Suppression rate η1 (%) Flow rate (m/s) Displacement (mm) Suppression rate η2 (%) 4.5-inch 0.53 228.65 0.52 0.12 99.95 0.52 0.15 99.94 0.92 241.50 0.92 0.58 99.76 0.91 0.58 95.31 1.18 108.48 1.16 0.81 99.26 1.15 1.17 98.70 1.57 49.15 1.54 0.94 98.10 1.52 1.26 97.32 12.75-inch 0.53 308.35 0.52 10.67 96.85 0.51 9.72 96.85 0.93 220.80 0.84 3.32 98.50 0.89 15.32 93.06 1.18 195.70 1.23 3.20 98.36 1.15 13.91 92.89 1.55 171.82 1.60 9.27 94.61 1.52 9.78 94.31 Table 4 Results of drag coefficient for full coverage helical strakes pipe model
Pipe diameter Flow rate (m/s) Hydrodynamic diameter (m) Shadow area (m2) Drag force (N) Drag coefficient 4.5-inch 0.52 0.142 0.65 87.91 1.00 0.92 0.142 0.65 389.02 1.41 1.16 0.142 0.65 617.04 1.41 1.54 0.142 0.65 1124.77 1.46 12.75-inch 0.52 0.372 1.70 207.83 0.92 0.84 0.372 1.70 708.56 1.18 1.23 0.372 1.70 1886.80 1.27 1.60 0.372 1.70 4319.50 1.49 Table 5 Drag coefficient and VIV suppression efficiency of each helical strakes model at different flow rates at a 4.5-inch pipe
Flow rate (m/s) Drag coefficient Cd Suppression rate η (%) 0.5 (m/s) 1.5 (m/s) 2.5 (m/s) 0.5 (m/s) 1.5 (m/s) 2.5 (m/s) Bare Pipe 0.68 0.68 0.69 ‒ ‒ ‒ 17.5D‒0.25D 2.07 2.12 2.02 99.1 98.8 98.5 17.5D‒0.20D 1.82 1.89 1.90 98.2 99.2 98.4 17.5D‒0.15D 1.75 1.76 1.77 99.7 98.4 97.2 15.0D‒0.25D 1.96 1.91 1.92 97.2 98.9 98.6 15.0D‒0.20D 1.81 1.82 1.83 94.0 95.2 95.2 15.0D‒0.15D 1.65 1.65 1.66 96.2 94.6 94.5 Table 6 Comparison of different installation groove parameter models with 15D pitch and 0.2D height at 4.5-inch pipe
Installation slot parameters Drag coefficient Cd Suppression rate η (%) Bare pipe 0.68 ‒ No mounting slot 1.82 95.2 28 mm × 60° 1.80 96.2 56 mm × 60° 1.78 94.9 28 mm × 12 ‒ 0° 1.75 95.4 28 mm × 12 ‒ 45° 1.59 98.8 28 mm × 12 ‒ 60° 1.48 92.0 Table 7 Effects of different shedding ratios on the drag coefficient and suppression efficiency at 4.5-inch pipe
Pipe diameter and shedding ratio Drag coefficient Cd Suppression rate η (%) 4.5-inch-0% 1.59 98.8 4.5-inch-10% 1.22 97.2 4.5-inch-20% 1.09 97.8 4.5-inch-30% 1.03 95.6 -
Assi GRS, Crespi T, Gharib M (2022) Novel geometries of serrated helical strakes to suppress vortex-induced vibrations and reduce drag. Applied Ocean Research 120: 103034. https://doi.org/10.1016/j.apor.2021.103034 Bennia A, Loukarfi L, Khelil A, Mohamadi S, Braikia M, Naji H (2016) Contribution to the experimental and numerical dynamic study of a turbulent jet issued from lobed diffuser. Journal of Applied Fluid Mechanics 9(6): 2957-2967. https://doi.org/10.29252/jafm.09.06.25953 Chen D, Zhang X, Rao Z, Lin Y, Pan G, Li J (2024) Dynamic design method of vortex induced vibration suppression device for strakes at high reynolds number. In: Rui X, Liu C (eds) Proceedings of the 2nd International Conference on Mechanical System Dynamics. Springer Nature, Singapore, 3081-3095 Gao Y, Fu S, Cao J, Chen Y (2015) Experimental study on response performance of VIV of a flexible riser with helical strakes. China Ocean Engineering 29(5): 673-690. https://doi.org/10.1007/s13344-015-0048-5 Gao Y, Yang J, Xiong Y, Wang M, Lu D (2017) VIV response of a long flexible riser fitted with different helical strake coverages in uniform and linearly sheared currents. Ships and Offshore Structures 12(4): 575-590. https://doi.org/10.1080/17445302.2016.1187832 Gao Y, Yang J, Xiong Y, Wang M, Peng G (2016) Experimental investigation of the effects of the coverage of helical strakes on the vortex-induced vibration response of a flexible riser. Applied Ocean Research 59:53-64. https://doi.org/10.1016/j.apor.2016.03.016 Guo X, Liu X, Zhang C, Jing S, Hou F (2023) Impact of high-speed turbidity currents on offshore spanning pipelines. Ocean Engineering 287: 115797. https://doi.org/10.1016/j.oceaneng.2023.115797 Han X, Lin W, Zhang X, Tang Y, Zhao C (2016) Two degree of freedom flow-induced vibration of cylindrical structures in marine environments: frequency ratio effects. J Mar Sci Technol 21(3): 479-492. https://doi.org/10.1007/s00773-016-0370-5 Huang S (2011) VIV suppression of a two-degree-of-freedom circular cylinder and drag reduction of a fixed circular cylinder by the use of helical grooves. Journal of Fluids and Structures 27(7): 1124-1133. https://doi.org/10.1016/j.fluidstructs.2011.07.005 Ji B, Luo XW, Wang X, Peng XX, Wu YL, Xu HY (2011) Unsteady numerical simulation of cavitating turbulent flow around a highly skewed model marine propeller. Journal of Fluids Engineering 133(1): 011102. https://doi.org/10.1115/1.4003355 Korkischko I, Meneghini JR (2010) Experimental investigation of flow-induced vibration on isolated and tandem circular cylinders fitted with strakes. Journal of Fluids and Structures 26(4): 611-625. https://doi.org/10.1016/j.jfluidstructs.2010.03.001 Li P, Liu L, Dong Z, Wang F, Guo H (2020) Investigation on the spoiler vibration suppression mechanism of discrete helical strakes of deep-sea riser undergoing vortex-induced vibration. International Journal of Mechanical Sciences 172: 105410. https://doi.org/10.1016/j.ijmecsci.2019.105410 Lou M, Chen Z, Chen P (2016) Experimental investigation of the suppression of vortex induced vibration of two interfering risers with splitter plates. Journal of Natural Gas Science and Engineering 35: 736-752. https://doi.org/10.1016/j.jngse.2016.09.012 Mao L, Wu M, Zhang W, Guo C, Zeng S (2023) Analysis of large deformation of deep water drilling riser considering vortex-induced vibration. Applied Ocean Research 133: 103484. https://doi.org/10.1016/j.apor.2023.103484 Ministry of Water Resources (2012) SL155-2012 Hydraulic (Conventional) Model Test Specification Quen LK, Abu A, Kato N, Muhamad P, Sahekhaini A, Abdullah H (2014) Investigation on the effectiveness of helical strakes in suppressing VIV of flexible riser. Applied Ocean Research 44: 82-91. https://doi.org/10.1016/j.apor.2013.11.006 Quen LK, Abu A, Kato N, Muhamad P, Tan LK, Kang HS (2018) Performance of two- and three-start helical strakes in suppressing the vortex-induced vibration of a low mass ratio flexible cylinder. Ocean Engineering 166: 253-261. https://doi.org/10.1016/j.oceaneng.2018.08.008 Ranjith ER, Sunil AS, Pauly L (2016) Analysis of flow over a circular cylinder fitted with helical strakes. Procedia Technology 24: 452-460. https://doi.org/10.1016/j.protcy.2016.05.062 Ren H, Xu Y, Cheng J, Cao P, Zhang M, Fu S, Zhu Z (2019) Vortex-induced vibration of flexible pipe fitted with helical strakes in oscillatory flow. Ocean Engineering 189: 106274. https://doi.org/10.1016/j.oceaneng.2019.106274 Sui J, Wang J, Liang S, Tian Q (2016) VIV suppression for a large mass-damping cylinder attached with helical strakes. Journal of Fluids and Structures 62: 125-146. https://doi.org/10.1016/j.jfluidstructs.2016.01.005 Trim AD, Braaten H, Lie H, Tognarelli MA (2005) Experimental investigation of vortex-induced vibration of long marine risers. Journal of Fluids and Structures 21(3): 335-361. https://doi.org/10.1016/j.jfluidstructs.2005.07.014 Ulveseter JV, Thorsen MJ, Sævik S, Larsen CM (2018) Time domain simulation of riser VIV in current and irregular waves. Marine Structures 60: 241-260. https://doi.org/10.1016/j.marstruc.2018.04.001 Williamson CHK, Govardhan R (2004) Vortex-induced vibrations. Annual Review of Fluid Mechanics 36: 413-455. https://doi.org/10.1146/annurev.fluid.36.050802.122128 Wu X, Li J, Huang S, Zha R (2024) Flow-induced transverse vibration of three equal-diameter cylinders in an equilateral triangle using the immersed boundary – Lattice Boltzmann flux solver. J Marine Sci Appl. https://doi.org/10.1007/s11804-024-00461-y Xu W, Luan Y, Liu L, Wu Y (2017) Influences of the helical strake cross-section shape on vortex-induced vibrations suppression for a long flexible cylinder. China Ocean Eng 31(4): 438-446. https://doi.org/10.1007/s13344-017-0050-1 Yin D, Lie H, Baarholm RJ (2017) Prototype reynolds number vortex-induced vibration tests on a full-scale rigid riser. Journal of Offshore Mechanics and Arctic Engineering 140:011702. https://doi.org/10.1115/1.4037538 Zhao M (2023) A review of recent studies on the control of vortex-induced vibration of circular cylinders. Ocean Engineering 285: 115389. https://doi.org/10.1016/j.oceaneng.2023.115389 Zhu H, Zhao H, Srinil N (2021) Experimental investigation on vortex-induced vibration and solid-structure impact of a near-bottom horizontal flexible pipeline in oblique shear flow. Journal of Fluids and Structures 106: 103356. https://doi.org/10.1016/j.jfluidstructs.2021.103356
