
Long-Term Trends of Extreme Waves Based on Observations from Five Stations in China
https://doi.org/10.1007/s11804-024-00436-z
-
Abstract
Extreme waves may considerably impact crucial coastal and marine engineering structures. The First Scientific Assessment Report on Ocean and Climate Change of China and The Fourth Assessment Report on Climate Change of China were published in 2020 and 2022, respectively. However, no concrete results on the long-term trends in wave changes in China have been obtained. In this study, long-term trends in extreme wave elements over the past 55 years were investigated using wave data from five in situ observation sites (i.e., Lao Hu Tan, Cheng Shan Tou, Ri Zhao, Nan Ji, Wei Zhou) along the coast of China. The five stations showed different trends in wave height. Results show a general downward trend in wave heights at the LHT and CST stations, reaching −0.78 and −1.44 cm/a, respectively, in summer at middle and high latitudes. NJI stations at middle-to-low latitudes are influenced by the winter monsoon and summer tropical cyclones, showing a substantial increase in extreme wave heights (0.7 cm/a in winter and 2.68 cm/a in summer). The cumulative duration of H1/10 ≥ 3 m at NJI and RZH has grown since 1990.Article Highlights● Long-term trends in 55 years of extreme waves offshore China were analysed based on observational data.● The influence of wind and atmospheric circulation systems on long-term trends in waves were explored.● Statistics on the number of occurrences and duration of catastrophic waves at five stations.● The wave height monthly maximum distribution was analysed using the generalized extreme value (GEV) model. -
1 Introduction
Extreme meteorological conditions, such as typhoons, may create extreme waves and surges and result in fatalities and economic destruction. China has nearly 3 000 000 km2 of marine area, and frequent marine disasters have led to substantial financial damage and casualties along its coastlines. Hazards associated with extreme waves may lead to devastating marine disasters and cannot be ignored. Further research into the characteristics of their distribution and evolution is essential because extreme nearshore waves have long-term effects on engineering structures and the environment, and human activities and navigation operations are frequent in coastal areas (He and Xu, 2016; Young, 1999). In recent decades, owing to widespread awareness of global phenomena, such as climate change and increasing sea levels, increasing extreme wave events have drawn the attention of researchers. Changes in global temperature and the occurrence of cyclones are closely associated. The frequency and strength of cyclones and the frequency and intensity of extreme waves may increase because of global warming (Wang et al., 2023).
Currently, numerical simulations and in situ observations are the two main approaches for investigating long-term wave trends. In situ observation data are generally limited because collecting wave observation data is time-consuming and expensive. Thus, researchers frequently conduct wave hindcast simulations based on numerical wave models to generate large-scale and long-term series of wave data for further analysis. Li et al. (2018) used different numerical wave models for long-term wave hindcast simulations to study long-term wave climate variability in the China Sea and the Northwest Pacific. Adopting a third-generation wave model, He et al. (2018) simulated the East China Sea wave field from 1988 to 2002. Wave height and mean wave period markedly decreased from the outer sea in the southeast to the continental region in the northwest. Zhai et al. (2019) used the simulating waves nearshore (SWAN) to investigate inter-annual wave climate variability in the Yellow Sea. Liang et al. (2014) also used SWAN to simulate wave parameters in the Bohai, Yellow, and East China Seas for over 22 years, and the wave energy showed strong seasonal variations, which occurred strongly in winter. Researchers are currently studying wave climate variability and long-term trends in many areas of the globe (Aarnes et al., 2015; Kumar et al., 2018; Pomaro et al., 2017). Large spatial and temporal scales and cheap processing costs are the benefits of numerical models. However, numerical results should be validated further because of initial field errors, topographic effects, and uncertain wave-generating mechanisms in numerical simulations, which have not yet achieved the desired results in nearshore seas. By contrast, statistical analysis of wave components based on observational data is appropriate for revealing long-term wave characteristics along coasts.
Sasaki (2012) estimated long-term trends in climatology and wave energy near Japan for over 30 years by using in situ wave data collected at 25 stations between 1980 and 2009; they showed that long-term trends varied by region and season and the east coast of Japan showed a distinct upward trend in wave energy; they concluded that the increased frequency of swells in recent decades is responsible for this upward trend. Guillou (2020) used 17 wave buoys in the Northwest Atlantic, Gulf of Mexico, and Caribbean Sea to conduct long-term observation of wave conditions at mean water depths of more than 600 m to evaluate differences associated with the simplified formulations of available wave energy fluxes based on energy and peak periods. Defne et al. (2009) performed a series of wave observations along the Atlantic coast of the southeastern United States and discovered that a wave energy formula based on significant wave height and wave energy period overestimated available wave energy by 40%. Saulnier et al. (2012) discussed the sea conditions near the wave hub test facility of the wave energy facility in Cornwall, UK, on the basis of a unique array of four simultaneously scheduled SEAWATCH Mini Ⅱ buoys in February 2010. Jiang and Yang (2022) proposed a model to separate wind and swell waves, and investigated the trends in the global wind and swell climate with 27 years of jointly calibrated altimeter data. Yaakob et al. (2016) analyzed wave energy in the various regions of the South China Sea by using satellite altimeter data from 2001 to 2010. Wu et al. (2015) evaluated offshore wave energy resources at six locations in the East China Sea by using wave measurement data from 2011 to 2013 collected by wave buoys. However, their analysis periods were insufficient for the assessment of the climatology because estimates based on short-term observations can be influenced by inter-annual or decadal climate variability or both. Moreover, the majority of long-term wave trend studies in Chinese coasts have used numerical model data, while studies based on measurement wave data are rare.
The First Scientific Assessment Report on Ocean and Climate Change of China and The Fourth Assessment Report on Climate Change of China were published in 2020 and 2022, respectively, but no concrete results on the long-term trends of wave changes in China have been obtained because of the lack of observation analysis. Long-term observational data are thus essential to studies on the effects of climate change on wave climate. In this study, the 55-year data of the five offshore wave observation stations in China were used for the first time. Long-term wave trends were determined by analyzing the data. Section 1 introduces the development of related research, and Section 2 presents the use of the dataset and the assessment methodologies. The assessment results are displayed in Section 3. Section 4 discusses the effects of the wind, atmospheric circulation systems, and monsoon climate. Moreover, disastrous wave events, extreme wave elements, and return periods are elaborated in this section. Conclusions and summary are provided in Section 5.
2 Observational data and method
2.1 Wave observation station data
The wind and wave observations of the five offshore stations of China were provided by the National Marine Data Information (NMDIS; https://mds.nmdis.org.cn/pages/home.html). The spatial distribution of the stations is depicted in Figure 1. The Bohai, Yellow, East China, and South China Seas are the four major seas in China. The five stations are representative. Table 1 contains comprehensive information on the five stations, each of which has made observations for more than 55 years. The observation methods include manual observation and buoy measurement. Before 2011, observations were conducted manually at 8:00, 11:00, 14:00, and 17:00, and wind and wave parameters were recorded. Since 2011, buoy observations have been initiated at some stations, the temporal resolutions of recorded data have been extended to 1 hour, and 24 observations are conducted daily. The key wave elements recorded include maximum single-wave height Hmax, its corresponding period Tmax, mean wave height H, mean period T, significant wave height Hs, its corresponding period Ts, mean wave height H1/10 for the first 1/10 major waves, and its corresponding period T1/10. The primary wind elements recorded are wind speed and wind direction above the sea level at 10 m height.
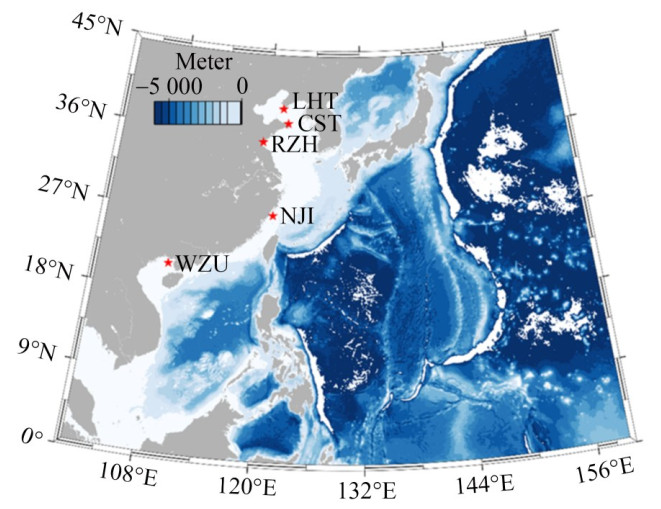 Figure 1 Wave observation stations in ChinaTable 1 Details of the wave observation station. A slash (/) denotes not a number (NaN)
Stations Longitude Latitude Manual observation Buoy observations Data volumes LHT 121.68°E 38.87°N 1963–2011 2011–2018 134 414 CST 122.42°E 37.33°N 1960–2011 2011–2018 158 346 RZH 119.23°E 35.23°N 1960–2012 2012–2018 152 397 NJI 121.05°E 27.27°N 1960–2011 2011–2018 152 707 WZU 109.05°E 21.01°N 1962–2018 / 94 516 2.2 Quality assessment of observational data
2.2.1 Data consistency assessment
For scientific research and maritime engineering, changes in the continuity and consistency of wave height and periods can present considerable obstacles. Climate variability studies depend on the consistency of data for long-term trend analyses.
LHT, CST, NJI, and RZH switched their data measurement methods from manual to buoy measurements in 2011 and 2012. The consistency of the wave observations acquired by the two observation methods must be confirmed because manual and automatic buoy observations use different instrumentation principles and observation techniques. Liu et al. (2017) investigated the effects of different observation methods on wave parameters from these stations; they demonstrated that different observation methods resulted in changes in the monthly mean values of Hmax and H1/10, especially at the NJI station, where the monthly mean values increased by 0.2 and 0.1 m, respectively; however, changes in observation methods had no significant effects on the maximum values of Hmax and H1/10. We mainly focused on the long-term trends in the maximum values of Hmax and H1/10. The above findings indicated that change in observation method influences wave parameters. Nevertheless, such a change did not greatly affect the main results of the present study.
2.2.2 Data filtering and data coverage ratio statistics
The measured wave data for the five stations underwent stringent quality checks before use, and the quality-control algorithm proposed by Wang et al. (2019). The quality-control algorithm included two part as follow: 1) observations that are beyond the physical range (breaking wave height less than that caused by water depth) and 2) observations with a sliding window of 1 month. The deviation is more than five times that of the standard deviation from the monthly mean or the later point of the observation. The data filtered through the two methods is retained. The coverage of the different wind and wave parameters is recorded in Table 2.
Table 2 Coverage ratio for wave data (%)Variables LHT CST RZH NJI WZU Hmax 78.3 61.4 91.3 98.3 89 Tmax 43.1 53.1 60.7 54.7 26.7 H1/10 78.3 62.4 91.9 98.3 89.1 T1/10 43.1 53.1 60.7 55.2 26.7 Hs 43.1 53.1 60.7 54.7 26.7 Ts 43.1 53.1 60.7 54.7 26.7 Hmean 43.0 53.0 60.5 54.7 26.7 Tmean 78.2 62.3 91.9 98.3 89.1 Wdir 77.9 70.4 72.7 86.4 51.5 Wspd 80.2 71.4 74.4 87.2 53.3 2.3 Mann–Kendall test
The Mann–Kendall approach is a nonparametric statistical tool for identifying and predicting climate change. With the advantage of not requiring adherence to a specific distribution in the sample, being unaffected by a few outliers, and being more applicable to type and order variables, the Mann – Kendall test can be used to determine whether or not there are climate mutations in a climate series. Mann and Kendall proposed the principle and developed the method (Forthofer and Lehnen, 1981; Mann, 1945). The MK statistic employs the following formula:
$$ S=\sum\limits_{i=1}^{n-1} \sum\limits_{j=i+1}^n \operatorname{sgn}\left(x_j-x_i\right) $$ (1) $$ \operatorname{sgn}\left(x_j-x_i\right)=\left\{\begin{aligned} 1, & \text { if }\left(x_j-x_i\right)>0 \\ 0, & \text { if }\left(x_j-x_i\right)=0 \\ -1, & \text { if }\left(x_j-x_i\right)<0 \end{aligned}\right. $$ (2) where n is the number of the data and xi and xj are the data at moments i and j, respectively. For the assumption of the null hypothesis, S is symmetrically and normally distributed, and a mean of zero and variance are provided by Equation (3).
$$ \operatorname{Var}(S)=\left[n(n-1)(2 n+5)-\sum\limits_{i=1}^n t_i i(i-1)(2 i+5)\right] / 18 $$ (3) where ti is the number of data of the i-order tied group.
Given the variance Var (S), the standardized test statistic Z can be calculated as follows:
$$ Z=\left\{\begin{array}{lll} \frac{S-1}{\sqrt{\operatorname{Var}(S)}} & \text { for } & S>0 \\ 0 & \text { for } & S=0 \\ \frac{S+1}{\sqrt{\operatorname{Var}(S)}} & \text { for } & S<0 \end{array}\right. $$ (4) The importance of trends can be assessed for a given significance level α. The Z-value is calculated and compared with the confidence level of the standard normal distribution. The trend of data change at that confidence level is considered significant if the absolute value of Z is greater than the Z-value at the equivalent level of the standard normal distribution. In this research, the levels of confidence are set at 90%, 95%, and 99%, respectively. The calculation results are shown in Tables 3 and 4.
Table 3 Results of the trend analysis (cm/a) for the yearly and seasonal H1/10 (max and mean) values for three different SL: 90% (*), 95% (**), and 99% (***)Stations H1/10 (max) H1/10 (mean) Annual DJF JJA Annual DJF JJA LHT −1.10*** −0.50*** −0.78*** −0.10*** −0.17*** −0.13*** CST −3.10** 0.08 −1.44 −0.40*** −0.42*** −0.25** RZH 2.50*** 1.30*** 1.06*** 0.20*** 0.32*** 0.07 NJI 3.60* 0.70* 2.68** 0.70*** 0.63*** 0.83*** WZU −1.10*** 0.02 −1.10*** ‒ 0.14 −0.31*** Table 4 Results of the trend analysis (s/a) for the yearly and seasonal Tmean (max and mean) values for three different SLs: 90% (*), 95% (**), and 99% (***)Stations Tmean (max) Tmean (mean) Annual DJF JJA Annual DJF JJA LHT 0.044* 0.002 7* 0.008 8** 0.003** 0.001 5*** 0.000 7** CST 0.004 −0.022 3** 0.000 5 −0.004** −0.004 8 −0.003* RZH 0.015 −0.005 3 0.004 4 −0.002 −0.003 −0.001 9 NJI 0.004 −0.010 5*** 0.003 5 ‒ −0.000 1 −0.004** WZU −0.01*** −0.000 1 −0.02*** 0.001 0.01*** −0.01*** 3 Analysis of long-term trends
3.1 Long-term trends in wave parameters
Figure 2 depicts the trends of H1/10 annual maximum and annual mean values for 5 stations in China. The trend was assessed using the Mann–Kendall test (see Table 3). The H1/10 yearly maximums of the 5 stations, with the exception of NJI station, typically vary from 2 m to 10 m. And NJI station experiences exceptional conditions in specific years. The only two stations with a noticeable increase trend of the annual maximum of H1/10 (2.5 cm/a and 3.6 cm/a, respectively) are RZH and NJI. The annual maximum of H1/10 for the other three stations demonstrates a definite downward tendency. In addition, the trend of the H1/10 annual maximum at the five stations is significantly greater than the trend of the H1/10 annual mean, which is consistent with previous findings (Young et al., 2011). Table 6 provides an overview of earlier research on long-term wave trends in certain regions of the world. There was an overall upward trend in wave heights globally. In the China Sea, the results of Young et al. (2011) were slightly larger than those of Semedo et al. (2011) (0.5–1.5 cm/a) and Wang et al. (2016) (0.5–1 cm/a). Young et al. (2011) used altimeter data from GEOSAT spanning 23 years. Semedo et al. (2011) used ERA-40 wave reanalysis data. According to Semedo et al. (2011), the ERA-40 tended to overestimate low wave heights and underestimate high wave heights. This characteristic was universal and general in nature (Caires and Sterl, 2005). The trend of the annual maximum and annual mean values of Hmax is depicted in Figure 3. The increasing trend of Hmax follows a similar pattern to H1/10, with a greater amplitude than H1/10. However, the negative trend of Hmax has a much smaller amplitude than H1/10. Table 3 provides the trends of the wave parameters at the five stations.
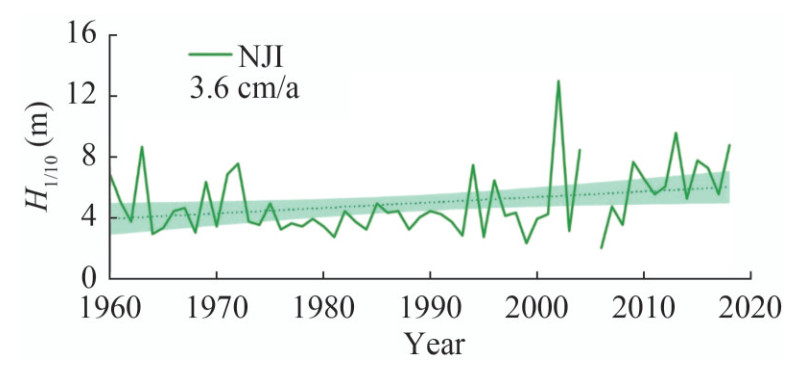 Figure 2 Time series of annual maximum H1/10 from NJI observation stations. Trends (colored dashed lines) represent linear regressions of annual H1/10. Shaded areas are 95% confidence intervalsTable 5 Linear trend of wave parameters at 5 observation stations. A dash (‒) denotes no significant trends
Wave parameters LHT CST RZH NJI WZU H1/10 (max) (cm/a) −1.1 −3.1 2.5 3.6 −1.1 H1/10 (mean) (cm/a) −0.1 −0.4 0.2 0.7 ‒ Hmax (max) (cm/a) 0.1 −1.5 4.5 5.3 −0.5 Hmax (mean) (cm/a) −0.1 −0.3 0.4 1.2 0.1 Tmean (max) (s/a) 0.044 0.004 0.015 0.004 −0.006 Tmean (mean) (s/a) 0.003 −0.004 −0.002 ‒ 0.001 Table 6 Statistics of the long-term trend in global wave heightRegion Period (a) Wave height Trend (cm/a) Reference North atlantic 1962–1985 Hs 3.4 Carter and Draper (1988) North atlantic 1950–1990 Hs 2.2 Bacon and Carter (1993) Northwest atlantic and Northeast atlantic 1961–1987 Hs 2.3, 2.7 Bouws et al. (1996) U.S. Pacific northwest 1992–2012 Hs 4.2 (46 059) Sasaki (2014) Gulf of mexico 1985–2008 99th Hs 2.41 (42 001), 1.46 (42 002) Young et al. (2011) North atlantic 2.74 (44 004), 5.2 (44 011), 2.82 (41 002) North pacific 3.03 (46 001), 2.59 (46 002), 4.5 (46 005), 2.64 (46 006), 2.59 (46 035) Hawaii −0.06 (51 001), 0.66 (51 002) East china sea 1979–2014 90th Hs 0.5–1 Wang et al. (2016) 1997–2016 Hs 5 (maximum) Feng et al. (2018) Central arabian sea 1996–2012 Hs 0.63 (mean), −2.66 (maximum) Hithin et al. (2015) Chinese coast 1979–2017 99th Hs 3 (maximum) Shi et al. (2019) 1985–2008 Hs 2.64–4.5 Young et al. (2011) 1988–2011 Hs Tsushima Strait (> 3.0), waters near the Ryukyu Islands (2.5–3.5), the Taiwan Strait (> 2.5), large areas to the north of 15°N in the SCS (> 3.0), and southwest of the Taiwan Strait (> 4.0). Zheng et al. (2017) 1957–2002 Hs 0.5–1.5 Semedo et al. (2011) Shandong (China) 1988–2011 Hs 4.5 Zheng et al. (2015) 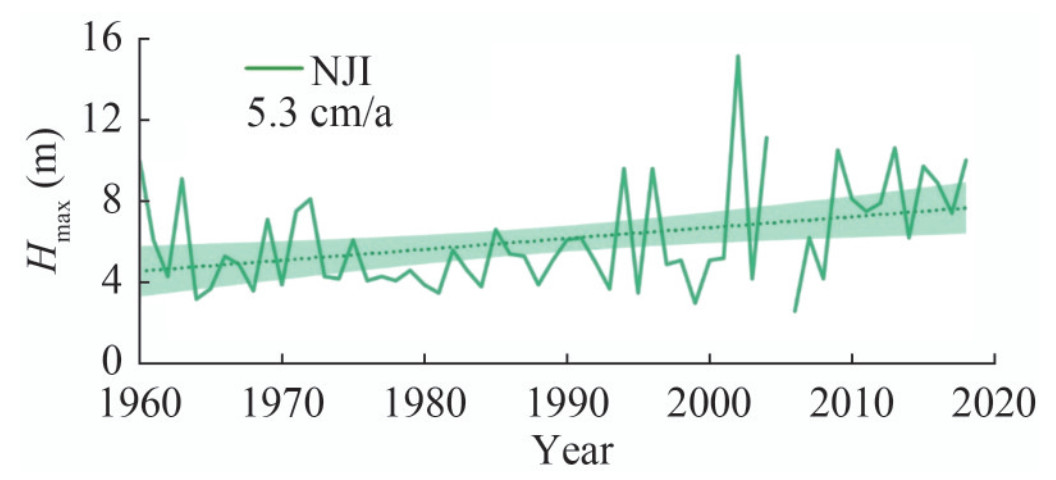 Figure 3 Time series of annual maximum Hmax from NJI observation stations. Trends (dashed colored lines) represent linear regressions of annual Hmax. Shaded areas are 95% confidence intervals
3.2 Seasonal trends in wave parameters
Zheng et al. (2017) discovered that seasonal variations in the long-term tendencies of waves in the China Sea were substantial. The tendencies of wave elements at the five stations were analyzed according to the effects of tropical cyclones and monsoons. The data were divided into winter (DJF) and summer (JJA). Summer ranges from June to August, and winter ranges from December to February. The results are shown in Figure 4.
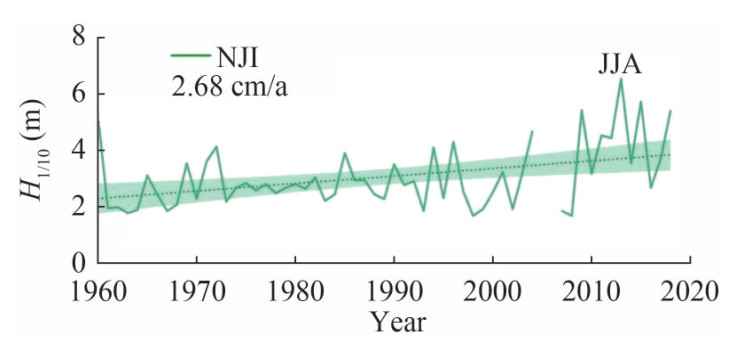 Figure 4 Maximum values of H1/10 for NJI station in summer. Shaded areas are 95% confidence intervals
LHT, CST, and RZH are located in the Yellow and Bohai Seas. The Bohai Sea experiences waves that are predominantly northwesterly during winter months and predominantly southeasterly during summer months (Shi et al., 2019; Timmermans et al., 2020; Young et al., 2011). The long-term linear trends in wave height at the five stations demonstrate evident seasonal characteristics. At the LHT station in the Bohai Sea, the maximum and mean values of H1/10 readings exhibit a decreasing trend in winter and summer. The negative trend of the H1/10 maximum is more significant in summer (− 0.78 cm/a). The maximum values of H1/10 at CST station in the northern Yellow Sea have notable seasonal differences, showing a significant decreasing trend in summer (–1.44 cm/a) and leveling off in winter. A decreasing trend in the mean H1/10 is observed in both seasons. The maximum and mean values of H1/10 at RZH station in the Yellow Sea show an increasing trend in winter and summer (1.29 and 1.06 cm/a, respectively), and the mean values show a slightly increasing trend in winter and summer.
The East China Sea, one of the largest marginal seas, is home to the NJI observation station. It is located on the eastern border of the Eurasian continental shelf and has water depths of under 200 meters. It borders the Taiwan Strait to the south and the Yellow Sea to the north. The Asian monsoon system had a considerable impact on the region. In winter, the predominant winds came from the north or northeast, whereas in summer, southerly or southeasterly winds prevailed. Variations in wind direction were observed during the transitional season. The local wind system had a significant impact on the waves in the area and swells propagated into the area through the gaps in the Ryukyu Islands (Wu et al., 2014).
The maximum and mean values of H1/10 at the NJI station increased in winter and summer. The trend of the maximum value of H1/10 was significantly greater in summer than in winter (2.68 and 0.67 cm/a, respectively), and the trend of the mean value of H1/10 was marginally greater in summer than in winter (0.83 and 0.63 cm/a, respectively).
The WZU observation station is located in the Beibu Gulf, and the South China Sea is located in the tropical and subtropical zone and has a tropical maritime climate. Typhoons in summer and frigid southerly air in winter have an impact on the South China Sea. Winters in the South China Sea are dominated by northeastern winds, whereas summers are dominated by southwesterly monsoons (Wang et al., 2021). The maximum and mean values of H1/10 at the WZU station exhibit a declining tendency in summer and a slightly increasing trend in winter. The maximum and mean values of H1/10 decrease by −1.10 and −0.31 cm/a, respectively, in summer. The reason for the negative trend in wave height at the station may be that most typhoon cyclones were partially blocked on their route by Hainan Island. Young and Ribal (2019) observed a decreasing trend in annual mean Hs in the Beibu Gulf (1985 – 2018), whereas Zheng et al. (2015) observed a trend of 2.5 – 3.0 and 1.5 – 2.5 cm/a in winter and summer, respectively (1988–2011).
LHT, CST, and RZH have average values of 6.18, 7.53, and 6.42 s, respectively, for the summer wave period, whereas NJI has average values of 5.34, 6.02, and 6.08 s for the winter wave period. The mean wave periods throughout summer and winter at the WZU station are 5.96 and 4.68 s, respectively.
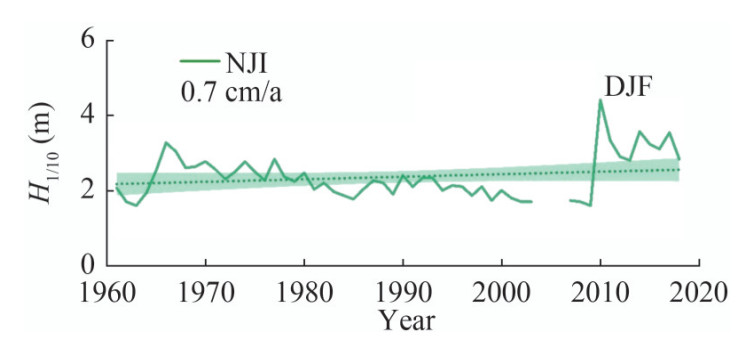 Figure 5 Maximum values of H1/10 for NJI station in winter. Shaded areas are 95% confidence intervals
4 Discussion of were characteristics
4.1 Analysis of long-term trend factors
According to the aforementioned investigations, variation in wave height is correlated with change in wind over a region and is closely related to large-scale circulation.
4.1.1 Correlation analysis of wind and waves
The primary agitator and wave-producing factor is wind. Variations in wind frequently cause changes in waves. The impact of wind must be considered in the evaluation of dynamics-caused long-term changes in waves. The degree to which wind affects waves can be determined using a correlation analysis method. The Pearson correlation coefficient was selected as a statistical indicator. The correlation between the wind and the wave fields is demonstrated by computing the correlation coefficient R between the wave height and the wind speed. All the above data passed the t-test.
The H1/10 and wind speed U for the observation period at each station were selected, and the temporal overlap between the pair was filtered for the calculation of the correlation coefficient R. The wind and wave correlation coefficients for each month at each station are presented in Figure 6. The results indicated that R is positive for all stations, showing a positive correlation between wave height and wind speed. In general, the findings showed that the wave height increased with wind speed.
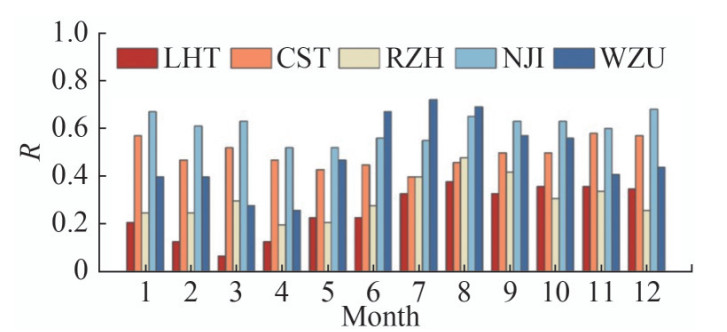 Figure 6 Monthly correlation coefficients for wind and waves at the 5 stations (all results calculated with a 95% confidence level significance test)
Within a year, the R values for the five stations are 0.23 (LHT), 0.48 (CST), 0.31 (RZH), 0.61 (NJI), and 0.50 (WZU). The R values for LHT and RZH are less than 0.35, indicating a weak relationship between wave height and weak consistency. As the waves move closer to the shore, the water becomes shallower, and topographic factors, such as wave refraction and shallow water deformation, start to have an equal impact on wave patterns and wind forcing. As a result, the correlation between wave and wind speed is likely weaker than that at a high water depth.
Given that the NJI station is the furthest from the beach among the five stations and the deep sea features of waves are relevant, the station has the highest total wind among the stations, and the wave correlation is 0.61. The correlations are higher in autumn (SON) and winter (DJF) than in the other seasons and low from April to July.
With a correlation of approximately 0.7 in summer, the WZU station shows evident seasonal variations in wind and wave correlation. The station is frequently impacted by typhoons during summer (JJA), and strong winds are one of the primary drivers of waves in this region during summer (JJA). Given that the composition of waves can be separated into wind waves produced by local winds and swells transmitted from distant locations, the correlation is likely smaller in other seasons. The correlation between wind and wave at the CST station fluctuates by approximately 0.5 from month to month and is less affected by seasonal changes than the other stations. The station is located in shallow bathymetry, and the waves are greatly influenced by topographical factors. Additionally, freezing spells occur in the area, which has a large impact on wave morphology and propagation. This impact may be the explanation for the low correlation at LHT and RZH stations in spring and winter.
4.1.2 Effects of monsoons and circulation systems
Fluctuations in large-scale atmospheric circulation were the crucial dynamic factors influencing long-term variability in wave height (Dan et al., 2009; Ruggiero et al., 2010; Young et al., 2011). The westerly-positioned East Asian monsoon, which interacted with sea and land temperature variations and formed an atmospheric circulation in East Asia, was one of the large-scale circulation systems that regulated the China Sea. The winter monsoon formed a strong northerly wind under the influence of a land-based high-pressure system that can reach the South China Sea region, whereas the summer wind was produced by the warm and humid air currents from the tropical oceans that moved northward with the planetary-scale circulation system and reached the Sino-Mongolian border (40° N) (Chen et al., 2005; Huang et al., 2003). The other was the southeastern subtropical high pressure in the Western Pacific Ocean. This system interacted with the summer monsoon and influenced the East Asian summer wind system because of variations in strength and position.
Wave height is generally growing at the RZH station while falling overall at the LHT and CST stations. Variation in waves is largely influenced by the wind field overhead. Only the wind speed trends from 1960 to 1990 were examined (Table 7) because of the lack of wind data from mid-1990s to 2010. The maximum and mean values of the wind speeds in summer and winter at the three stations exhibit a negative trend over the past three decades. Over the past 60 years, a considerable inter-decadal scale weakening of the large-scale wind field has occurred over the Bohai Sea region, particularly the monsoon (summer wind), and this weakening of the monsoon has shaped the wind field in the Bohai Sea region.
Table 7 Wind speed trends at 5 stations (1960–1990; units: cm/(s⋅a)Variables LHT CST RZH NJI WZU Maximum wind speed (JJA) −4.1 −10.1 −1.4 −1.5 2.6 Maximum wind speed (DJF) −13.5 −14.2 −7.2 −3.0 −15.5 Mean wind speed (JJA) −1.2 −3.1 −3.1 −0.2 2.1 Mean wind speed (DJF) −5.1 −5.7 −3.5 −1.0 −2.2 Waves in the Bohai Sea area were dominated by wind waves, and changes in wind speed had a significant influence on the wave field in this area. Therefore, variations in overhead wind speed had an impact on the long-term trends in wave height at the LHT and CST stations, which exhibit comparable long-term patterns. However, a downward trend in wind speed and a slightly upward trend in wave height appear at the RZH station in summer. These trends may be due to the high proportion of distantly propagated swells in the region that are not largely influenced by local winds. Owing to the weakening of local wind waves and the strengthening of distant swells relative to the summer season, the RZH station shows a significant negative trend in wind speed during winter. However, it shows a positive trend in wave height.
During summer, the maximum and mean wind speeds at the NJI show significant oscillations around 17 and 6 m/s, respectively, without discernible trends. In winter, the maximum and mean wind speeds at the station show a decreasing trend, whereas the wave height shows a large increasing trend. The reason may be that the wave energy at this station is dominated by a swell component that is barely influenced by local winds. The maximum wind speed at the WZU station during summer is increasing, and the intensities of tropical cyclones in the region surrounding the WZU station are anticipated to increase.
Furthermore, Wen et al. (2000) demonstrated that EI Niño diminishes the East Asian monsoon, and La Nia strengthens it, using the NCEP/NCAR reanalysis data. When the monsoon weakens in EI Niño years, the wind speed along the Chinese coast decreases, and the wave height declines, but the opposite occurs in La Nia years. Therefore, the wind speed and wave height in the offshore areas of China during winter have a negative relationship with the Niño 3.4 index. Chien et al. (2014) and Wu et al. (2014) obtained similar results.
4.2 Wave characteristics
Considering that the observed wave heights at nearshore ocean stations are generally smaller than those in the open sea, this paper calculates the monthly and interannual distribution characteristics of H1/10 ≥ 3 m at five observation stations.
4.2.1 Characteristic inter-monthly distribution for H1/10 ≥ 3 m
Monthly distribution for H1/10 ≥ 3 m events at 5 stations over a cumulative period of 55 years are shown in Figure 8. The results demonstrate that there are considerable differences between the stations in the inter-month distribution for H1/10 ≥ 3 m.
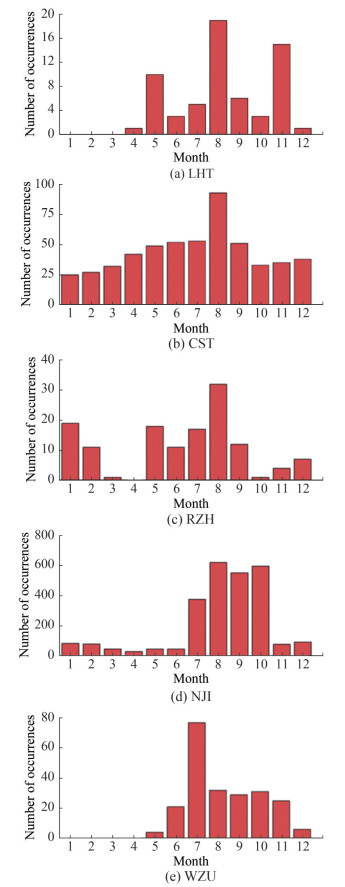 Figure 7 Monthly occurrence of disastrous waves at 5 stations over a 55-year cumulative period (stations LHT, CST, RZH, NJI, and WZU in order)
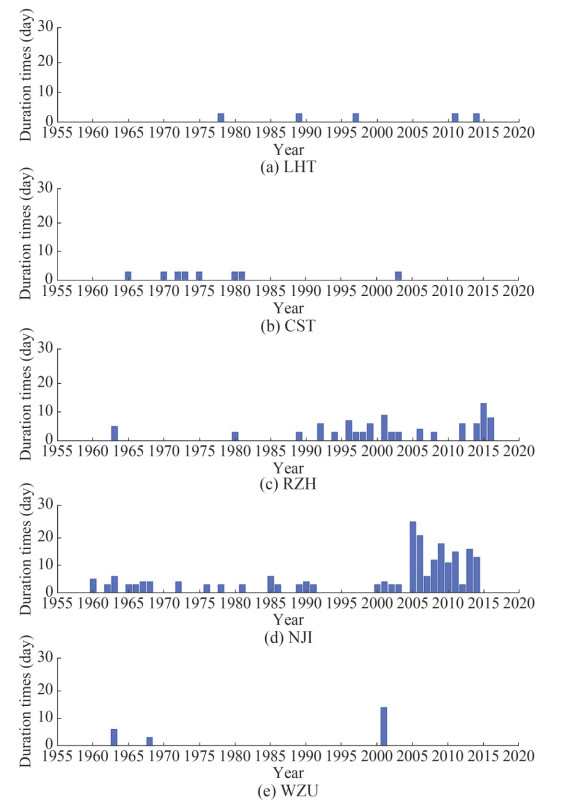 Figure 8 Inter-annual distribution of the cumulative duration of disastrous waves at the 5 stations (only considered here for durations greater than or equal to 3 days)
NJI has the highest cumulative number of H1/10 ≥ 3 m events of the five stations. The majority of events at this station occurred between July and October, with August having the highest number of occurrences at 622 over the 55-year period. At LHT, H1/10 ≥ 3 m most frequently occur in November, August, and May, but there is a maximum of 19 events over a period of more than 55 years, and there are no event of H1/10 ≥ 3 m from January to March. With a cumulative total of over 90, August is the month with the most events of H1/10 ≥ 3 m at CST, with the remaining months having a more evenly distributed total of roughly 30. There have been at least 15 events at RZH cumulatively, with the largest number in August topping 30. The majority of these waves happen in January, as well as in May and August. The majority of waves in WZU occur in JJA and DJF, with July seeing the highest cumulative total of approximately 70.
4.2.2 Analysis of the inter-annual variability and duration of action of disastrous waves
The number of H1/10 ≥ 3 m wave occurrences is counted from 1960 to 2010 and separated into 10-year intervals (Table 8). With the exception of LHT station, where there is a negative trend, the number of H1/10 ≥ 3 m occurrences increases dramatically at the other four stations between the years 2000 and 2010, with the NJI station having the highest number with 709 incidents.
Table 8 Statistical of disastrous wave eventsYear LHT CST RZH NJI WZU 1960–1969 5 137 2 163 60 1970–1979 14 73 1 81 29 1980–1989 2 18 4 79 25 1990–1999 9 13 22 118 13 2000–2010 6 209 48 709 79 Furthermore, the sustained duration of catastrophic waves may have negative effects on offshore structures, coastal shoreline topography, wave-induced urban flooding, and coastal aquaculture. Only events with a single duration greater than or equal to 3 days were considered in the calculation of the cumulative duration of devastating waves (Figure 9). The results suggested that the stations of LHT, CST, and WZU had fewer events with durations of more than or equal to 3 days in the previous decades, and no major trend appeared over time. The RZH and NJI stations showed dramatic increases in event frequency after 1990, and the NJI station recorded the longest duration of a single event (reaching 7 days) among the stations. Notably, the RZH station had fewer occurrences of disastrous waves than the CST and WZU stations, and its cumulative duration was longer than the cumulative durations of the two aforementioned stations (Figure 8).
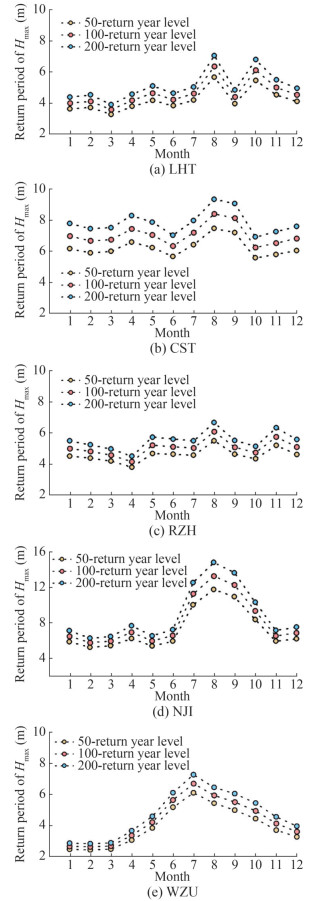 Figure 9 Hmax return period for the five stations (LHT, CST, RZH, NJI, and WZU)
4.3 Time-Dependent generalized extreme value (GEV) distribution
4.3.1 GEV model
The generalized extreme value distribution (hereafter referred to as the GEV model) is the classical model of extreme value theory. The model focuses on the statistical behavior of a sequence of maximum values.
$$ \left\{Z_N=\max \left(H_1, \cdots, H_N\right)\right\} $$ (5) where (H1, …, HN) is the time series of wave elements, and ZN is the extreme value corresponding to the number of observations for N. In general, this time series can represent any stochastic natural process, and GEV models typically use samples from the same number of data N with a maximum value of ZN. All data were spanned over a period of one month for the analysis of seasonal variations. These extreme values are usually regarded as independent random variables with a uniform distribution. However, the wave elements observed each month change depending on the climate. As a result, the examination of inter-monthly variation cannot satisfy the assumption that stochastic processes are isotropic.
Izaguirre et al. (2013) proposed a nonsmooth GEV extreme value distribution model to fulfill the objectives. The cumulative distribution function of type Zt is shown below.
$$ F_t(z)=\left\{\begin{array}{l} \exp \left\{-\left[1+\xi(t)\left(\frac{z-\mu(t)}{\psi(t)}\right)\right]_{+}^{-\eta_{\xi}(t)}\right\}, \xi(t) \neq 0 \\ \exp \left\{-\exp \left[-\left(\frac{z-\mu(t)}{\psi(t)}\right)\right]\right\}, \xi(t)=0 \end{array}\right. $$ (6) where μ(t) is the time-dependent position parameter, ψ(t) is the scale parameter, and ξ(t) is the shape parameter. Depending on the shape parameters, the GEV model is divided into three forms: the Weibull distribution (ξ < 0), Fréchet distribution (ξ > 0), and Gumbel distribution (ξ → 0).
Following a series of tests, the Gumbel distribution was found to be the fittest among the three types of GEV based on root mean square error analysis. For the Gumbel distribution, the location parameter is related to the maximum value of the distribution, and the scale parameter is equal to $ \sqrt{6}$/π times the standard deviation. Hence, these parameters are useful for analyzing the average variation of waves per month (position parameter) or the discrete value of a point (scale parameter).
4.3.2 Analysis of the return period of the maximum wave height monthly extremes
The Gumbel curve method is applied to wave observation data from the five stations, and the 50-, 100-, and 200-year return period values for Hmax for the five stations are calculated. The outcomes for each month are shown in Figure 9. The maximum wave height is relatively large at the five stations during summer and autumn when typhoons and other cyclones are intensified. The peak months for the Hmax return period are July and August. Besides, two peaks in the maximum values of the Hmax appear at the LHT, CST, and RZH stations in summer and autumn, with maximum values of 5.66, 7.47, and 5.48 m (50-year return period), respectively. The three stations are located offshore at middle-to-high latitudes in the Northern Hemisphere, where ice conditions appear in winter and wave propagation is affected by ice drifts, which increase wave energy dissipation and reduce wave height maximums. Compared with the three stations above, the NJI and WZU stations show a single peak pattern. The NJI station is the largest among the five stations, reaching 11.74 m (50-year return period).
The WZU station is located in the northern part of Hainan Island, where tropical cyclones are frequent in summer, but is blocked by Hainan Island, and the wave height is relatively smaller.
4.3.3 Regression analysis of wave parameters
The position and scale parameters are adopted for the assessment of the wave variation characteristics of the stations on a monthly basis. Tropical cyclones to the north and northeast monsoon have an impact on the LHT and RZH stations, which exhibit two peaks in summer and winter. The peak values at the CST, NJI, and WZU stations are 3.6, 5.43, and 3.67 m, respectively. The peak wave values at the NJI station are higher than those at the other four sites because the NJI station is in the open ocean, which is conducive to wave growth (Figure 10).
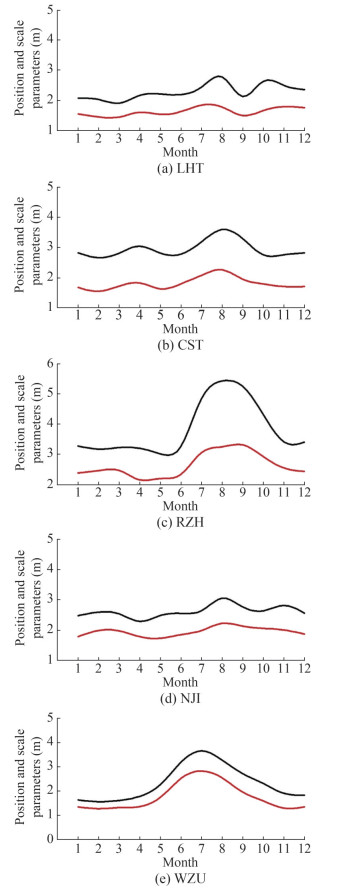 Figure 10 Time-dependent position parameters (red line) and the sum of position and scale parameters (black) for the 5 stations
5 Conclusions
The long-term wave trends over a 55-year time span for China with five in situ stations are investigated. Long-term trends in wave elements varied with region and season. Results showed an overall declining trend in H1/10 at the LHT and CST stations in the middle and high latitudes, reaching − 0.78 and − 1.44 cm/a, respectively, in summer and a decreasing trend in winter because of freezing periods. With a close increasing trend in H1/10 in summer (1.06 cm/a) and winter (1.30 cm/a), the winter monsoon and summer tropical cyclones had an impact on the RZH station, which is located at mid-latitude. Summer tropical cyclones had an impact on the NJI sites in middle-to-low latitudes, and summertime measurements revealed a considerable upward trend (2.68 cm/a). The WZU station located in the northern part of Hainan Island was shaded by Hainan Island, and thus the H1/10 in summer instead tends to decrease (−1.1 cm/a).
The features of the monthly distribution of catastrophic wave episodes were calculated. The NJI station had the most incidents in August, with 622. The inter-annual variability and cumulative duration revealed an increase in NJI and RZH catastrophic wave events since 1990. Notably, the RZH station had fewer instances of a disastrous wave but a longer cumulative duration than the CST and WZU stations, whereas the duration of a single disastrous wave was long. The GEV extreme value model was adopted to evaluate the monthly extreme wave height return periods of the five stations, and it revealed a bimodal distribution for the LHT, CST, and RZH stations. The periods correspond to summer and winter.
The inaccuracy of the numerical simulations of nearshore waves and the inaccuracy of satellite inversions of nearshore waves make in situ observations essential. Future observations can provide a comprehensive understanding of the patterns of climate change impacts on coastal wave climate in China.
Competing interest The authors have no competing interests to declare that are relevant to the content of this article. -
Figure 1 Wave observation stations in China
Figure 2 Time series of annual maximum H1/10 from NJI observation stations. Trends (colored dashed lines) represent linear regressions of annual H1/10. Shaded areas are 95% confidence intervals
Figure 3 Time series of annual maximum Hmax from NJI observation stations. Trends (dashed colored lines) represent linear regressions of annual Hmax. Shaded areas are 95% confidence intervals
Figure 4 Maximum values of H1/10 for NJI station in summer. Shaded areas are 95% confidence intervals
Figure 5 Maximum values of H1/10 for NJI station in winter. Shaded areas are 95% confidence intervals
Figure 6 Monthly correlation coefficients for wind and waves at the 5 stations (all results calculated with a 95% confidence level significance test)
Figure 7 Monthly occurrence of disastrous waves at 5 stations over a 55-year cumulative period (stations LHT, CST, RZH, NJI, and WZU in order)
Figure 8 Inter-annual distribution of the cumulative duration of disastrous waves at the 5 stations (only considered here for durations greater than or equal to 3 days)
Figure 9 Hmax return period for the five stations (LHT, CST, RZH, NJI, and WZU)
Figure 10 Time-dependent position parameters (red line) and the sum of position and scale parameters (black) for the 5 stations
Table 1 Details of the wave observation station. A slash (/) denotes not a number (NaN)
Stations Longitude Latitude Manual observation Buoy observations Data volumes LHT 121.68°E 38.87°N 1963–2011 2011–2018 134 414 CST 122.42°E 37.33°N 1960–2011 2011–2018 158 346 RZH 119.23°E 35.23°N 1960–2012 2012–2018 152 397 NJI 121.05°E 27.27°N 1960–2011 2011–2018 152 707 WZU 109.05°E 21.01°N 1962–2018 / 94 516 Table 2 Coverage ratio for wave data (%)
Variables LHT CST RZH NJI WZU Hmax 78.3 61.4 91.3 98.3 89 Tmax 43.1 53.1 60.7 54.7 26.7 H1/10 78.3 62.4 91.9 98.3 89.1 T1/10 43.1 53.1 60.7 55.2 26.7 Hs 43.1 53.1 60.7 54.7 26.7 Ts 43.1 53.1 60.7 54.7 26.7 Hmean 43.0 53.0 60.5 54.7 26.7 Tmean 78.2 62.3 91.9 98.3 89.1 Wdir 77.9 70.4 72.7 86.4 51.5 Wspd 80.2 71.4 74.4 87.2 53.3 Table 3 Results of the trend analysis (cm/a) for the yearly and seasonal H1/10 (max and mean) values for three different SL: 90% (*), 95% (**), and 99% (***)
Stations H1/10 (max) H1/10 (mean) Annual DJF JJA Annual DJF JJA LHT −1.10*** −0.50*** −0.78*** −0.10*** −0.17*** −0.13*** CST −3.10** 0.08 −1.44 −0.40*** −0.42*** −0.25** RZH 2.50*** 1.30*** 1.06*** 0.20*** 0.32*** 0.07 NJI 3.60* 0.70* 2.68** 0.70*** 0.63*** 0.83*** WZU −1.10*** 0.02 −1.10*** ‒ 0.14 −0.31*** Table 4 Results of the trend analysis (s/a) for the yearly and seasonal Tmean (max and mean) values for three different SLs: 90% (*), 95% (**), and 99% (***)
Stations Tmean (max) Tmean (mean) Annual DJF JJA Annual DJF JJA LHT 0.044* 0.002 7* 0.008 8** 0.003** 0.001 5*** 0.000 7** CST 0.004 −0.022 3** 0.000 5 −0.004** −0.004 8 −0.003* RZH 0.015 −0.005 3 0.004 4 −0.002 −0.003 −0.001 9 NJI 0.004 −0.010 5*** 0.003 5 ‒ −0.000 1 −0.004** WZU −0.01*** −0.000 1 −0.02*** 0.001 0.01*** −0.01*** Table 5 Linear trend of wave parameters at 5 observation stations. A dash (‒) denotes no significant trends
Wave parameters LHT CST RZH NJI WZU H1/10 (max) (cm/a) −1.1 −3.1 2.5 3.6 −1.1 H1/10 (mean) (cm/a) −0.1 −0.4 0.2 0.7 ‒ Hmax (max) (cm/a) 0.1 −1.5 4.5 5.3 −0.5 Hmax (mean) (cm/a) −0.1 −0.3 0.4 1.2 0.1 Tmean (max) (s/a) 0.044 0.004 0.015 0.004 −0.006 Tmean (mean) (s/a) 0.003 −0.004 −0.002 ‒ 0.001 Table 6 Statistics of the long-term trend in global wave height
Region Period (a) Wave height Trend (cm/a) Reference North atlantic 1962–1985 Hs 3.4 Carter and Draper (1988) North atlantic 1950–1990 Hs 2.2 Bacon and Carter (1993) Northwest atlantic and Northeast atlantic 1961–1987 Hs 2.3, 2.7 Bouws et al. (1996) U.S. Pacific northwest 1992–2012 Hs 4.2 (46 059) Sasaki (2014) Gulf of mexico 1985–2008 99th Hs 2.41 (42 001), 1.46 (42 002) Young et al. (2011) North atlantic 2.74 (44 004), 5.2 (44 011), 2.82 (41 002) North pacific 3.03 (46 001), 2.59 (46 002), 4.5 (46 005), 2.64 (46 006), 2.59 (46 035) Hawaii −0.06 (51 001), 0.66 (51 002) East china sea 1979–2014 90th Hs 0.5–1 Wang et al. (2016) 1997–2016 Hs 5 (maximum) Feng et al. (2018) Central arabian sea 1996–2012 Hs 0.63 (mean), −2.66 (maximum) Hithin et al. (2015) Chinese coast 1979–2017 99th Hs 3 (maximum) Shi et al. (2019) 1985–2008 Hs 2.64–4.5 Young et al. (2011) 1988–2011 Hs Tsushima Strait (> 3.0), waters near the Ryukyu Islands (2.5–3.5), the Taiwan Strait (> 2.5), large areas to the north of 15°N in the SCS (> 3.0), and southwest of the Taiwan Strait (> 4.0). Zheng et al. (2017) 1957–2002 Hs 0.5–1.5 Semedo et al. (2011) Shandong (China) 1988–2011 Hs 4.5 Zheng et al. (2015) Table 7 Wind speed trends at 5 stations (1960–1990; units: cm/(s⋅a)
Variables LHT CST RZH NJI WZU Maximum wind speed (JJA) −4.1 −10.1 −1.4 −1.5 2.6 Maximum wind speed (DJF) −13.5 −14.2 −7.2 −3.0 −15.5 Mean wind speed (JJA) −1.2 −3.1 −3.1 −0.2 2.1 Mean wind speed (DJF) −5.1 −5.7 −3.5 −1.0 −2.2 Table 8 Statistical of disastrous wave events
Year LHT CST RZH NJI WZU 1960–1969 5 137 2 163 60 1970–1979 14 73 1 81 29 1980–1989 2 18 4 79 25 1990–1999 9 13 22 118 13 2000–2010 6 209 48 709 79 -
Aarnes OJ, Abdalla S, Bidlot JR, Breivik Ø (2015) Marine wind and wave height trends at different ERA-Interim forecast ranges. Journal of Climate 28: 819-837. https://doi.org/10.1175/JCLI-D-14-00470.1 Bacon S, Carter DJT (1993) A connection between mean wave height and atmospheric pressure gradient in the North Atlantic. Int. J. Climatol 13: 423-436. https://doi.org/10.1002/joc.3370130406 Bouws E, Jannink D, Komen GJ (1996) The increasing wave height in the North Atlantic Ocean. Bull. Amer. Meteor. Soc. 77: 2275-2277. https://doi.org/10.1175/1520-0477(1996)077<2275:TIWHIT>2.0.CO;2 https://doi.org/10.1175/1520-0477(1996)077<2275:TIWHIT>2.0.CO;2 Caires S, Sterl A (2005) 100-year return value estimates for ocean wind speed and significant wave height from the ERA-40 data. Journal of Climate 18: 1032-1048. https://doi.org/10.1175/JCLI-3312.1 Carter DJT, Draper L (1988) Has the north-east Atlantic become rougher? Nature 332: 494-494. https://doi.org/10.1038/332494a0 Chen W, Yang S, Huang RH (2005) Relationship between stationary planetary wave activity and the East Asian winter monsoon. J. Geophys. Res. 110: 1-20. https://doi.org/10.1029/2004JD005669 Chien H, Cheng HY, Chiou MD (2014) Wave climate variability of Taiwan waters. J Oceanogr 70: 133-152. https://doi.org/10.1007/s10872-014-0218-8 Dan S, Stive MJF, Walstra DJR, Panin N (2009) Wave climate, coastal sediment budget and shoreline changes for the Danube Delta. Marine Geology 262: 39-49. https://doi.org/10.1016/j.margeo.2009.03.003 Defne Z, Haas KA, Fritz HM (2009) Wave power potential along the Atlantic coast of the southeastern USA. Renewable Energy 34: 2197-2205. https://doi.org/10.1016/j.renene.2009.02.019 Feng X, Yang D, Yin B, Li M (2018) The change and trend of the typhoon waves in Zhejaing and Fujian coastal areas of China. Oceanologia et Limnologia Sinica 49: 233-241 Forthofer RN, Lehnen RG (1981) Rank correlation methods, in: Public Program Analysis. Springer, Boston, 146-163. https://doi.org/10.1007/978-1-4684-6683-6_9 Guillou N (2020) Estimating wave energy flux from significant wave height and peak period. Renewable Energy 155: 1383-1393. https://doi.org/10.1016/j.renene.2020.03.124 He H, Song J, Bai Y, Xu Y, Wang J, Bi F (2018) Climate and extrema of ocean waves in the East China Sea. Sci. China Earth Sci. 61: 980-994. https://doi.org/10.1007/s11430-017-9156-7 He H, Xu Y (2016) Wind-wave hindcast in the Yellow Sea and the Bohai Sea from the year 1988 to 2002. Acta Oceanol. Sin. 35: 46-53. https://doi.org/10.1007/s13131-015-0786-5 Hithin NK, Kumar VS, Shanas PR (2015) Trends of wave height and period in the Central Arabian Sea from 1996 to 2012: A study based on satellite altimeter data. Ocean Engineering 108: 416-425. https://doi.org/10.1016/j.oceaneng.2015.08.024 Huang R, Zhou L, Chen W (2003) The progresses of recent studies on the variabilities of the East Asian monsoon and their causes. Adv. Atmos. Sci. 20: 55-69. https://doi.org/10.1007/BF03342050 Izaguirre C, Mendez FJ, Espejo A, Losada IJ, Reguero BG (2013) Extreme wave climate changes in Central-South America. Climatic Change 119: 277-290. https://doi.org/10.1007/s10584-013-0712-9 Jiang H, Yang Z (2022) A revisit of global wind-sea and swell climate and variability using multiplatform altimeters. Remote Sensing of Environment 271: 112922. https://doi.org/10.1016/j.rse.2022.112922 Kumar VS, Joseph J, Amrutha MM, Jena BK, Sivakholundu KM, Dubhashi KK (2018) Seasonal and interannual changes of significant wave height in shelf seas around India during 1998–2012 based on wave hindcast. Ocean Engineering 151: 127-140. https://doi.org/10.1016/j.oceaneng.2018.01.022 Li J, Pan S, Chen Y, Fan YM, Pan Y (2018) Numerical estimation of extreme waves and surges over the northwest Pacific Ocean. Ocean Engineering 153: 225-241. https://doi.org/10.1016/j.oceaneng.2018.01.076 Liang B, Fan F, Liu F, Gao S, Zuo H (2014) 22-year wave energy hindcast for the China East adjacent seas. Renewable Energy 71: 200-207. https://doi.org/10.1016/j.renene.2014.05.027 Liu S, Fan W, Wang H, Liu K, Yue X (2017) Analysis of observational wave characteristics of automatic wave measuring instruments at China coastal stations. Haiyang Tongbao 36: 618-630 Mann HB (1945) Nonparametric tests against trend. Econometrica 13: 245. https://doi.org/10.2307/1907187 Pomaro A, Cavaleri L, Lionello P (2017) Climatology and trends of the Adriatic Sea wind waves: analysis of a 37-year long instrumental data set. Int. J. Climatol 37: 4237-4250. https://doi.org/10.1002/joc.5066 Ruggiero P, Buijsman M, Kaminsky GM, Gelfenbaum G (2010) Modeling the effects of wave climate and sediment supply variability on large-scale shoreline change. Marine Geology 273: 127-140. https://doi.org/10.1016/j.margeo.2010.02.008 Sasaki W (2012) Changes in wave energy resources around Japan: Changes in wave energy around Japan. Geophys. Res. Lett. 39: L23702. https://doi.org/10.1029/2012GL053845 Sasaki W (2014) Changes in the North Pacific wave climate since the mid-1990s: Recent North Pacific wave climate. Geophys. Res. Lett. 41: 7854-7860. https://doi.org/10.1002/2014GL061590 Saulnier JB, Maisondieu C, Ashton I, Smith GH (2012) Refined sea state analysis from an array of four identical directional buoys deployed off the Northern Cornish coast (UK). Applied Ocean Research 37: 1-21. https://doi.org/10.1016/j.apor.2012.02.001 Semedo A, Sušelj K, Rutgersson A, Sterl A (2011) A global view on the wind sea and swell climate and variability from ERA-40. Journal of Climate 24: 1461-1479. https://doi.org/10.1175/2010JCLI3718.1 Shi J, Zheng J, Zhang C, Joly A, Zhang W, Xu P, Sui T, Chen T (2019) A 39-year high resolution wave hindcast for the Chinese coast: Model validation and wave climate analysis. Ocean Engineering 183: 224-235. https://doi.org/10.1016/j.oceaneng.2019.04.084 Timmermans BW, Gommenginger CP, Dodet G, Bidlot JR (2020) Global wave height trends and variability from new multimission satellite altimeter products, reanalyses, and wave buoys. Geophys. Res. Lett. 47: 20-40. https://doi.org/10.1029/2019GL086880 Wang H, Fu D, Liu D, Xiao X, He X, Liu B (2021) Analysis and prediction of significant wave height in the Beibu Gulf, South China Sea. J. Geophys. Res. Oceans 126. https://doi.org/10.1029/2020JC017144 Wang JJ, Li B, Gao Z, Wang JK (2019) Comparison of ECMWF significant wave height forecasts in the China Sea with buoy data. Weather and Forecasting 34: 1693-1704. https://doi.org/10.1175/WAF-D-19-0043.1 Wang P, Yang Y, Xue D, Qu Y, Tang J, Leung LR, Liao H (2023) Increasing compound hazards of tropical cyclones and heatwaves over Southeastern coast of China under climate warming. Journal of Climate 36: 2243-2257. https://doi.org/10.1175/JCLI-D-22-0279.1 Wen C, Graf HF, Ronghui H (2000) The interannual variability of East Asian Winter Monsoon and its relation to the summer monsoon. Adv. Atmos. Sci. 17: 48-60. https://doi.org/10.1007/s00376-000-0042-5 Wu L, Wang XL, Feng Y (2014) Historical wave height trends in the South and East China Seas, 1911–2010. J. Geophys. Res. Oceans 119: 4399-4409. https://doi.org/10.1002/2014JC010087 Wu S, Liu C, Chen X (2015) Offshore wave energy resource assessment in the East China Sea. Renewable Energy 76: 628-636. https://doi.org/10.1016/j.renene.2014.11.054 Yaakob O, Hashim FE, Mohd Omar K, Md Din AH, Koh KK (2016) Satellite-based wave data and wave energy resource assessment for South China Sea. Renewable Energy 88: 359-371. https://doi.org/10.1016/j.renene.2015.11.039 Young IR (1999) Seasonal variability of the global ocean wind and wave climate. International Journal of Climatology 19: 931-950. https://doi.org/10.1002/(SICI)1097-0088(199907)19:9<931::AIDJOC412>3.0.CO;2-O https://doi.org/10.1002/(SICI)1097-0088(199907)19:9<931::AIDJOC412>3.0.CO;2-O Young IR, Ribal A (2019) Multiplatform evaluation of global trends in wind speed and wave height. Science 364: 548-552. https://doi.org/10.1126/science.aav9527 Young IR, Zieger S, Babanin AV (2011) Global trends in wind speed and wave height. Science 332: 451-455. https://doi.org/10.1126/science.1197219 Zhai F, Li P, Song D (2019) Interannual wave height variability in the Yellow Sea. J Oceanogr 75: 235-256. https://doi.org/10.1007/s10872-018-0496-7 Zheng C, Pan J, Tan Y, Gao Z, Rui Z, Chen C (2015) The seasonal variations in the significant wave height and sea surface wind speed of the China's seas. Acta Oceanol. Sin. 34: 58-64. https://doi.org/10.1007/s13131-015-0738-0 Zheng C, Zhang R, Shi W, Li X, Chen X (2017) Trends in significant wave height and surface wind speed in the China Seas between 1988 and 2011. J. Ocean Univ. China 16: 717-726. https://doi.org/10.1007/s11802-017-3213-z
