
Multivariate Risk Assessment for Offshore Jacket Platforms by Gaidai Reliability Method
https://doi.org/10.1007/s11804-024-00542-y
-
Abstract
The novel structural reliability methodology presented in this study is especially well suited for multidimensional structural dynamics that are physically measured or numerically simulated over a representative timelapse. The Gaidai multivariate reliability method is applied to an operational offshore Jacket platform that operates in Bohai Bay. This study demonstrates the feasibility of this method to accurately estimate collapse risks in dynamic systems under in situ environmental stressors. Modern reliability approaches do not cope easily with the high dimensionality of real engineering dynamic systems, as well as nonlinear intercorrelations between various structural components. The Jacket offshore platform is chosen as the case study for this reliability analysis because of the presence of various hotspot stresses that synchronously arise in its structural parts. The authors provide a straightforward, precise method for estimating overall risks of operational failure, damage, or hazard for nonlinear multidimensional dynamic systems. The latter tool is important for offshore engineers during the design stage.-
Keywords:
- Monte carlo simulation ·
- System reliability ·
- Jacket offshore structure ·
- Bohai bay ·
- Energy
Article Highlights● The state-of-the-art multivariate Gaidai reliability methodology is applied to a 4D dynamic system with Jacket hotspot stresses.● The reliability of the structural system is assessed, and confidence bands are given.● The generic nature of the advocated methodology is discussed. -
1 Introduction
This work examines the responses of an offshore Jacket platform to drag-dominated hydrodynamic forces that act on its support structure. Operating Well Head Platform B Jacket platform, which is located 50 km offshore in the Bohai Bay BZ25-1 oilfield, is chosen for this study. Bohai Bay is the only inner sea in China. In recent years, it has attracted considerable industrial and research interest due to increased scientific and economic activities, particularly within ocean renewable energy, marine engineering, and the offshore oil and gas industry. In situ environmental parameters at the Bohai Sea are the primary input for offshore structural and reliability studies (Lv et al., 2014; Wang et al., 2012). These parameters for Bohai Bay operational venues are usually processed according to Det Norske Veritas offshore engineering standards (DNV-RPH103, 2017; DNV-RP-C205, 2021). Using traditional engineering reliability methodologies to predict the reliability and risks of multidimensional structural systems is often challenging (Zhao and Ono, 1999; Thoft-Christensen and Murotsu, 1986; Tian et al., 2019). Challenges arise not only from the high number of system degrees of freedom (DOFs) but also from the nonlinear cross-correlations between critical/key components of the system. Direct numerical Monte Carlo (MC) simulations or adequate mea‐ surements can be used to determine reliability-based design parameters for complex nonlinear structural systems (Gaidai et al., 2022a; Balakrishna et al., 2022), but the required datasets are often quite limited. Other contemporary approaches for system reliability studies can be found in (Feng et al., 2022; Zhu et al., 2023). Thus, for many nonlinear, highly dimensional engineering dynamic systems, experimental and computational methods may not always provide an affordable way to assess structural risks, especially for long return periods as required by contemporary design. The novel Gaidai reliability methodology advocated here is especially suitable for complex nonlinear structural systems. It utilizes available datasets in a quite efficient way, which reduces efforts associated with either measurements or numerical calculations. This study explores the stresses in the support structure of an offshore Jacket. These stresses are monitored simultaneously in various critical/hotspot locations under realistic in situ environmental loads. Notably, no model simplifications or linearization of nonlinear effects is required for the analysis.
Figure 1 presents the location of the Jacket platform in the Bohai Sea area, as well as the environmental wave height/period contour lines.
 Figure 1 Geographical contours of wave height and wave period in Bohai Bay obtained on an annual basis (Lv et al., 2014); the star marks the location of the Jacket platform
Figure 2 illustrates a Jacket platform that is comparable to the Jacket studied here. Figure 3 shows the flowchart for long-term MC statistical/reliability analysis.
 Figure 2 Example of an offshore Jacket platform
 Figure 3 Flowchart for long-term environmental statistical/reliability analysis
In contrast to univariate/bivariate statistical approaches, the multivariate strategy accounts for stresses at several crucial Jacket support locations and considers intrinsic stress dependence/coupling. The latter is an obviously important feature for offshore engineers, particularly during the design phase. The key contributions of this study are summarized as follows:
• Realistic offshore engineering installation has been studied using a novel system reliability methodology;
• Structural damage risks have been assessed using a multi-state spatiotemporal assessment model;
• Confidence intervals (CIs) for estimated return periods of interest have been provided.
To provide a historical perspective for the current study, the following chronology can be referred to:
1987: System Reliability of Offshore Jacket Structures by Ideal Plastic Analysis
1990: Wave Loading Effect in Offshore Structural Reliability
1998: Reliability-based Design Format for Jacket Platforms Under Wave Loads
2003: System Reliability of Jack-up Structures Based on Fatigue Degradation
2009: Reliability-based Earthquake Design of Jackettype Offshore Platforms Considering Pile – Soil – Structure Interaction
2011: System Failure Probability of Offshore Jack-Up Platforms in the Combination of Fatigue and Fracture
2012: Structural Reliability of Offshore Platforms Considering Fatigue Damage and Different Failure Scenarios
2014: Seismic Reliability of a Fixed Offshore Platform Against Collapse
2018: Probabilistic Seismic Collapse Analysis of Jacket Offshore Platforms (Ali et al., 2016;Raheem et al., 2022a).
Alternative probabilistic design approaches for offshore platforms, as well as their structural elements, can be found in (Raheem et al., 2022b; Raheem et al., 2020a; Raheem et al., 2020b; Nassiraei and Rezadoost, 2022; Ahmadi, 2016; Nassiraei Rezadoost, 2020; Zavvar et al., 2023). However, estimating the design failure, damage probability, and risks of multivariate systems is often challenging in complex engineering contexts (Smith et al., 1990; Coles and Tawn, 1994).
2 Gaidai reliability method
We consider a piecewise jointly stationary dynamic system with multiple DOFs (MDOFs) and key/critical components X (t), Y (t), Z (t), …, These components are part of the system's dynamic MDOF time records (X (t), Y (t), Z (t), …), which are observed, recorded, or measured over a sufficient (representative) timelapse (0, T). The global maximum of the key/critical component in the 1D system is denoted here as $X_T^{\max }=\max _{0 \leqslant t \leqslant T} X(t), Y_T^{\max }=\max _{0 \leqslant t \leqslant T} Y(t)$, $Z_T^{\max }=\max _{0 \leqslant t \leqslant T} Z(t)$, … for the entire timelapse (0, T). By "suitably long" (representative) timelapse T, we essentially refer to a sufficiently large value of T with respect to the auto-correlation and relaxation times of the dynamic sys tem. Let X1, …, XNX be the local maxima for the key process component X (t) in the dynamic system at discrete time instants, which temporally increase $t_1^X<\cdots<t_{N_x}^X$ within (0, T). Definitions for the remaining key components of the MDOF dynamic system, Y (t), Z (t), … with Y1, …, YNY; Z1, …, ZNZ, are quite similar. For ease of use, we assume that all local maxima of the key components in the dynamic system are non-negative. The goal is to accurately determine the hazard/failure risk of the dynamic Jacket system. We target the hazard/failure risk/probability of the dynamic system:
$$ P_F=\operatorname{Prob}\left(X_T^{\max }>\eta_X \cup Y_T^{\max }>\eta_Y \cup Z_T^{\max }>\eta_Z \cup \cdots\right) $$ (1) The risk is related to the survival probability of the target system, which is denoted as P and expressed as
$$ P \equiv 1-P_F=\iiint_{(0, 0, 0, \cdots)}^{\left(\eta_x, \eta_y, \eta_2 \cdots\right)} p X_T^{\max }, Y_T^{\max }, Z_T^{\max }, \cdots\left(x_T^{\max }, y_T^{\max }, z_T^{\max }, \cdots\right) \mathrm{d} x_T^{\max } \mathrm{d} y_T^{\max } \mathrm{d} z_T^{\max } \ldots $$ (2) It represents the probability that the critical/key compo‐ nents (e.g., ηX, ηY, ηZ, …) of the target dynamic system do not exceed their respective values. ∪ denotes the logical unity operation, and $p_{X_T^{\max }, Y_T^{\max }, Z_T^{\max }, \ldots}$ corresponds to the joint probability density function (PDF) of the global maxima of these components over the observational timelapse (0, T). Next, the vector of the MDOF dynamic system (X (t), Y (t), Z (t), …) is scaled to its nondimensional ver‐ sion: ($\tilde{X}, \tilde{Y}, \tilde{Z}, \ldots$), where $\tilde{X}=\frac{X}{\eta_X}, \tilde{Y}=\frac{Y}{\eta_Y}, \tilde{Z}=\frac{Z}{\eta_Z}$. The joint PDF of the latter dynamic Jacket system cannot be directly assessed due to the high dimensionality of the system and the limitations of the underlying raw dataset. More specifically, the dynamic system is considered to have failed/ damaged or entered a state of hazard when any of the following conditions occur: the key component X (t) exceeds ηX, or Y (t) exceeds ηY, or Z (t) exceeds ηZ; equivalently, when $\tilde{X}, \tilde{Y}, \tilde{Z}, \ldots$ exceed 1. We arrange the local maxima time instants of the key components in the system as [$t_1^X<\cdots<t_{N_X}^X ; t_1^Y<\cdots<t_{N_Y}^Y ; t_1^Z<\cdots<t_{N_z}^Z$]. We merge them into a single temporal vector, t1 ≤ … ≤ tN, in a monotonously nondecreasing temporal order, with $t_N=\max \left\{t_{N_x}^X, t_{N_z}^Y, t_{N_z}^Z, \cdots\right\}$, N ≤ NX + NY + NZ + … Local maxima of each load/response of key components in the MDOF dynamic system, namely, X (t), or Y (t), or Z (t), are represented with their occurrence times tj. The local maxima of the 1D key components ($) in the system are combined/coalesced and coherent with the merged/coalesced temporal vector t1 ≤ … ≤ tN. These local maxima form a temporally increasing vector of the synthetic nondimensional system R(t) ≡ $\vec{R}$ = (R1, R2, …, RN), with $R_j=\max \left\{\left(\tilde{X}_j \mid \exists j_X, t_{j_x}^X=t_j\right), \left(\tilde{Y}_j \mid \exists j_Y, t_{j_Y}^Y=t_j\right)\right.$, $\left.\left(\tilde{Z}_j \mid \exists j_Z, t_{j_z}^Z=t_j\right), \cdots\right\} \text { for } j=1, \cdots, N \text {. }$
A "scaling" parameter 0 < λ ≤ 1 is introduced to artifi cially reduce hazard, limit, or risk values for all nondimensional key components of the system. The survival probability of the system P(λ) is defined as a smooth function of the scaling parameter λ, with P ≡ P(1) according to Eq. (1). To account for the dependency between neighboring Rj, the following memory approximation (conditioning level k) is implemented:
$$ \begin{aligned} & \operatorname{Prob}\left\{R_j \leqslant \lambda \mid R_{j-1} \leqslant \lambda, \cdots, R_1 \leqslant \lambda\right\} \\ & \quad \approx \operatorname{Prob}\left\{R_j \leqslant \lambda \mid R_{j-1} \leqslant \lambda, \cdots, R_{j-k} \leqslant \lambda\right\}, j>k \end{aligned} $$ (3) By tracking each individual hazard, failure, or risk event that occurs locally prior to time, the intention is now to prevent cascading or clustering of intercorrelated exceedances in the FPSO system. Given that the MDOF dynamic process R(t) has been considered to be piecewise ergodic and quasi-stationary, the probability/risk is pk(λ) $\text { := }$ Prob {Rj > λ | Rj − 1 ≤ λ, …, Rj − k ≤ λ} for j > k. This probability/ risk becomes independent of j and solely dependent on the conditioning level k. As a result, the non-exceedance (survival) probability can be approximately calculated using the Poisson assumption.
$$ P_k(\lambda) \approx \exp \left(-N \cdot p_k(\lambda)\right), k \geqslant 1 $$ (4) Notably, Eq. (3) follows from Eq. (2) if we neglect Prob $\left(R_1 \leqslant \eta_1^\lambda\right) \approx 1$, given that the design failure/damage probability is of a small order of magnitude, with $N \gg k$. Eq. (4) is comparable to a popular mean up-crossing rate (MUR) equation for the hazard/failure probability/risk (probability of exceedance). As for the conditioning parameter k, convergence is present.
$$ P=\lim _{k \rightarrow \infty} P_k(1) ; p(\lambda)=\lim _{k \rightarrow \infty} p_k(\lambda) $$ (5) A popular non-exceedance (survival) probability rela‐ tionship with a matching MUR rate function results from Eq. (4) for k = 1, which can be expressed as
$$ P(\lambda) \approx \exp \left(-v^{+}(\lambda) T\right) ; v^{+}(\lambda)=\int_0^{\infty} \zeta p_{R R}(\lambda, \zeta) \mathrm{d} \zeta $$ (6) where ν+ (λ) denotes the MUR of the risk level λ. The nondimensional vector R(t) is assembled from the critical/key components of the scaled FOWT system with MDOF $\left(\frac{X}{\eta_X}, \frac{Y}{\eta_Y}, \frac{Z}{\eta_Z}, \cdots\right)$. Eq. (4) transforms into a popular nonexceedance probability relationship with the correspond‐ ing MUR function:
$$ P(\lambda) \approx \exp \left(-v^{+}(\lambda) T\right) ; v^{+}(\lambda)=\int_0^{\infty} \zeta p_{R \dot{R}}(\lambda, \zeta) \mathrm{d} \zeta $$ (7) where ν+ (λ) is the MUR of the dynamic response level λ for the vector of the nondimensional dynamic Jacket system R(t) introduced above. The Rice's formula, which is given by Eq. (7), yields the MUR, with pRṘ being the joint PDF for (R, Ṙ) and Ṙ being the time derivative R' (t) (Madsen et al., 1986).
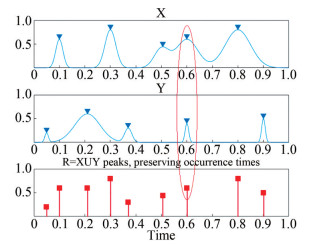 Figure 4 Illustration of the process of combining two exemplary processes, namely, X and Y, into a new synthetic vector R(t)Note: The red ellipse highlights the ease of simultancous maxima for two different components of the Jacket system
In the abovementioned cases, the stationarity assumption is used (Gaidai et al., 2023a; Liu et al., 2023). The proposed methodology can also treat various nonstationary cases. The following is an example of the possible application of the suggested technique to nonstationary circumstances. Given an in-situ scatter diagram consisting of m = 1, …, M environmental sea states, each short-term environmental state has individual occurrence probabilities qm, such that $\sum_{m=1}^M q_m=1$. The corresponding long-term equation is
$$ p_k(\lambda) \equiv \sum\limits_{m=1}^M p_k(\lambda, m) q_m $$ (8) where pk (λ, m) is the same function as in Eq. (6). However, it corresponds to a specific short-term environmental state, which is indexed with a number m. The abovementioned presented pk (λ) functions are often regular in their distri‐ bution tail, particularly for extreme values of λ approaching 1. For λ ≥ λcut − on, the PDF tail behaves similar to exp{ −(aλ + b) c + d} with a, b, c, d as four fitted constants. It matches the appropriate PDF tail cut-on λcut − on value. The optimal values of the four parameters a, b, c, d may be determined using the sequential quadratic programming technique implemented in the Numerical Algorithm Group library (Numerical Algorithms Group, 2010). Compared with traditional MC-based methods for MDOF offshore systems, the Gaidai reliability methodology suggested in this study can conduct reliability assessment on MDOF systems with no practically limited number of DOFs (NDOFs), as shown in the integral in Eq. (2). Thus, this approach cannot be straightforwardly compared with classic reliability methods, which typically cover only dynamic systems with NDOF ≤ 2.
Figure 5 schematically illustrates the suggested structural reliability approach for MDOF Jacket systems. This method consists of three distinct steps: in-situ environmental input, structural dynamic analysis (including key hotspot stress locations), and application of the Gaidai multidimensional structural reliability method.
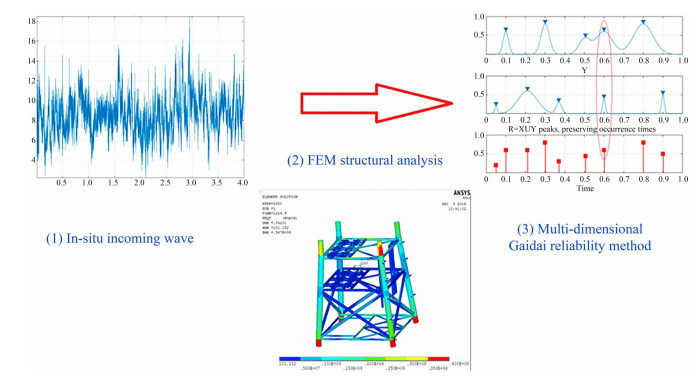 Figure 5 Structural reliability approach for MDOF Jacket systems
3 Environmental, structural, and material models
Using ANSYS Finite Element Method (FEM) software version 2022 R2 (22.2), the offshore Jacket platform is modeled as an MDOF 4D structure (Gaidai and Xing, 2022). To create an accurate wave scatter map for the Bohai Bay region, satellite-based worldwide wave statistics is employed. The Global Wave Statistics Online (Stansberg et al., 2013) dataset is utilized. With the use of an in-place star, Figure 1 illustrates the geographical PDF of wave heights and wave periods for the Bohai Bay Jacket in situ zone.
Table 1 presents the presumed in situ directional proba bilities of wind waves in Bohai Bay, which are averaged over 1 year. For each ambient sea condition, 3-h stationary storm MC simulations are performed. The sea/ocean state scatter diagram for the Bohai Bay area is taken from (Stansberg et al., 2013), which is averaged for the whole year and per all directions. For each sea/ocean state (Hs, Tz), zero crossing period Tz is assumed to be approximately linearly related with the spectral peak wave period Tp, which follows the rule in DNV (DNV-RP-H103, 2017). One-sided wave elevation power spectral density, which is provided by the Joint North Sea Wave Project wave spectrum, is used to specify stationary sea/ocean conditions η (t), with the PSD denoted here by Sη+ (ω), ω > 0
$$ S_\eta^{+}(\omega)=\frac{\alpha g^2}{\omega^5} \exp \left\{-\frac{5}{4}\left(\frac{\omega_p}{\omega}\right)^4+\ln \gamma \exp \left[-\frac{1}{2 \sigma^2}\left(\frac{\omega}{\omega_p}-1\right)^2\right]\right\} $$ (9) Table 1 In situ directional probabilities of wind waves in Bohai Bay (Stansberg et al., 2013)Direction Annual (%) Nortdeast 14.9 East 11.1 Soutdeast 10.0 Soutd 13.2 Soutdwest 7.7 West 8.2 Nortdwest 14.2 Nortd 20.8 where g = 9.81 m/s2; ωp is the peak frequency in rad/s; α, γ, and σ are parameters related to the spectral shape; σ = 0.07 when ω ≤ ω p; and σ = 0.09 when ω > ωp. For Bohai Bay, the in situ parameter γ is chosen to be equal (Wang et al., 2012). The parameter α is determined from equation $\alpha=5.06\left(\frac{H_s}{T_p^2}\right)^2(1-0.287 \ln \gamma)$, with Hs being the significant wave height and Tp = 2π/ωp being the spectral peak wave period. The Jacket platform is modeled using ANSYS FEM software and utilized as a nonlinear MDOF structure. Figure 6 depicts the investigated Jacket platform that operates on the Bohai continental shelf. Von Mises (VM) stresses of the Jacket system are utilized in this investigation, and the structural material is steel with stresses below the yield level (i. e., no plastic/irreversible deformations). A convergence check is conducted to determine the proper timestep. Response time histories are simulated using the ANSYS FEM software (ANSYS theory reference, Release 5.6, 1994). The dynamic Jacket model presumes discrete node placement from the Jacket deck MDOF structure down to the seafloor, which distributes lumped hydrodynamic forces that act on the Jacket platform. The lumped parameter model can be expressed in the following dynamic vector form:
$$ \boldsymbol{M} \ddot{\boldsymbol{X}}+\boldsymbol{C} \dot{\boldsymbol{X}}+\boldsymbol{K} \boldsymbol{X}=\boldsymbol{F}_{\mathrm{in}}+\boldsymbol{F}_d $$ (10) 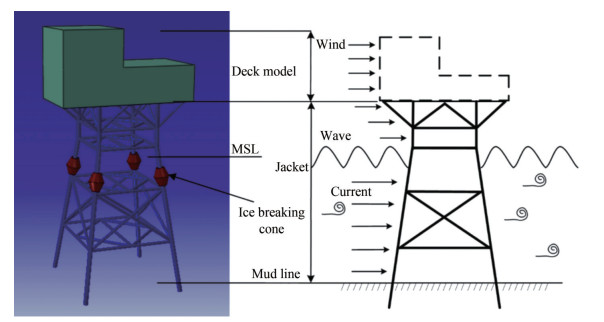 Figure 6 Jacket structural loadings (Tian X et al., 2019)
where M, C, and K are constant matrices (geometric nonlin‐ earity is not modeled). The response vector X = (X1, …, XN)T consists of components Xk = Xk(t), k = 1, …, N, with each component being the k-th DOF and N being the number DOFs in the FEM model. Fin and Fd are the inertia and drag force components, respectively. The dynamic equation is solved through the full integral method, which accounts for geometrical nonlinearities. The structural MDOF model of the Jacket platform focuses on accurately describing the deformation characteristics of the Jacket legs, especially critical tubular support elements. These elements are modeled by equivalent beam, tubular, or shell structural elements.
For the entire Jacket MDOF structure (Figure 6), especially its area above the sea floor mudline, proper FEM models are utilized. Jacket legs extend 90 m below the seabed mudline, and the average depth of the water is 17 m. The airgap between the lowest deck and the mean water level is about 12 m.
Common T, Y, and K-joints of Jacket offshore platforms are shown in Figure 7.
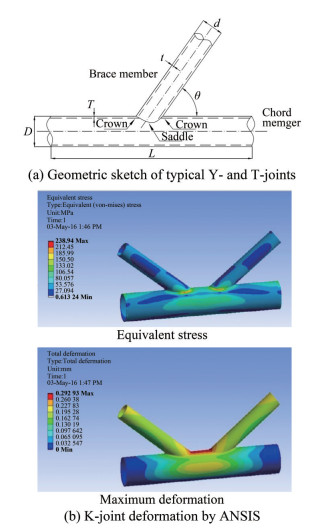 Figure 7 Examples of welded tubular joints.
The soil is modeled following the p − y curve method (API Recommended Practice for Planning, 2002). For sand, the equation is
$$ P=A P_U \tanh \left(\frac{K H}{A P_U} Y\right) $$ (11) where A = 0.9 represents the cyclic loading, PU is the soil resistance level limit of the pile side for the unit area, K is the initial modulus of the subgrade reaction, H refers to the depth below the surface of the Jacket pile in the mud, and Y denotes the lateral deformation of the pile. In the ANSYS FEM analysis, the tubes and weld joints of the Jacket leg are made of steel. The properties of these mate‐ rials are presented in Table 2.
Table 2 Material characteristics of carbon steelYoung's modulus, E (GPa) 200 Poisson's ratio, μ 0.3 Yield limit, σs (MPa) 205 Density, ρ (kg/m3) 7.8·103 4 Results
Statistical findings for the VM stresses of the selected Jacket tubular support member are presented in this section. Figure 8 illustrates the Jacket with four critical (i.e., hotspot) stress locations being selected.
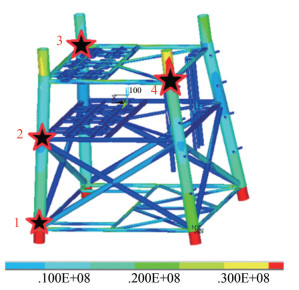 Figure 8 Illustration of the slightly deformed part of the Jacket with four critical VM stress monitoring locations. The stresses (hotspots) are indicated using colors
Figure 8 illustrates the part of the Jacket with four stress monitoring locations. Stresses due to external (wave) loadings are computed using ANSYS FEM software, and VM stresses are highlighted using colors. The failure, hazard, or risk limits are all equal to 1. Four measured or simulated time series with local maxima from the key components in the system are kept in temporally nondecreasing order and combined into a synthetic vector R for the Jacket system (Gaidai et al., 2023b; Gaidai et al., 2023c; Gaidai et al., 2023n;Sun et al., 2023a; Yakimov et al., 2023a;Yakimov et al., 2023b;Yakimov et al., 2023c).
Figure 9(a) presents an example of a nondimensional assembled vector R, which consists of assembled local Jacket stresses at four critical or hotspot locations (Figure 8). λcut − on = 0.6 cut-on limit is selected as an example given that lower values λ < λcut − on are clearly irrelevant for extrapolation of the desired failure or hazard PDF tail. Notably, λ = 1 (Gaidai et al., 2023d; Gaidai et al., 2023e; Gaidai et al., 2023f; Gaidai et al., 2023g; Gaidai et al., 2023h; Gaidai et al., 2023i; Gaidai et al., 2023j; Gaidai et al., 2023k; Gaidai et al., 2023l; Gaidai et al., 2023m; Sun et al., 2023b; Gaidai et al., 2024a). The system vector R does not have physical meaning on its own because it is purely synthetic. Index j represents a running index of local maxima for key components in the system, which are sorted in temporally nondecreasing order (Numerical Algorithms Group, 2010).
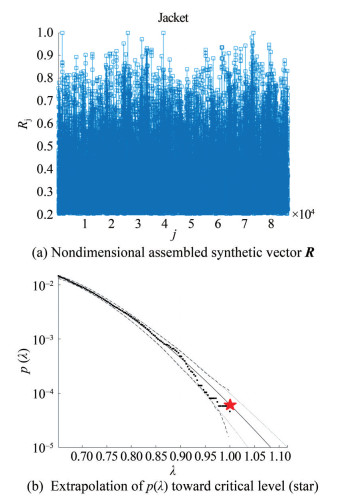 Figure 9 Assembled vector R and corresponding extrapolation.Note: Empirical data (*), extrapolation (solid line), and extrapolated empirical 95% CI (two dotted lines)
Figure 9(b) presents extrapolation following Eq. (9) toward target failure or hazard level λ = 1. Two dotted lines indicate the 95% extrapolated CI. According to Eq. (6), the function p(λ) is directly related to the failure/hazard risk/ probability of the target system 1 − P from Eq. (1). Following Eq. (5), the failure/hazard probability/risk of the dynamic Jacket system 1 − P ≈ 1 − Pk(1) can now be estimated. In Eq. (4), the parameter N corresponds to the total number of local maxima of system components within the synthetic vector R (Gaidai et al., 2024b; Gaidai et al., 2024c; Gaidai et al., 2024d; Gaidai et al., 2024e).
Figure 9(b) exhibits reasonably narrow 95% CIs even when the underlying dataset is limited.
Figure 9(b) shows extrapolation over approximately five decimal orders of magnitude, which corresponds to a 105 efficiency compared with MC simulation. When simulating a complex MDOF system using MC, the number of key dimensions or components of the system can become computationally prohibitive (Gaidai et al., 2024f; Gaidai et al., 2024g).
We deploy an alternative multivariate reliability method to cross-validate the Gaidai multivariate reliability method without performing extensive direct MC simulations. To the best of our knowledge, no reliability method is available at present to treat systems with dimensions NDOF > 2. Notably, the Gaidai multivariate reliability method can handle NDOF = ∞. Thus, cross-validation should be performed for NDOF = 2, which considers only the two most critical hotspot stresses. For cross-validation of the Gaidai multivariate reliability method, we refer to a recent study on a 2D Jacket system (i.e., with only two stresses selected) and the modified four-parameter Weibull bivariate method (Sun et al., 2023a).
The advocated Gaidai reliability methodology offers practical engineering benefits by effectively utilizing raw, unfiltered measured or simulated datasets. Its ability to handle the multidimensionality of dynamic systems, as well as accurate extrapolation tools, allows for analysis even when based on a relatively limited dataset.
Figure 9(b) demonstrates the extrapolation depth, which refers to the number of decimal orders of magnitude covered by extrapolation. In other words, it indicates how much CPU time can be saved.
5 Concluding remarks
Traditional reliability methods are not readily applicable to complex systems with a large number of key crosscorrelated components. The ability of the Gaidai multivariate reliability method to assess the reliability of highdimensional nonlinear dynamic systems is its main practical benefit. This work examines dynamic hotspot stresses at several support structure locations of an offshore Jacket platform. The Jacket support structure is modeled as a multidimensional engineering dynamic system. The theoretical rationale of the Gaidai multivariate reliability method is briefly presented. Although the reliability of Jacket structures can be analyzed through direct measurement or extensive MC simulations, the complexity and high dimensionality of dynamic systems require the development of novel, accurate, yet robust techniques. These approaches should be capable of handling even limited underlying datasets while making optimal use of them. The methodology employed in this study demonstrates efficacy across various intricate nonlinear engineering systems. The main goal of this research is to propose an all-purpose, trustworthy, and user-friendly multidimensional reliability strategy for offshore engineers. The suggested method produces reasonably narrow CIs. As a result, the proposed method can be used at the design stage for a wide range of nonlinear dynamic systems. The Gaidai multivariate reliability method is compared with the well-established bivariate Weibull method for validation. The Gaidai multivariate reliability method can be used not only for offshore Jacket platforms but also for other offshore engineering structures.
Competing interest The authors have no competing interests to declare that are relevant to the content of this article. -
Figure 1 Geographical contours of wave height and wave period in Bohai Bay obtained on an annual basis (Lv et al., 2014); the star marks the location of the Jacket platform
Figure 2 Example of an offshore Jacket platform
Figure 3 Flowchart for long-term environmental statistical/reliability analysis
Figure 4 Illustration of the process of combining two exemplary processes, namely, X and Y, into a new synthetic vector R(t)
Note: The red ellipse highlights the ease of simultancous maxima for two different components of the Jacket system
Figure 5 Structural reliability approach for MDOF Jacket systems
Figure 6 Jacket structural loadings (Tian X et al., 2019)
Figure 7 Examples of welded tubular joints.
Figure 8 Illustration of the slightly deformed part of the Jacket with four critical VM stress monitoring locations. The stresses (hotspots) are indicated using colors
Figure 9 Assembled vector R and corresponding extrapolation.
Note: Empirical data (*), extrapolation (solid line), and extrapolated empirical 95% CI (two dotted lines)
Table 1 In situ directional probabilities of wind waves in Bohai Bay (Stansberg et al., 2013)
Direction Annual (%) Nortdeast 14.9 East 11.1 Soutdeast 10.0 Soutd 13.2 Soutdwest 7.7 West 8.2 Nortdwest 14.2 Nortd 20.8 Table 2 Material characteristics of carbon steel
Young's modulus, E (GPa) 200 Poisson's ratio, μ 0.3 Yield limit, σs (MPa) 205 Density, ρ (kg/m3) 7.8·103 -
Ahmadi H (2016) A probability distribution model for SCFs in internally ring-stiffened tubular KT-joints of offshore structures subjected to out-of-plane bending loads. Ocean Engineering 116: 184–199. https://doi.org/10.1016/j.oceaneng.2016.02.037 Ali S, Ekkirala W, Hieu N, Azimov U (2016) Seismic Sensitivity Studies for Fixed Offshore Platforms. Offshore Technology Conference Asia, Kuala Lumpur, Malaysia. 10.4043/26522-MS American Petroleum Institute (API) (2002) Recommended Practice for Planning, Design, and Construct Fixed Offshore Platform ANSYS Inc. (1994) ANSYS theory reference, Release 5.6 Balakrishna R, Gaidai O, Wang F, Xing Y, Wang S (2022) A novel design approach for estimation of extreme load responses of a 10-MW floating semi-submersible type wind turbine. Ocean Engineering 261. https://doi.org/10.1016/j.oceaneng.2022.112007 Coles S, Tawn J (1994) Statistical Methods for Multivariate Extremes: An Application to Structural Design. Journal of the Royal Statistical Society: Series C (Applied Statistics) 43(1): 1–48. 1348. top/10.2307/2986112 doi: 10.2307/2986112 DNV-RP-C205 (2021) Environmental conditions and environmental loads DNV-RP-H103 (2017) Modelling and analysis of marine operations Feng K, Ji J, Wang K, Wei D, Zhou C, Ni Q (2022) A novel order spectrum-based Vold-Kalman filter bandwidth selection scheme for fault diagnosis of gearbox in offshore wind turbines. Ocean Engineering 266(3). https://doi.org/10.1016/j.oceaneng.2022.112920 Gaidai O, Cao Y, Loginov S (2023) Global cardiovascular diseases death rate prediction. Current Problems in Cardiology 48(5). https://doi.org/10.1016/j.cpcardiol.2023.101622 Gaidai O, Fu S, Xing Y (2022a) Novel reliability method for multidimensional nonlinear dynamic systems. Marine Structures 86. https://doi.org/10.1016/j.marstruc.2022.103278 Gaidai O, Liu Z, Wang K, Bai X (2023g) Current COVID-19 Epidemic Risks in Brazil. Epidemiology International Journal 7(2): 1–10. 10.23880/eij-16000259 Gaidai O, Sheng J, Cao Y, Zhang F, Zhu Y, Loginov S (2024c) Public health system sustainability assessment by Gaidai hypersurface approach. Current Problems in Cardiology 49(3). 10.1016/j.cpcardiol.2024.102391 Gaidai O, Sheng J, Cao Y, Zhu Y, Loginov S (2024f) Generic COVID-19 epidemic forecast for Estonia by Gaidai multivariate reliability method. Franklin Open. 10.1016/j.fraope.2024.100075 Gaidai O, Sheng J, Cao Y, Zhu Y, Wang K, Liu Z (2024g) Limit hypersurface state of art Gaidai risk assessment approach for oil tankers Arctic operational safety. J Ocean Eng Mar Energy 10: 351–364. 10.1007/s40722-024-00316-2 Gaidai O, Sun J, Wang F (2024b) Energy harvester reliability study by Gaidai reliability method. Climate resilience and sustainability 3(1): 64. https://doi.org/10.1002/cli2.64 Gaidai O, Wang F, Cao Y, Liu Z (2024a) 4400 TEU cargo ship dynamic analysis by Gaidai reliability method. J. shipp. trd 9(1). https://doi.org/10.1186/s41072-023-00159-4 Gaidai O, Wang F, Yakimov V, Sun J, Balakrishna R (2023e) Lifetime assessment for riser systems. GRN TECH RES SUSTAIN 3: 4. 10.1007/s44173-023-00013-7 Gaidai O, Xing Y (2022b) Novel reliability method validation for offshore structural dynamic response. Ocean Engineering 266(5). https://doi.org/10.1016/j.oceaneng.2022.113016 Gaidai O, Xing Y, Balakrishna R, Xu J (2023a) Improving extreme offshore wind speed prediction by using deconvolution. Heliyon 9(2). https://doi.org/10.1016/j.heliyon.2023.e13533 Gaidai O, Xing Y, Xu J, Balakrishna R (2023n) Gaidai-Xing reliability method validation for 10-MW floating wind turbines. Scientific Reports 13(1): 8691. 10.1038/s41598-023-33699-7 Gaidai O, Xu J, Yakimov V, Wang F (2023c) Analytical and Computational Modeling for Multi-Degree of Freedom Systems: Estimating the Likelihood of an FOWT Structural Failure. Journal of Marine Science and Engineering 11(6): 1237. 10.3390/jmse11061237 Gaidai O, Yakimov V, Zhang F (2023f) COVID-19 spatio-temporal forecast in England. Biosystems. 10.1016/j.biosystems.2023.105035 Gaidai O, Yakimov V, Wang F, Hu Q, Storhaug G, Wang K (2023d) Lifetime assessment for container vessels. Applied Ocean Research. 10.1016/j.apor.2023.103708 Gaidai O, Yakimov V, Wang F, Sun J, Wang K (2024e) Bivariate reliability analysis for floating wind turbines. International Journal of Low-Carbon Technologies 19: 63–72. 10.1093/ijlct/ctad108 Gaidai O, Yakimov V, Wang F, Zhang F (2023j) Safety design study for energy harvesters. Sustainable Energy res 10(15). 10.1186/s40807-023-00085-w Gaidai O, Yakimov V, Wang F, Zhang F, Balakrishna R (2023i) Floating wind turbines structural details fatigue life assessment. Scientific Reports 13(1). 10.1038/s41598-023-43554-4 Gaidai O, Yan P, Xing Y, Xu J, Zhang F, Wu Y (2023b) Oil tanker under ice loadings. Scientific Reports 13(1): 8670. https://doi.org/10.1038/s41598-023-34606-w Gaidai O, Yakimov V, Balakrishna R (2023h) Dementia death rates prediction. BMC Psychiatry 23(691). 10.1186/s12888-023-05172-2 Gaidai O, Yakimov V, Hu Q, Loginov S (2024d) Multivariate risks assessment for complex bio-systems by Gaidai reliability method. Systems and Soft Computing. 10.1016/j.sasc.2024.200074 Gaidai O, Yakimov V, Niu Y, Liu Z (2023l) Gaidai-Yakimov reliability method for high-dimensional spatio-temporal biosystems. Biosystems. 10.1016/j.biosystems.2023.105073 Gaidai O, Yakimov V, Sun J, van Loon E (2023m) Singapore COVID-19 data cross-validation by the Gaidai reliability method. npj Viruses 1(9). 10.1038/s44298-023-00006-0 Gaidai O, Yakimov V, van Loon E (2023k) Influenza-type epidemic risks by spatio-temporal Gaidai-Yakimov method. Dialogues in Health 3(2). 10.1016/j.dialog.2023.100157 Liu Z, Gaidai O, Sun J, Xing Y (2023) Deconvolution approach for floating wind turbines. Energy Science & Engineering 11(8): 2742–2750. https://doi.org/10.1002/ese3.1485 Lv X, Yuan D, Ma X, Tao J (2014) Wave characteristics analysis in Bohai Sea based on ECMWF wind field. Ocean Engineering 91: 159–171. https://doi.org/10.1016/j.oceaneng.2014.09.010 Madsen HO, Krenk S, Lind NC (1986) Methods of structural safety. Englewood Cliffs, Prentice-Hall Inc Nassiraei H, Rezadoost P (2020) Parametric study and formula for SCFs of FRP-strengthened CHS T/Y-joints under out-of-plane bending load. Ocean Engineering 221. https://doi.org/10.1016/j.oceaneng.2020.108313 Nassiraei H, Rezadoost P (2022) Probabilistic analysis of the SCFs in tubular T/Y-joints reinforced with FRP under axial, in-plane bending, and out-of-plane bending loads. Structures 35: 1078–1097. https://doi.org/10.1016/j.istruc.2021.06.029 Numerical Algorithms Group (2010) NAG Toolbox for Matlab. Oxford, UK: NAG Ltd Raheem S, Aal E, AbdelShafy A, Fahmy M (2022a) Seismic response analysis of fixed jacket-type offshore structures based on power spectrum density Driven input. Ships and Offshore Structures 17(4): 877–888. https://doi.org/10.1080/17445302.2021.1884808 Raheem S, Aal E, AbdelShafy A, Fahmy M, Mansour M (2022b) In-place analysis for pile structural response of fixed jacket offshore platform. Ships and Offshore Structures 17(6): 1224–1237. https://doi.org/10.1080/17445302.2021.1906039 Raheem S, Aal E, AbdelShafy A, Mansour M, Omar M (2020a) Numerical analysis for structure-pile-fluid-soil interaction model of fixed offshore platform. Ocean Systems Engineering 10(3): 243–266. https://doi.org/10.12989/OSE.2020.103.243 Raheem S, Aal E, AbdelShafy A, Fahmy M, Mansour M (2020b) Pile-soil-structure interaction effect on structural response of piled jacket-supported offshore platform through in-place analysis. Earthquakes and Structures 18(4): 407–421. https://doi.org/10.12989/EAS.2020.18.4.407 Smith R L, Tawn J A, Yuen H K (1990) Statistics of Multivariate Extremes. International Statistical Review 58(1): 47–58. https://doi.org/10.2307/1403473 Stansberg CT, Amundsen A, Fouques S, Okland O (2013) Second-order random wave kinematics and resulting loads on a bottom-fixed slender monopile. International Conference on Offshore Mechanics and Arctic Engineering 8. https://doi.org/10.1115/OMAE2013-11405 Sun J, Gaidai O, Wang F, Yakimov V (2023a) Gaidai reliability method for fixed offshore structures. J Braz. Soc. Mech. Sci. Eng 46(27). https://doi.org/10.1007/s40430-023-04607-x Sun J, Gaidai O, Xing Y, Wang F, Liu Z (2023b) On safe offshore energy exploration in the Gulf of Eilat. Quality and Reliability Engineering International 39(7): 2957–2966. https://doi.org/10.1002/qre.3402 Tian X, Wang Q, Liu G, Liu Y, Xie Y, Deng W (2019) Topology optimization design for offshore platform jacket structure. Applied Ocean Research 84: 38–50. https://doi.org/10.1016/j.apor.2019.01.003 Thoft-Christensen P, Murotsu Y (1986) Application of structural systems reliability theory. Berlin: Springer-Verlag Wang Z, Wu K, Zhou L, Wu L (2012) Wave characteristics and extreme parameters in the Bohai sea. China Ocean Engineering 26(2): 341–350. https://doi.org/10.1007/s13344-012-0026-0 Yakimov V, Gaidai O, Wang F, Wang K (2023a) Arctic naval launch and recovery operations, under ice impact interactions. Applications in Engineering Science. 10.1016/j.apples.2023.100146. Yakimov V, Gaidai O, Wang F, Xu X, Niu Y, Wang K (2023b) Fatigue assessment for FPSO hawsers. International Journal of Naval Architecture and Ocean Engineering. 10.1016/j.ijnaoe.2023.100540. Yakimov V, Gaidai O, Xu J, Wang F (2023c) Liquid carbon storage tanker disaster resilience. Environment Systems and Decisions 43: 746–757. 10.1007/s10669-023-09922-1 Zavvar E, Henneberg J, Guedes Soares C (2023) Stress concentration factors in FRP-reinforced tubular DKT joints under axial loads. Marine Structures 90. https://doi.org/10.1016/j.marstruc.2023.103429 Zhao Y G, Ono T (1999) A general procedure for first/second order reliability method (FORM/SORM). Structural Safety 21(2): 95–112. https://doi.org/10.1016/S0167-4730(99)00008-9 Zhu R, Peng W, Wang D, Huang C (2023) Bayesian transfer learning with active querying for intelligent cross-machine fault prognosis under limited data. Mechanical Systems and Signal Processing 183. https://doi.org/10.1016/j.ymssp.2022.109628
