
Impact of Various Coupled Motions on the Aerodynamic Performance of a Floating Offshore Wind Turbine Within the Wind-Rain Field
https://doi.org/10.1007/s11804-024-00465-8
-
Abstract
This study employed a computational fluid dynamics model with an overset mesh technique to investigate the thrust and power of a floating offshore wind turbine (FOWT) under platform floating motion in the wind-rain field. The impact of rainfall on aerodynamic performance was initially examined using a stationary turbine model in both wind and wind-rain conditions. Subsequently, the study compared the FOWT's performance under various single degree-of-freedom (DOF) motions, including surge, pitch, heave, and yaw. Finally, the combined effects of wind-rain fields and platform motions involving two DOFs on the FOWT's aerodynamics were analyzed and compared. The results demonstrate that rain negatively impacts the aerodynamic performance of both the stationary turbines and FOWTs. Pitch-dominated motions, whether involving single or multiple DOFs, caused significant fluctuations in the FOWT aerodynamics. The combination of surge and pitch motions created the most challenging operational environment for the FOWT in all tested scenarios. These findings highlighted the need for stronger construction materials and greater ultimate bearing capacity for FOWTs, as well as the importance of optimizing designs to mitigate excessive pitch and surge.Article Highlights• The influence of various floating motions as well as wind and rain on the FOWT's aerodynamics was investigated numerically.• The rain loads accounted for a small proportion of total loads yet caused aerodynamic performance degradation of the FOWT.• The surge and pitch caused large changes in the relative wind speed and swept area of the rotor, thus dramatically affecting the FOWT's aerodynamics.• The compound motion combined by surge and pitch imposed the harshest operation environment on the FOWT in all cases tested herein. -
1 Introduction
Offshore wind energy is a renewable, abundant resource with a relatively stable supply. Its efficient utilization significantly reduces fossil fuel consumption and mitigates global warming (Tang et al., 2022). Floating offshore wind turbines (FOWTs) offer several advantages over onshore wind turbines, such as conserving land resources, being non-polluting, inexhaustible, and exhibiting high-power generation efficiency owing to the ability to capture higher-quality wind resources with greater speeds and less turbulence in offshore regions (Lei et al., 2019; Jiang et al., 2020). Consequently, FOWTs are increasingly becoming a promising direction for advancements in the wind energy sector. Typically, FOWTs are located in deep-sea areas characterized by high wind speeds and abundant wind energy resources. These regions, affected by the monsoon climates, may experience severe weather conditions during certain months, such as typhoons and rainstorms (Li et al., 2021). However, the FOWT relies on floating foundations rather than fixed constraints to float on the sea surface. This results in complex six-degree-of-freedom (DOF) motions under the influence of wind, waves, and currents: surge, heave, sway, pitch, yaw, and roll (see Figure 1) (Cai et al., 2023). These movements cause aerodynamic fluctuations affecting power out put efficiency (Wang et al., 2023). The challenging weather conditions in deep-sea environments, such as typhoons and rainstorms, demand robust and durable FOWTs (Jiang et al., 2020). Previous research has addressed various aspects of FOWT dynamics, including structural dynamics, hydro dynamics, mooring lines, and aerodynamics (Kang et al., 2021; Putra et al., 2023; Rezaee et al., 2021; Hu et al., 2023).
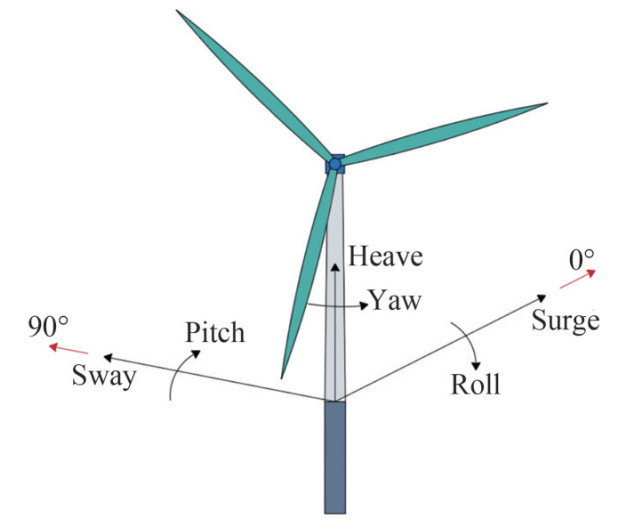 Figure 1 Motion forms of the FOWT
The study of FOWT aerodynamics under the combined impact of floating motions and harsh wind-rain conditions is crucial owing to the complexity of deep-sea work environments and issues related to structural safety and power production efficiency. While there has been some research on the FOWT's aerodynamic performance under floating motions, several studies stand out. Farrugia et al. (2016) studied the impact of wave-induced effects on the aerodynamic performance of FOWT using a free wake vortex (FWV) model, observing complex wake phenomena under extreme wave conditions. Gueydon (2016) examined the impact of drift motions and aerodynamic damping caused by the operating rotor, noting that aerodynamic damping significantly affects the resonance peak of the surge and pitch motions. Sant et al. (2018) presented a simplified numerical model for sizing a spar to cater to specific com pressed air pressure and energy storage capacity needs. Sun et al. (2023) employed computational fluid dynamics (CFD) with the non-compressible Reynolds-averaged Navier-Stokes (RANS) method to assess the effects of tower-shadow effect and surge motion on downwind FOWT aerodynamics, confirming their significant influence. Dong and Viré (2022) used the FWV method to study FOWT aerodynamics in windmill, vortex ring, and propeller working states during surge motion, reporting that the vortex ring state is the most erratic. Xu et al. (2023) also employed the FWV method to assess the rotor uptilt angle's effect on downwind FOWT aerodynamics, concluding that the great est influence occurs at the maximum pitching velocity and angle. Kuang et al. (2022) investigated wake interference between two tandem offshore floating vertical-axis wind turbines under pitch using improved delayed detached-eddy simulations. They found that pitch can reduce the turbine's mean velocity deficit in the core wake region, increasing the other turbine's mean power output. Wang et al. (2021) examined the thrust characteristics of FOWT's under yawed-inflow conditions involving platform yaw motion and yawed incoming wind direction using the blade ele ment momentum method, discovering more violent thrust fluctuations during platform yaw motion. Several studies comparing the effects of different single-DOF motions on the FOWT's aerodynamic responses have also been pub lished. Lee and Lee (2019) applied the nonlinear vortex lattice method and the vortex particle method to simulate unsteady wake characteristics of FOWTs undergoing individual motions of all six DOFs. Fontanella et al. (2022) conducted a series of experiments on a 1∶100 scale model of an FOWT to investigate the aerodynamic variations caused by platform motion, subjecting the model to surge, sway, roll, pitch, and yaw motions. Fontanella et al. (2022) and Lee and Lee (2019) identified pitch and surge as the two most important modes among these motions in terms of their impact on FOWT's aerodynamic performance. Therefore, extensive research is necessary to understand the aerodynamic effects not only of individual surge and pitch motions but also of their combined impact on FOWT's. However, to the best of our knowledge, limited studies have been carried out in this field until now. Guo et al. (2022) explored the combined motion of surge and pitch and its impact on the FOWT's aerodynamic variation, focusing on motion frequencies and the initial phase difference between these motions. They found that coupling pitch and surge coupling in the same phase had adverse effects, while phase differences leading to reverse coupling generated more stable operation conditions for the FOWT. Chen et al. (2021a) also reported similar detrimental effects of coupled surge and pitch motions on aerodynamic performance. Feng et al. (2021) conducted CFD simulations to study power and wake effects under combined surge and pitch motions. They established a power fluctuation table based on real sea states in China. In addition, Chen et al. (2021b) analyzed the aerodynamic and structural responses of FOWTs subjected to coupled pitch and yaw motions, discovering that pitch motion was the main factor influencing aerodynamic oscillation and structural deformation. Regarding more complicated platform motions, Guo et al. (2018) proposed simulation research on the aerodynamic performance of vertical-axis wind turbines under threeDOF motion involving surge, heave, and pitch. Owing to constraints and limitations in simulation techniques, research on platform floating motions involving multiple DOFs remains rare and has not been extensively pursued.
As mentioned before, FOWTs are typically located in deep-sea areas where they encounter harsh environments characterized by strong winds and rainstorms. During rain fall, raindrops driven by wind flow collide with the surface of the FOWT at high speeds and oblique angles, generating significant rain loads. Rainfall plays a nonnegligible negative role in the FOWT's aerodynamics and power out put efficiency (Wu et al., 2022a). Prior research on FOWT's in wind-rain conditions has focused on the distribution and velocity of raindrops (Wu et al., 2022b), rain-induced loads (Hoksbergen et al., 2023), structural responses (Qin et al., 2023), rain erosion, and pertinent protection and optimization measures (Fang et al., 2022; Bera et al., 2023). So far as we know, studies specifically investigating the aerodynamic performance of FOWTs during rainfall or even under the combined influence of floating motion and rain are rare. Arastoopour and Cohan (2017) numerically investigated the effect of rain on the power output of horizontal-axis wind turbines, highlighting the rain-induced degradation of power efficiency. Ke et al. (2019) studied a wind turbine operating under combined blade yaw and wind-rain conditions, examining the distribution of raininduced loads at different yaw angles, the wind turbine's structural responses, and buckling stability. They found that wind-rain loads decreased the overall buckling stability and ultimate bearing capacity of the wind turbine.
For a comprehensive understanding of the FOWT's aero dynamic performance in authentic deep-sea environments, it is essential to investigate the synergistic effects of multipleDOF floating motion and a wind-rain field. Although the aerodynamic performance of FOWTs under single-DOF platform motion has been studied extensively, research on FOWTs subjected to coupled motions involving multiple DOFs, especially when coupled with wind-rain conditions, remains insufficient and urgently needed. The influence of the coupled motions and wind - rain conditions on the FOWT, involving thrust and power, necessitates systematic quantification, analysis, and explanation.
For the purposes outlined above, this study established a numerical model of a full-scale FOWT using the standard k − ε turbulence model and overset mesh technology. To simulate a rainstorm environment, a rainfall intensity of 200 mm/h was applied in the modeling process. Initially, to assess the rain-induced variations in aerodynamics, the aerodynamic responses of the FOWT on a fixed foundation were computed and compared within both wind and wind-rain fields. Sequentially, we modeled the FOWT's operation situation within the wind field under individual floating motions of surge, pitch, heave, and yaw with various amplitudes and periods. This allowed us to identify the most influential factor affecting its aerodynamics. Finally, to evaluate the synergistic effects of multiple-DOF floating motions and the wind-rain environment, five coupled motions, namely surge + pitch, surge + heave, surge + yaw, pitch + heave, and pitch + yaw, were imposed on the FOWT within the wind - rain field. The corresponding thrust and power of the FOWT were compared and analyzed systematically and thoroughly.
2 Numerical model
2.1 Mathematical theory
The unsteady Reynolds-Averaged Navier-Stokes (RANS) equations were employed to solve incompressible turbulent flow (Fang et al., 2021).
Continuity
$$ \frac{\partial u_i}{\partial x_i}=0 $$ (1) Momentum
$$ \frac{\partial u_i}{\partial t}+\frac{\partial\left(u_j u_i\right)}{\partial x_j}=-\frac{1}{\rho} \frac{\partial P}{\partial x_i}+\mu \frac{\partial}{\partial x_j}\left(\frac{\partial u_i}{\partial x_j}\right) $$ (2) where ui is the Cartesian coordinate velocity component, xi is the Cartesian coordinate, respectively, ρ represents the air density, μ denotes the dynamic viscosity coefficient, and P indicates the pressure.
The standard k − ε turbulence model was applied in this study. The turbulent kinetic energy, k, and the dissipation rate, ε, are given by Eq. (3) (Yang, 2019).
$$ \begin{aligned} & \frac{\partial(\rho k)}{\partial t}+\frac{\partial\left(\rho u_i k\right)}{\partial x_i}=\frac{\partial}{\partial x_j}\left(\left(\mu+\frac{\mu_t}{\sigma_k}\right) \frac{\partial k}{\partial x_j}\right)+G_k-\rho \varepsilon \\ & \frac{\partial(\rho \varepsilon)}{\partial t}+\frac{\partial\left(\rho u_i \varepsilon\right)}{\partial x_i}=\frac{\partial}{\partial x_j}\left(\left(\mu+\frac{\mu_t}{\sigma_{\varepsilon}}\right) \frac{\partial \varepsilon}{\partial x_j}\right)+C_1 \frac{\varepsilon}{k} G_k-\rho C_2 \frac{\varepsilon^2}{k} \end{aligned} $$ (3) Turbulent viscosity μt depends on the turbulent kinetic energy k and the dissipation rate ε, as expressed in Eq. (4) (El-Askary et al., 2017).
$$ \mu_t=\rho C_\mu \frac{k^2}{\varepsilon} $$ (4) where Gk denotes the turbulent kinetic energy generated by the velocity gradient, σk and σε represent the turbulence's Prandtl number of equation k, while ε, Cμ, C1, and C2 are constants, Cμ = 0.09, C1 = 1.44, C2 = 1.92, σk = 1.0, σε = 1.3 (Nedjari et al., 2020).
The wind speed contour line can be calculated quantitatively based on the exponential wind speed distribution law, as shown in Eq. (5) (Nybo et al., 2020).
$$ \frac{\bar{v}(z)}{\bar{v}\left(z_r\right)}=\left(\frac{z}{z_r}\right)^\alpha $$ (5) where α denotes the ground roughness coefficient, v(z) refers to the corresponding mean wind speed at the height of z in the structure, and v(zr) is the corresponding mean wind speed at the reference height, zr. v(zr) is taken as the rated wind speed, i.e., 11.4 m/s. α equals 0.12, corresponding to the offshore region (Lei et al., 2019).
For analyzing the aerodynamic performance of the turbine in a heavy rainfall environment, a rain field was established based on the Marshall-Palmer raindrop spectrum, as shown in Eq. (6) (Norouzian et al., 2020).
$$ n(D)=n_0 \mathrm{e}^{-\lambda D} $$ (6) $$ \lambda=4.1 I^{-0.21} $$ (7) where D is the raindrop diameter, n(D) is the raindrop density, n0 is a constant in the rain model taken as 8 000 mm/h, λ denotes the distribution slope parameter [mm−1], and I refers to the rainfall intensity [mm/h]. To capture the extreme aerodynamic characteristics of the turbine in a rainstorm, the rainfall intensity I is set at 200 mm/h.
Raindrop density N (m−3) refers to the number of raindrops with diameters of [d1, d2] in a unit volume of air, as expressed in Eq. (8).
$$ N = \int_{{d_1}}^{{d_2}} n (r){\rm{d}}r $$ (8) Substituting Eq. (6) and Eq. (7) into Eq. (8) yields:
$$ N = \frac{{\left({{{\rm{e}}^{ - 4.1{I^ - }^{0.21}{d_1}}} - {{\rm{e}}^{ - 4.1{I^{ - 0.21}}{d_2}}}} \right){I^{0.21}}{n_0}}}{{4.1}} $$ (9) Table 1 summarizes the calculation results of raindrop density under a rainfall intensity of 200 mm/h.
Table 1 Calculation results of raindrop densityRaindrop diameter (mm) 0-1 1-2 2-3 3-4 4-5 5-6 raindrop density (m-3) 4 406 1 153 302 79 20 7 When falling in the air, raindrops are influenced by gravity and air resistance. The vertical velocity [m/s] of raindrops gradually decreases until it reaches a constant value known as the terminal velocity. This terminal velocity varies depending on their particle size, as shown in Eq. (10) (Serio et al., 2019).
$$ V_v(D)=9.65-10.3 \mathrm{e}^{-0.6 D} $$ (10) where Vv is the terminal vertical velocity of the raindrops. With respect to the terminal horizontal velocity Vh [m/s], it is approximately equal to the horizontal wind speed in the wind field. Assuming that both the horizontal and vertical end velocities of raindrops reach a uniform velocity during their descent, the resultant velocity, Vs [m/s], of the rain drops can be calculated using Eq. (11).
$$ V_s=\sqrt{V_v^2+V_h^2} $$ (11) The interaction between raindrops and the structural surface involves a momentum change without considering splashing and fragmentation, adhering to the law of momentum conservation.
$$ \int_0^\tau f (t){\rm{d}}t + \int_{{V_s}}^0 m {\rm{d}}v = 0 $$ (12) $$ t=\frac{D}{2 V_s} $$ (13) $$ m=\frac{1}{6} \rho_w \pi D^3 $$ (14) where f (t) denotes the individual raindrop impact force, m is the raindrop mass, t is the impact period, and ρw is the water density. Thus, the raindrop impact force F (t) during an impact period t can be expressed as Eq. (15).
$$ F(\tau)=\frac{m V_s}{\tau}=\frac{V_s}{\left(\frac{d}{2 V_s}\right)} \cdot\left(\frac{1}{6} \rho_w \pi d^3\right)=\frac{1}{3} \rho_w \pi d^2 V_s^2 $$ (15) After stabilizing the wind field solution, the discrete phase is introduced for follow-up wind-rain coupling iterations. The number and volume occupancy of raindrops of different diameters were determined using the aforementioned Marshall-Palmer spectrum. Raindrop release was conducted from the "surface" of the computational domain's top surface, with the initial release velocity set to 0. Owing to the collaborative effects of gravity and air resistance, raindrops can reach their final velocity if the falling height is sufficiently large.
2.2 Configuration of a FOWT
A 5-MW floating offshore wind turbine (NREL-5MW), designed by the National Renewable Energy Laboratory, was adopted in the numerical model (see Figure 2). This wind turbine consists of a tower, engine room, and rotor. The total length of the blade is 61.5 m, the rotor diameter is 126 m, and the tower height is 90 m. More detailed basic properties are summarized in Table 2 (Fu et al., 2023).
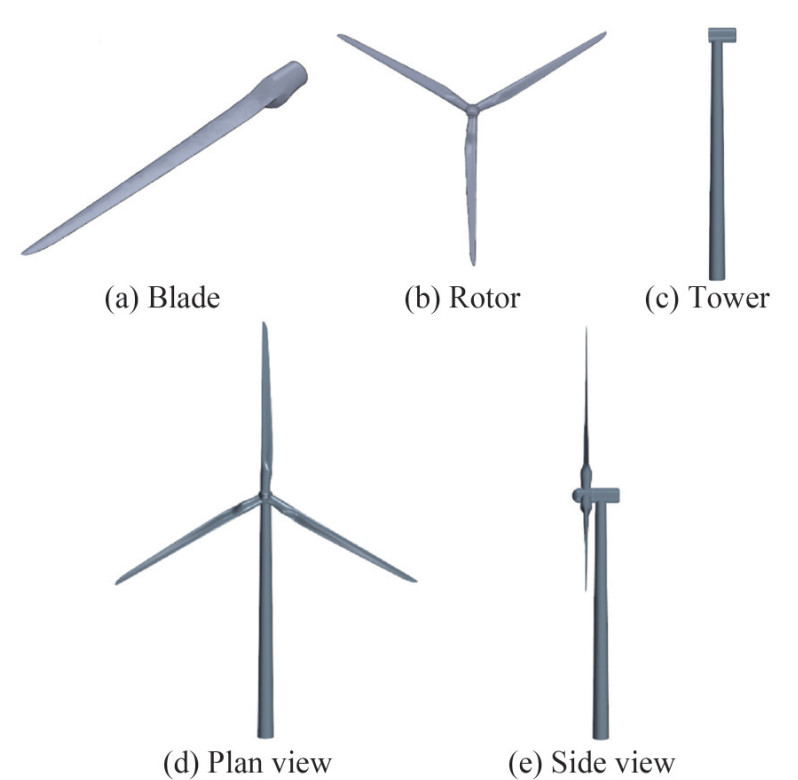 Figure 2 Turbine configurationTable 2 Basic properties of the NREL-5MW wind turbine
Parameter Value Rotor diameter (m) 126 Hub diameter (m) 3 Cut-in wind speed (m/s) 3 Rated wind speed (m/s) 11.4 Cut-out wind speed (m/s) 25 Rated rotor speed (r/min) 12.1 2.3 Computational domain and boundary condition settings
In this study, the hub center was determined to be the origin of the global coordinate system. The rectangular computational domain selected for analysis had dimensions of 850 m in length, 300 m in width, and 350 m in height. The wind turbine rotor was positioned 300 m down stream from the velocity inlet and 550 m upstream from the pressure outlet. Specifically, the center of the rotor's rotational domain was situated 90 m above the bottom surface, which corresponds to the tower height. To simulate real-world conditions, the upper and left boundaries were configured as pressure outlets to simulate an open environment on both sides. Conversely, the bottom boundary was implemented as a non-sliding wall, emulating either ground or sea surface conditions (Li et al., 2022). The schematic representation of the computational flow field domain is visually presented in Figure 3.
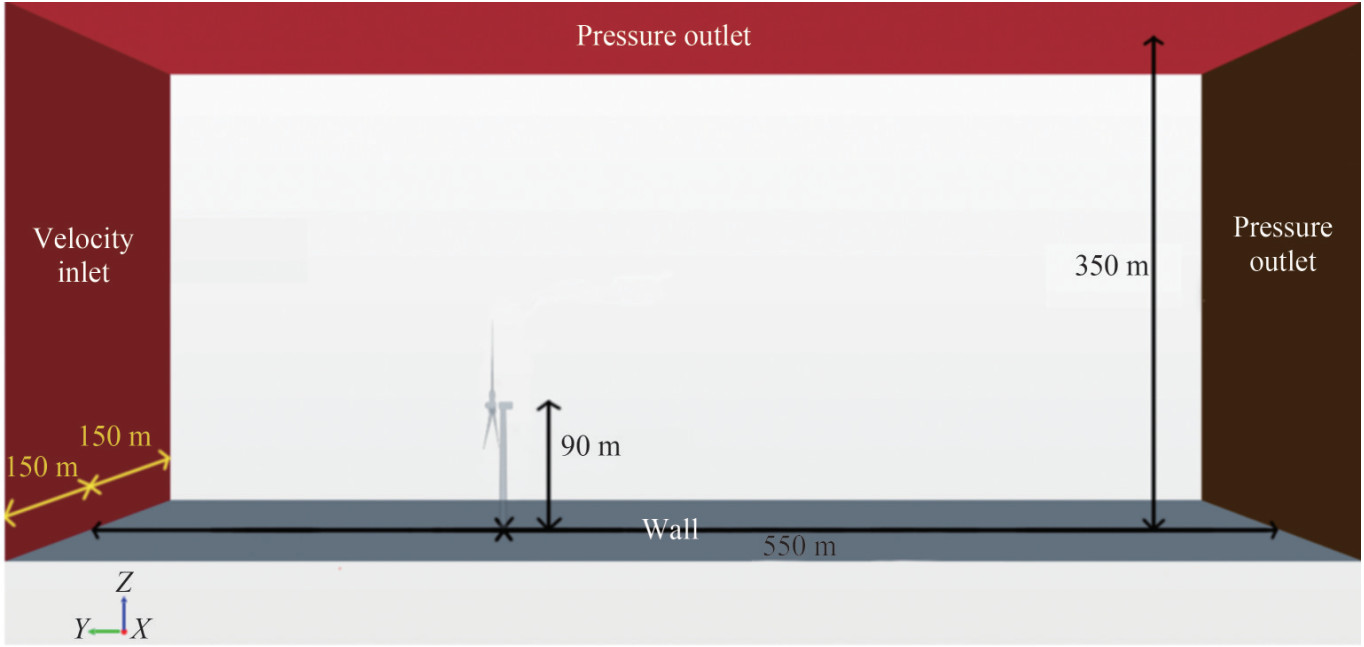 Figure 3 Schematic setup of the computational domain
2.4 Validation of the numerical model
The relative motion issue between rotating blades and the tower was addressed by implementing overset mesh technology. This method allows for unconstrained relative motion among multiple sets of independent grids, rendering it particularly well-suited for solving complex composite motions. In the overset mesh method, each component of the structure is discretized into individual mesh segments that are then integrated into the background meshes. Owing to the intersecting regions between various grids in the mesh system, preprocessing techniques, such as hole cutting, are necessary to eliminate meshes outside the computation domain. Subsequently, grids within the intersecting regions are exchanged among different sets of grids through interpolation methodologies. The system automatically combines the most optimal interpolation and contribution units, ultimately solving the governing equation (Kirby et al., 2019).
Grid validation is necessary for ensuring the accuracy and computational efficiency of the CFD model. A mesh independence test was conducted by comparing the thrust and power of the wind turbine at a wind speed of 11.4 m/s with those reported by the official NREL, as summarized in Table 3. The results indicated that the medium grid achieved the minimum power error and the moderate thrust error, offering better computational efficiency than the fine grid. Therefore, the medium grid was adopted for this study. Similarly, Table 4 presents the different thrust and power values of a wind turbine at a wind speed of 11.4 m/s using different sizes of the computational domain with the medium grid. Considering the balance between errors and computational efficiency, the first computational domain configuration (see Figure 3) is applied to the analysis.
Table 3 Comparison of the calculation results of different grid numbersGrid Mesh number ×106 Thrust (kN)/Error Power (MW)/Error Coarse 1.37 773/3.3% 4.74/5.2% Medium 2.16 785/1.9% 5.03/0.6% Fine 3.27 791/1.1% 5.08/1.6% Table 4 Comparison of the calculation results of different downstream distancesDownstream distance (m) Thrust (kN)/Error Power (MW)/Error 550 785/1.9% 5.03/0.6% 1 100 789/1.4% 5.05/1.0% 1 650 791/1.1% 5.01/0.2% The thrust and power results obtained from the CFD calculations in this study were compared with those obtained by NREL officials and certain scholars (Kirby et al., 2019; Zheng et al., 2022; Yu et al., 2018; Wang et al., 2020), as shown in Figure 4. Upon inspection of Figure 4(a), it was observed that the thrust values captured in this paper were lower than those reported by the official NREL. This dis crepancy can be attributed to the consideration of the gravity component perpendicular to the rotor. At low wind speeds, the difference in thrust between the overset method used in this study and the NREL reports was more noticeable owing to the effect of blade rotation on the wind flow along the blade surface, resulting in stall phenomena and a decrease in thrust. As the wind speed increases, the airflow better aligns with the blade surface, enhancing the absorption of wind energy. This results in increased thrust, which gradually approaches the standard values reported by NREL. The comparison of thrust results calculated in this paper with those of Wang et al. (2020) shows significant consistency. With respect to power, the results obtained in this study were somewhat higher than those in the official NREL report at relatively low wind speeds but were surpassed by the official results as the wind speed increased. Overall, the power results obtained in this paper closely align with other research findings and show the highest correspondence with the results of Wang et al. (2020). In light of the above, the accuracy and validity of the model in this study can be well justified.
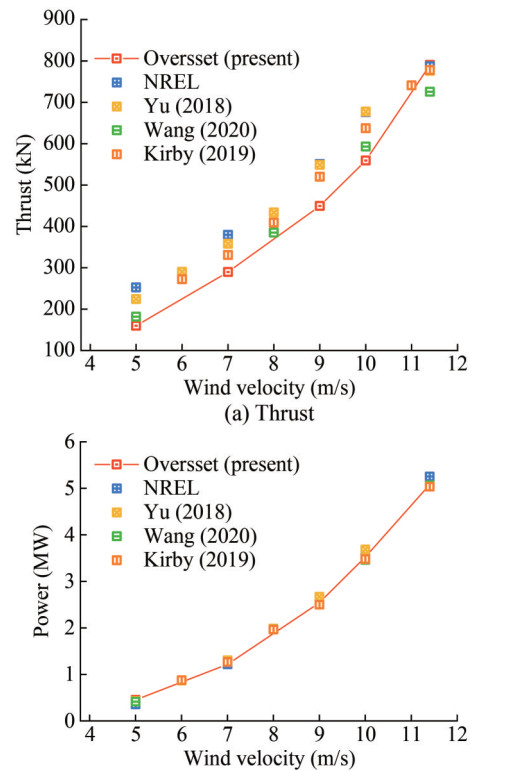 Figure 4 Comparison of thrust and torque at different wind velocities
2.5 Implementation method for floating motion
To simplify the calculation, the surge motion of the floating wind turbine was considered as a periodic motion translated along the wind speed direction, defined by the motion function in Eq. (16).
$$ Y(t)=A_s \sin \left(\frac{2 \pi}{T} t\right) $$ (16) where Y (t) is the surge displacement of floating wind turbines at time t, As is the amplitude of the surge motion, and T is the period.
In terms of the pitch motion of the floating wind turbine, it was treated as a periodic motion that oscillated back and forth around the center of gravity, defined as the motion function in Eq. (17).
$$ \theta_p(t)=A_p \sin \left(\frac{2 \pi}{T} t\right) $$ (17) where θp(t) is the pitch angle of the floating wind turbines at time t, and Ap is the amplitude of the pitch motion.
Similarly, Eq. (18) to characterize the heave motion of the floating wind turbine, which is a periodic motion translated along the vertical direction:
$$ Z(t)=A_h \sin \left(\frac{2 \pi}{T} t\right) $$ (18) where Z (t) is the heave displacement of floating wind turbines at time t, and Ah is the amplitude of the heave motion.
With respect to the yaw motion of the floating wind turbine, it was considered a periodic motion of torsion around the global coordinate axis Z written in Eq. (19).
$$ \theta_y(t)=A_y \sin \left(\frac{2 \pi}{T} t\right) $$ (19) where θy(t) is the yaw angle of the floating wind turbines at time t, and Ay is the amplitude of the yaw motion. Figure 5 depicts the schematic diagram of these motion forms.
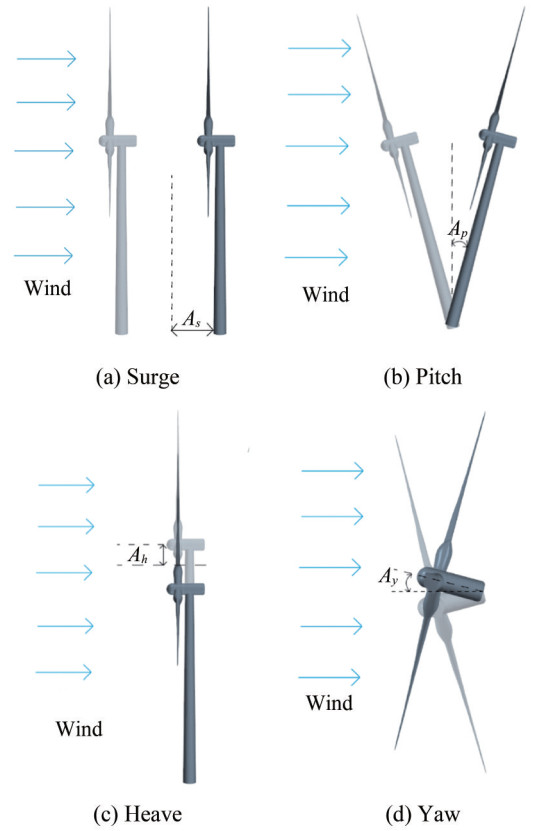 Figure 5 Diagram of motion forms
3 Results and discussion
In simulation calculations, a wind turbine can be mod-eled as a rigid body with no deformation (Zheng et al., 2022). Accordingly, this section primarily focuses on the thrust and power of the NREL-5MW floating wind turbine in a wind-rain field. The aerodynamic performance of the turbine on a permanent foundation is systematically analyzed to investigate the effects of wind and rain fields. Subsequently, to estimate the operational state of a FOWT under the combined effects of wind-rain fields and floating motion, this study examines the thrust and power of the turbine under various motion scenarios. These include calculations for single-DOF motions such as surge, pitch, heave, and yaw, as well as coupled motion involving two DOFs. The results are then compared and explained, respectively.
3.1 Aerodynamic performance on a fixed foundation
3.1.1 Comparison between wind field and wind-rain field
Figure 6 and Figure 7 present the thrust and power time history responses of a stationary wind turbine at various wind velocities within wind fields and wind - rain fields. From inspection of these figures, the aerodynamic performance time history curves show a less explicit distinction between turbines operating within the wind-rain fields and those in the single wind fields. In particular, during the initial start-up of the rotor, both thrust values (see Figure 6(a) and Figure 6(b)) and power values (see Figure 7(a) and Figure 7(b)) fluctuated greatly before gradually converging to a stable range as the flow field stabilized. Moreover, both thrust and power time history curves exhibited periodic fluctuations, which had a period equal to 1/3 of each blade's rotation period: 2.71 s, 1.93 s, and 1.65 s for wind velocities of 5 m/s, 9 m/s, and 11.4 m/s, respectively. The troughs of the thrust and power curves coincided with the moment when a single blade passed through the tower. This is likely attributed to the tower generating a reverse thrust on the rotor caused by a change in the aerodynamic load in the flow field as one of the blades approached the tower. Consequently, the thrust and power diminished, reaching their minimum values as the blade rotated vertically downward and parallel to the tower. Subsequently, the influence of the tower decreased as the blade gradually moved away, causing thrust and power to increase. It is notable that the thrust and power values, as well as the fluctuation amplitudes of their respective curves, increased with wind velocity. Interestingly, the fluctuation amplitudes of thrust and power in the wind-rain field were less than those in the wind field, as shown in Figure 6(a) and Figure 6(b), and Figure 7(a) and Figure 7(b), respectively. The same rule can be observed in Figure 6(c) and Figure 7(c) with respect to the mean values of thrust and power. Arastoopour and Cohan (2017) reported a similar reduction in mean power within the wind-rain field compared to that within the wind field alone.
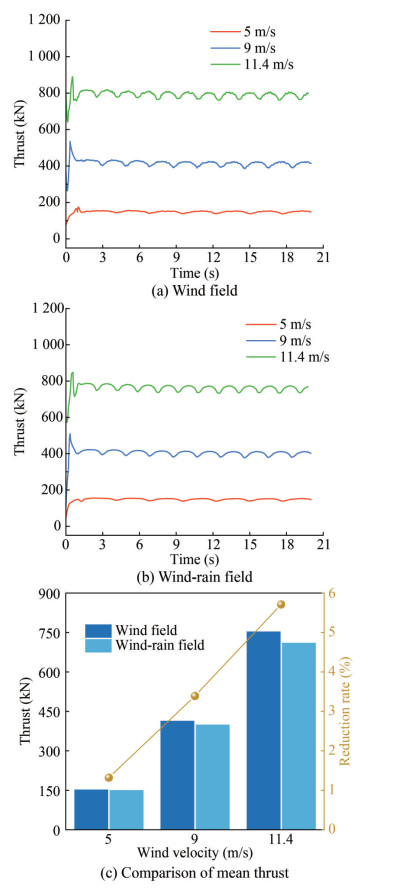 Figure 6 Thrust time history responses at different wind velocities
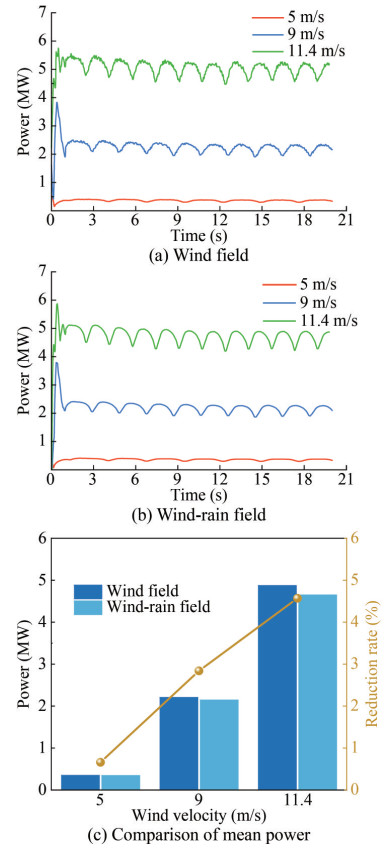 Figure 7 Power time history responses at different wind velocities
3.1.2 Analysis of raindrops
The distribution proportion and specific quantity distribution of raindrops on various parts of the wind turbine at a rated wind velocity of 11.4 m/s are presented in Figure 8(a) and Figure 8(b). We can observe from Figure 8(a) that the impeller and tower received the majority of the raindrop distribution, with a small amount falling on the nacelle. This is primarily attributed to the comparatively large windward surface areas of the impeller and tower. Regarding the quantity distribution of raindrops at varying diameters, Figure 8(b) shows that raindrops with relatively small diame ters, mostly less than 3 mm, were more likely to be cap tured by the impeller and tower. In addition, there were notably more droplets dispersed on the turbine windward side of the turbine compared to the leeward side. The blade length (63 m), which makes up more than two-thirds of the tower height (90 m), may account for these results. The rotational motion of the rotor impedes the descent of certain raindrops, allowing only a fraction to traverse the clear ance between the blades, thus slightly alleviating the impact of raindrops on the tower. Moreover, the rotor rotation induces higher wind speeds, disrupting raindrops through airflow and causing their dispersion. Consequently, rain drop separation near the blade tip of the impeller occurs, making it harder for raindrops to land on the tower. Upon examining Figure 8(c), it can be noted that the raindrop diameter had a moderate impact on their terminal velocity concerning those distributed on the windward side of the impeller and tower. Raindrops that refluxed on the wind ward side of the impeller exhibited the largest end velocity, approximately between 12 and 14 m/s, which was similar to the horizontal wind speed (11.4 m/s) in the flow field. Nonetheless, raindrops with diameters less than 3 mm evaded the tower and, propelled by backflow, continued to strike the leeward side of the tower at comparatively high speeds. By contrast, raindrops with larger diameters exhibited comparatively lower velocities owing to their higher volume and mass.
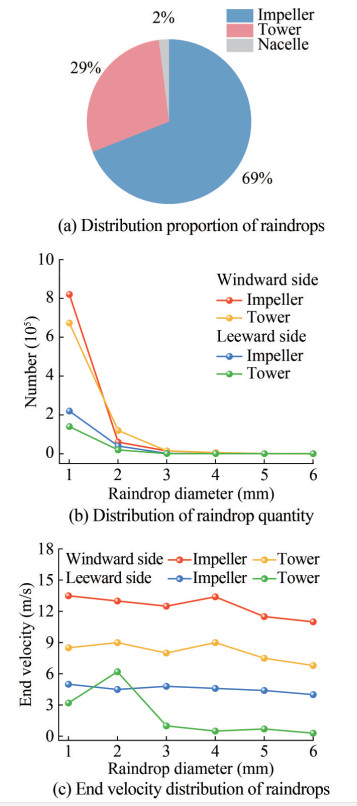 Figure 8 Raindrop distributions at each part of the wind turbine
Table 5 summarizes the distribution of the mean wind and rain loads on the wind turbine. Raindrops apply a relatively small rain load on the leeward side of the turbine owing to the backflow behind the turbine. From Table 5, it is evident that the wind load on the wind turbine is substan tially one order of magnitude greater than the rain load, dominating the turbine's aerodynamic performance. Particularly, the rain load, represented as the resultant force on the windward and leeward sides, accounts for 0.5%, 10.21%, and 0.73% of the wind load on the impeller, tower, and nacelle, respectively. Against this backdrop, the small proportion of rain loads means that they will not be differ entiated independently in the following analysis.
Table 5 Wind and rain load distributions of the wind turbine(kN) Load type Impeller Tower Nacelle Wind load 753.09 15.37 0.63 Rain load F(+) 4.28 1.64 0.006 F(-) 0.53 0.07 0 Note: F(+) is the rain load on the windward surface of the structure, and F(−) is the rain load on the leeward surface of the structure. This phenomenon can be attributed to the rotational motion of the blades. As the blades rotate, one blade con tinuously moves upward while the other moves downward. The downward-moving rain droplets impact both blades. Therefore, the relative velocity of the rain droplets on the upward-moving blade is greater than on the downwardmoving blade. This difference means that the rain droplets oppose the upward motion of one blade more significantly than they contribute to the downward motion of the other blade, thereby reducing the thrust and power of the wind turbine.
3.2 Aerodynamic performance under individual motions
The translational motion and tilt of a FOWT can cause an angle between the rotor plane and the incoming wind, altering the distribution of the wind speed gradient and the effective wind speed on the blades. This may lead to the dynamic stall of the rotor, a decrease in thrust, and an over all decline in the efficiency of power generation efficiency. Therefore, the FOWT's aerodynamic performance significantly differs from that of a turbine on a fixed foundation. To conduct in-depth research on the impact of various motion modes of a FOWT in the wind field on its aerodynamic performance and to determine the main influential motion modes, we apply single-DOF motions, namely surge, pitch, heave, and yaw, to the turbine operating at a rated wind velocity (VR) of 11.4 m/s to simulate the offshore floating situation. Given that wind loads largely impact the aerodynamic performance and load conditions of FOWTs in wind-rain fields, as discussed in Section 3.1, and the main purpose here is to compare the influences of various floating motions on the turbine aerodynamics, only the wind field was considered in this subsection to save calculation time. Table 6 lists the various amplitudes and periods of floating motions employed by previous scholars. According to literature research, the floating motion char acteristics used for modeling in this study are summarized in Table 7.
Table 6 Typical floating motions and relevant parameters in prior researchReferences Floating motion Amplitudes Periods/Frequency Pitch 2.475°, 4.95°, 7.34° 8.1 s (Cottura et al., 2022) Pitch from 0° to 2.5° with step of 0.25° from 0.05 Hz to 0.2 Hz with step of 0.025 Hz (Xu et al., 2023) Pitch 2°, 4°, 6°, 8° 10 s (Dong and Viré, 2022) Surge 9.4 m 8.1 s (Sun et al., 2023) Surge 0.916 m, 1.348 m, 2.56 m 12.66 s, 13.33 s, 15.38 s (Guo et al., 2022) Pitch, Surge 4°, 2°, 2 m, 1 m 5 s, 10 s (Chen et al., 2021b) Pitch, Yaw 4° 5 s, 10 s (Hu et al., 2023) Pitch, Yaw 2°, 4°, 6° 5 s, 10 s (Wu et al., 2024) Surge, Heave 2.5 m 5 s Table 7 Floating motion parameters for modelingFloating motion Amplitudes Periods Surge 1 m, 2 m, 4 m 5 s, 10 s, 15 s Pitch 1°, 2°, 4° 5 s, 10 s, 15 s Heave 0.5 m, 1 m, 1.5 m 5 s, 10 s, 15 s Yaw 2° 5 s 3.2.1 Surge
The thrust and power time history responses of the FOWT under surge in the wind field are shown in Figure 9 and Figure 10, respectively. From these graphs, we can note that once the flow field stabilizes, the thrust and power time history curves of the FOWT essentially follow sine function curves, displaying similar periodic variations. Figure 9(a) and Figure 10(a) demonstrate that the fluctuation amplitudes of the thrust and power of the FOWT are directly proportional to the surge amplitude when the surge period (T = 5 s) remains constant. Additionally, the FOWT reaches an equilibrium position in the surge motion when the thrust and power nearly reach their maximum and minimum val ues simultaneously. However, Figure 9(b) and Figure 10(b) illustrate that the fluctuation amplitude of the thrust and power of the FOWT is inversely proportional to the surge period when the surge amplitude remains constant (As = 2 m). These observations indicate that the fluctuation in aerodynamic performance became more intense with increasing surge amplitude, As, and decreasing surge period. This strong interaction between the turbine and the incoming flow is consistent with previous research (Fang et al., 2021; Chen et al., 2022; Lei et al., 2017).
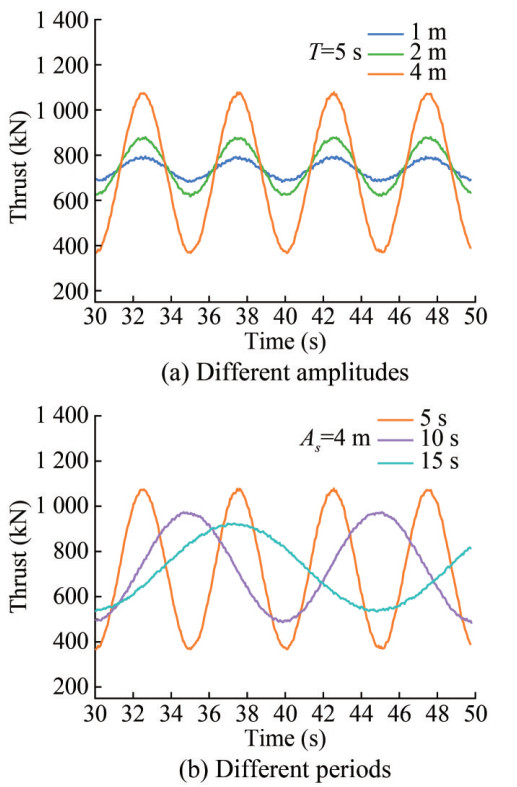 Figure 9 Time series of thrust under surge
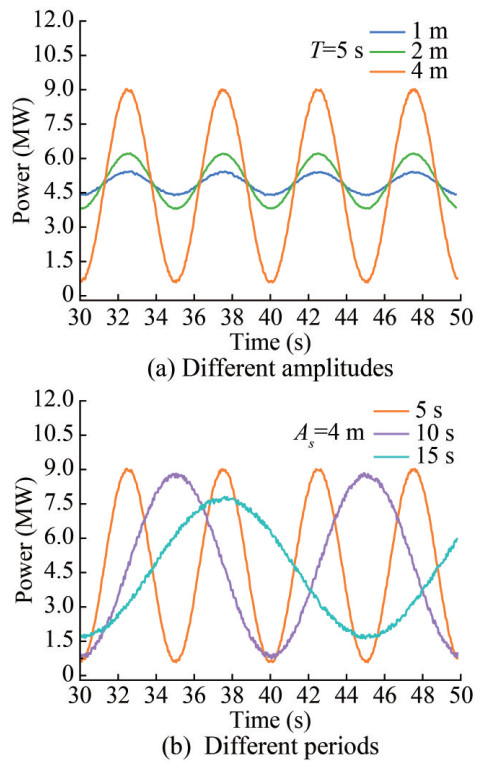 Figure 10 Time series of power under surge
It is widely accepted that the FOWT's thrust and power are proportional to the square and the cube of the relative wind speed between the rotor and the flow, V0, respectively (Fu et al., 2023; Wen et al., 2018). The relative wind speed V0 under surge motion can be calculated using Eq. (20).
$$ V_0=V_R-V_{\text {rotor }} $$ (20) where Vrotor is the velocity of the rotor induced by surge motion and expressed as Eq. (21):
$$ V_{\text {rotor }}=\frac{2 \pi A_s}{T} \cos \left(\frac{2 \pi}{T} t\right) $$ (21) Substituting Eq. (21) into Eq. (20) yields:
$$ V_0=V_R-V_{\text {rotor }}=V_R-\frac{2 \pi A_s}{T} \cos \left(\frac{2 \pi}{T} t\right) $$ (22) As the turbine oscillates upwind, the superposition of incoming wind speed and surge speed increases the relative wind speed, resulting in higher thrust and power. Conversely, during the turbine's downwind oscillation, the relative wind speed diminishes owing to the decline in the difference between the surge speed and the incoming wind speed (Fang et al., 2021). Consequently, a decreasing trend occurs in the thrust and power of the rotor. In light of the above, the thrust and power time history curves exhibit a consistent trend with the surge motion. Additionally, Eq. (22) helps explain why fluctuations in thrust and power are more severe with increasing surge amplitude (As) and decreasing period. The relative wind speed variation with upwind and downwind surges leads to changes in the attack angle and flow field near the blade surface. When the attack angle surpasses the stall angle, a dynamic stall occurs, damaging the turbine's aerodynamic performance. As reported by Chen et al. (2022), larger surge amplitudes and shorter surge periods result in larger separation areas on the upper surface of the flow field, indicating a more severe stall phenomenon. In light of the above, the influence of surge amplitude and period on the aerodynamic performance of the FOWT can be corroborated.
3.2.2 Pitch
Figure 11 and Figure 12 depict the thrust and power time history responses of the FOWT under pitch in the wind field. These figures reveal several key insights: First, similar to the situation under surge, the FOWT's thrust and power time history curves resemble periodic sine function curves following the flow field stabilization, consistent with the findings of Cottura et al. (2022). However, at a pitch amplitude (Ap) of 4°, certain fluctuations appear at the peaks and troughs of these curves. This indicates that a large Ap, potentially more than 2°, significantly affects the aerodynamic performance of the FOWT. This can be explained by the fact that the attack angle increases beyond the stall angle owing to the relative wind speed fluctuation, causing a dynamic stall and thus damaging the turbine's aerodynamic performance (Fang et al., 2020). Meanwhile, Figure 11(a) and Figure 12(a) show instances of local negative thrust and power consumption. Furthermore, the FOWT's thrust and power fluctuation amplitude increases with the increment of the pitch amplitude and decreases with the increment of the surge period. These observations align with the results reported by Fang et al. (2020), Fu et al. (2023), and Feng et al. (2021).
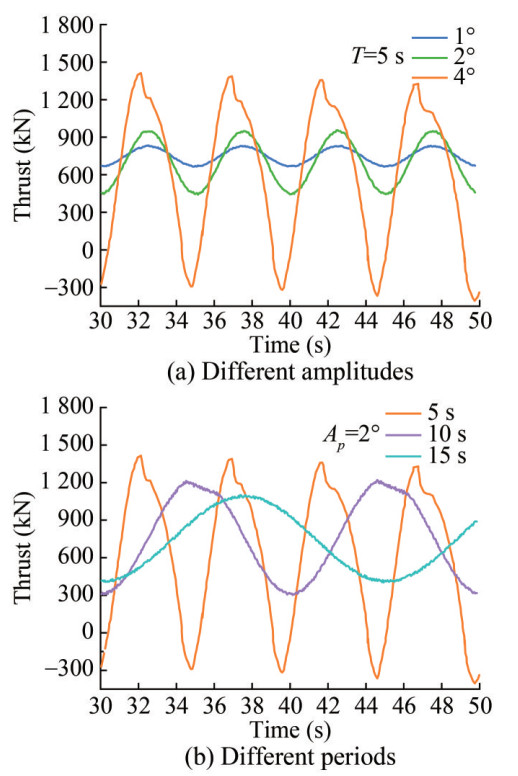 Figure 11 Time series of thrust under pitch
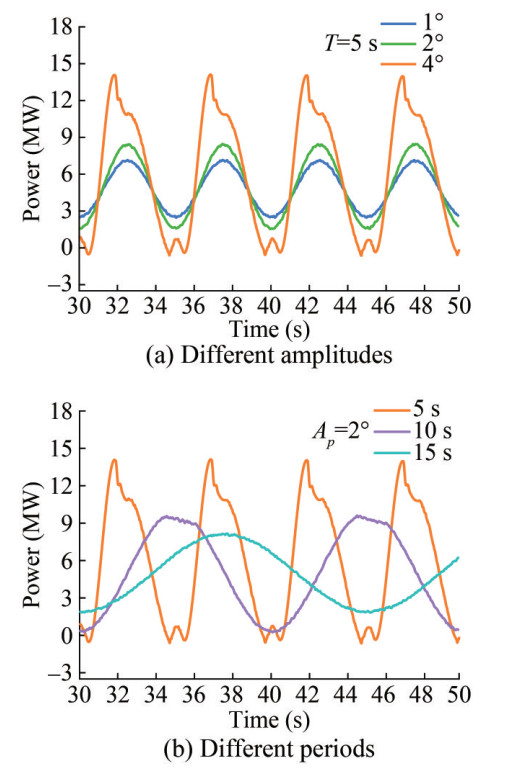 Figure 12 Time series of power under pitch
The pitch oscillation yields a displacement of the nacelle, which results in a speed in the wind direction, as shown in Eq. (23).
$$ V_{\mathrm{nac}}=H \frac{2 \pi}{T} A_p \cos \left(\frac{2 \pi}{T} t\right) $$ (23) where Vnac refers to the nacelle speed induced by the pitch motion, and H denotes the nacelle height. The relative wind speed V0 with respect to the nacelle is calculated in Eq. (24):
$$ V_0=V_R-V_{\mathrm{nac}}=11.4-H \frac{2 \pi}{T} A_p \cos \left(\frac{2 \pi}{T} t\right) $$ (24) As aforementioned, the FOWT's thrust and power are proportional to the square and the cube of the relative wind speed V0 (Fu et al., 2023; Wen et al., 2018). From this perspective, the relative wind speed increases as pitch amplitude, Ap, increases and pitch period decreases, result ing in an increment in thrust and power.
3.2.3 Heave
The thrust and power time history responses of the FOWT under heave in the wind field are plotted in Figure 13(a) and Figure 13(b), respectively. Unlike the aerodynamic performance time history curves of sinusoidal form observed under surge and pitch motions, those under heave motion fluctuate with discernible regular patterns. As the amplitude (Ah) and period (T) of the heave motion increase, the fluctuation amplitude of thrust and power time history curves marginally increases. Moreover, the thrust and power time history curves appear to follow a similar trend, rising or falling synchronously. Under the three calculation conditions shown in Figure 13, i.e., Ah = 0.5 m with T = 5 s, Ah = 1 m with T = 10 s, and Ah = 1.5 m with T = 15 s, respectively, heave motion significantly reduces the magnitude of variations in the turbine's aerodynamic performance and produces little disturbance to the flow field. The thrust and power of the FOWT under heave fluctuate around 750 kN and 5 MW, respectively. The primary reason for this behavior is that heave motion is a vertical reciprocating motion, which does not involve lateral movement of the rotor. Consequently, it is less sensitive to alterations in the relative wind speed. The tower also affects the aerodynamic performance of the FOWT through interference with the blades. This interference can cause turbulence and vortex in the airflow around the blades, resulting in irregular oscillations in thrust and power. Thus, the main reason for the variation in the thrust and power time history curves is probably the tower-shadow effect (Hu et al., 2021).
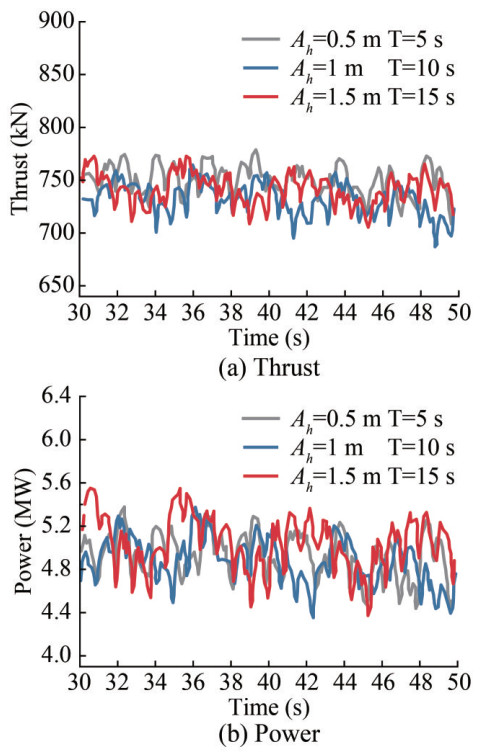 Figure 13 Time series of thrust and power under heave
3.2.4 Yaw
To stably capture wind energy for efficient power generation, an anchor chain mooring structure links a semisubmersible floating foundation to a mooring system. This design and operation strategy constrains the yaw motion, preventing significant rotation of the turbine in the wind ward direction (Le et al., 2019). Against this backdrop, a yaw angle amplitude of 2° with a period of 5 s was used as a research case to investigate the FOWT's aerodynamic performance under yaw. Figure 14 illustrates the thrust and power time history responses of the FOWT under yaw in the wind field, fluctuating with little discernible regular pattern. Similar to Figure 13, the thrust and power time history curves under yaw tend to rise or fall synchronously at corresponding times. The reason behind this phenome non is that yaw motion creates an angle between the rotor plane and the incoming wind, resulting in non-axial inflow and complicating the flow situation in the flow field. Specifically, the variation in relative wind speed at different positions on the rotor is directly proportional to the distance from the hub center because yaw is a rotating motion centered on the wheel hub. For blades rotating upwind, the relative wind speed increases owing to the superposition of the blade speed and incoming wind speed. The closer to the hub center, the less the relative wind speed increases. Conversely, the downwind-rotating blades experience a decrease in relative speed as the blade speed offsets the incoming wind. These dynamics lead to uneven changes in the effective wind speed across the blade surface, causing irregular fluctuations in the thrust and power time history curves (Ye et al., 2020).
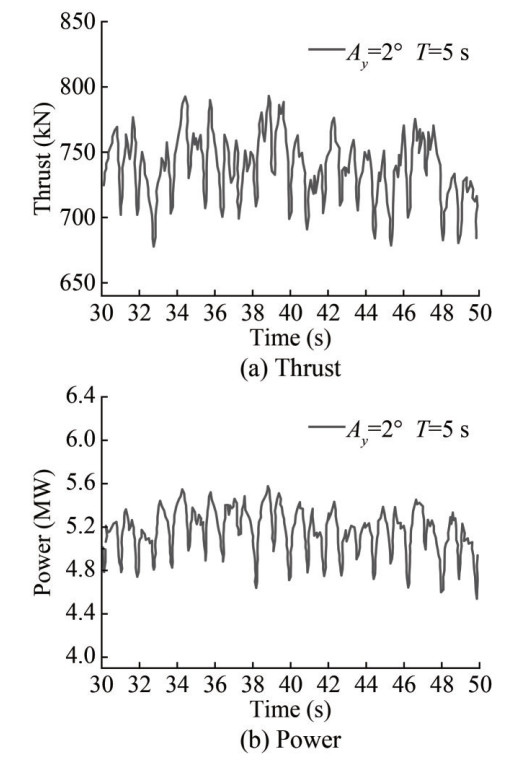 Figure 14 Time series of thrust and power under yaw
3.2.5 Influence of individual motion
Based on the corresponding thrust and power calculation values, Figure 15 plots the thrust and power calculation values of the turbine in single-DOF motion and fixed foundation in the wind field, respectively. As stated above, the FOWT's thrust and power under surge and pitch increased with the increment in motion amplitudes (As and Ah) and reduction in the motion periods, irrespective of the mean, maximum, or amplitude values. This trend is emphasized intuitively by Figure 15. Among the different motion types, the FOWT's aerodynamic performance was most affected by pitch motion, particularly when Ap = 4° and T = 5 s. In this context, the fluctuation amplitude values of thrust and power increased by approximately 16 times and 31 times, respectively, with respect to the corresponding values of the turbine on a fixed foundation. Surge motion also had a relatively significant influence on the turbine's aerodynamic performance, particularly when As = 4 m and T = 5 s. Prominently, under surge and pitch motions, the mean thrust of the FOWT either reduced by roughly 0.5% to 13.5% or slightly increased, while the maximum thrust swelled by 2% to 70%. Moreover, the fluctuation amplitude of thrust surged tens of times. The same trend was observed for power. Thus, it is evident that floating motions significantly reduce efficiency and aggravate the FOWT's extreme working conditions, which can be detrimental to its operation. These conditions place higher demands on the strength of construction materials and the ultimate bearing capacity of the blades. However, heave and yaw motions had negligible influence on the turbine's thrust and power, basically below 2%, compared to the surge and pitch motions.
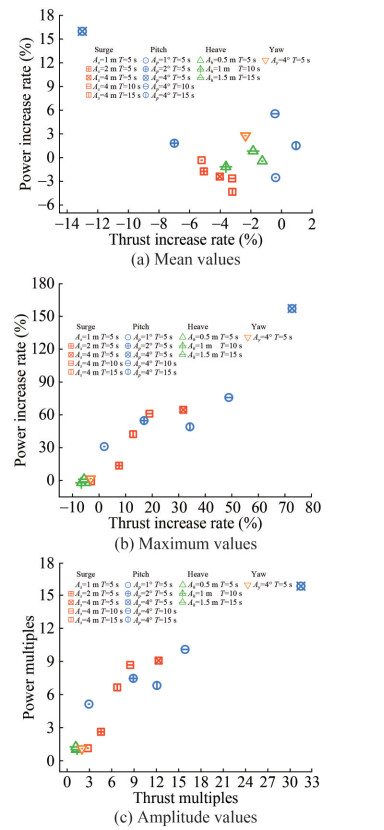 Figure 15 Summary and comparison of FOWT's aerodynamic responses under individual motions
3.3 Aerodynamic performance under coupled motions
Based on the results from the previous subsection, multiple-DOF coupled motions dominated by surge and pitch are imposed on the FOWT to evaluate its aerodynamic performance in the wind field and wind-rain field. The coupled motions include a combination of surge and pitch, surge and heave, surge and yaw, pitch and heave, and pitch and yaw. We introduce a discrete-phase raindrop model that corresponds to a rainfall intensity of 200 mm/h. In addition, a rated wind speed of 11.4 m/s is set for the mode. The specific parameter settings of the coupled motions are listed in Table 8.
Table 8 Parameter settings of coupled motions in wind-rain fieldMotion period Coupled motions Amplitudes 5 s Surge + Pitch As= 4 m, Ap= 4° Surge + Heave As= 4 m, Ah= 5 m Surge + Yaw As= 4 m, Ay= 2° Pitch + Heave Ap= 4°, Ah= 0.5 m Pitch + Yaw Ap= 4°, Ay= 2° 3.3.1 Aerodynamic performance
Figure 16 and Figure 17 show the thrust and power time history responses of the FOWT under various coupled motions, respectively. The calculation results are derived from a motion cycle after the stabilization of the flow field, specifically within the time quantum of 10-15 s. Figure 18 and Figure 19 illustrate the average, maximum, and amplitude values of the FOWT's thrust and power fluctuation curves under coupled and individual motions. From Figure 16 and Figure 17, it is evident that even minor coupled floating motions may cause a large variation in the unsteady aerodynamic responses. The turbine's thrust and power time history curves were dramatically distorted from the sine shape both in the wind field and the wind-rain field scenarios. Negative values of thrust and power emerged in cases of coupled motions that included pitch (see Figure 16(a), Fig ure 16(d), Figure 16(e), Figure 17(a), Figure 17(d), and Figure 17(e)). This may be attributed to dynamic stall resulting from the attack angle exceeding the stall angle. Beyond that, the fluctuation of thrust and thrust and power time history curves under the coupled motions of surge + heave and surge + yaw was relatively mild compared to the other three types of coupled motions. This suggests a limited impact induced by surge + heave and surge + yaw on the FOWT's aerodynamic performance. This further confirms that the surge and pitch dominate the variation in the FOWT's aerodynamics under coupled motions. Interestingly, as shown in Figure 16 and Figure 17, the aerodynamic responses excited by the wind-rain field were slightly lower than those excited by the wind field throughout a complete floating motion cycle. This pattern is also reflected in the mean, maximum, and amplitude values of the thrust and power shown in Figure 18(a) and Figure 19(a). These observations can be explained by the increased turbine's aerodynamic resistance and additional loads induced by the wetting effect of raindrops on the blade surface.
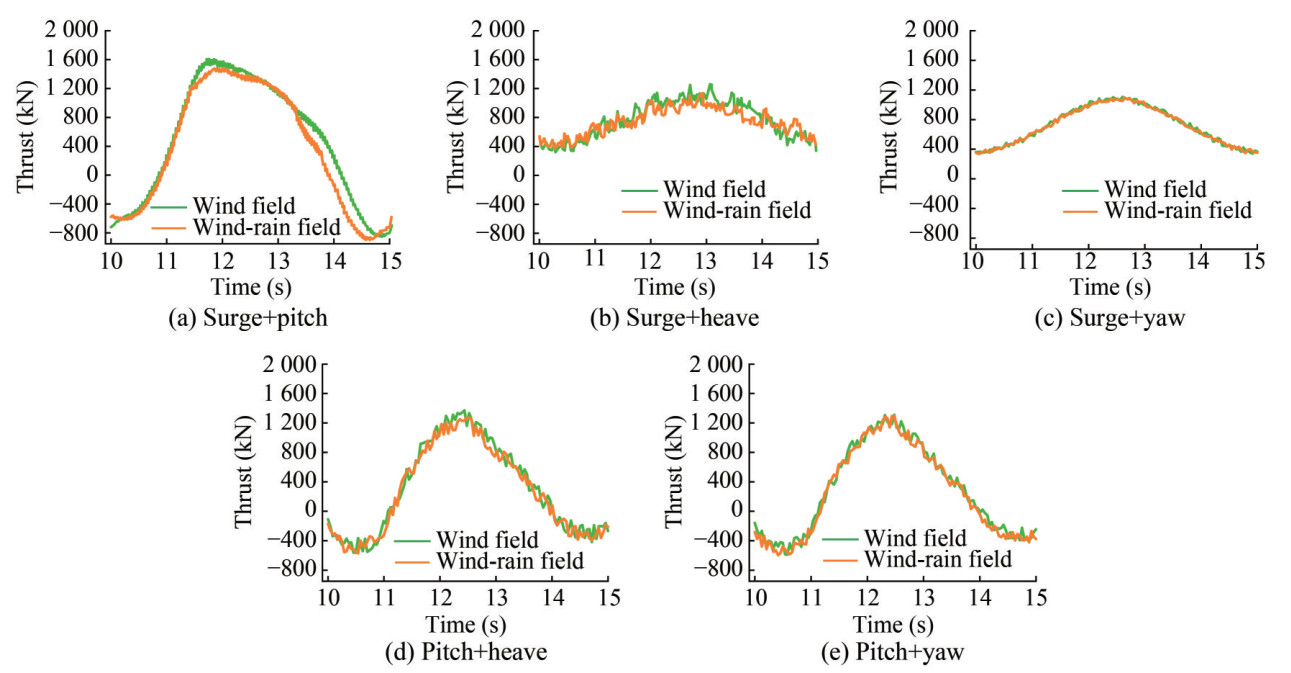 Figure 16 Time series of thrust under various coupled motions
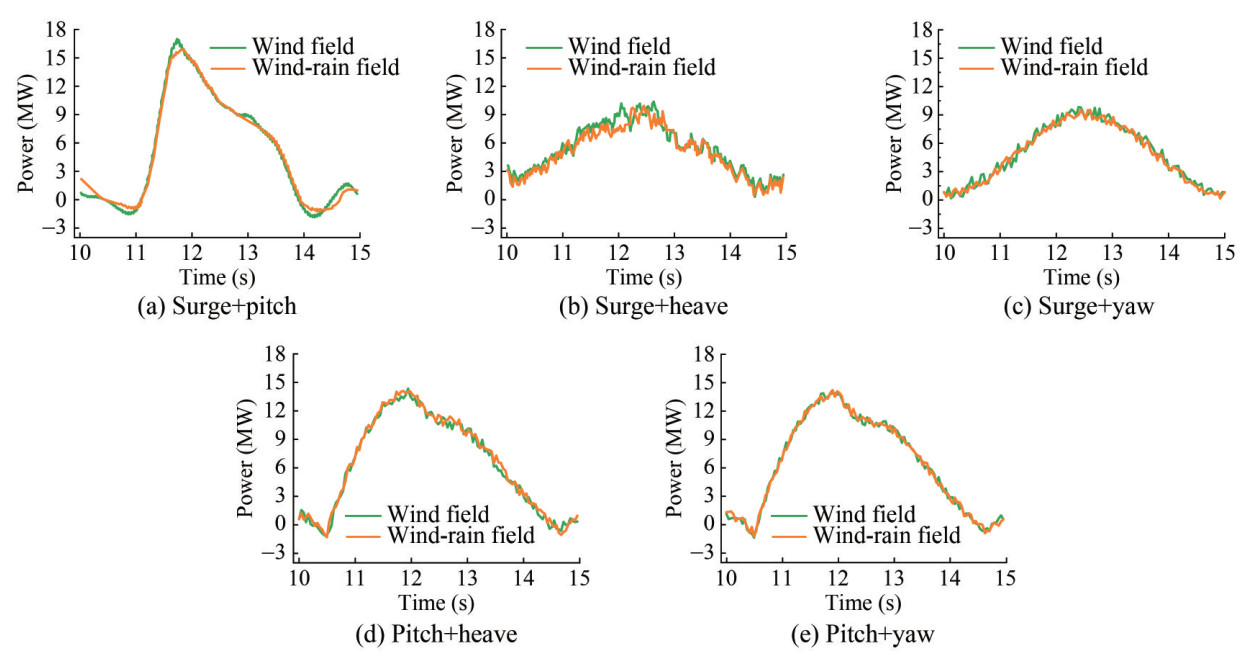 Figure 17 Time series of power under various coupled motions
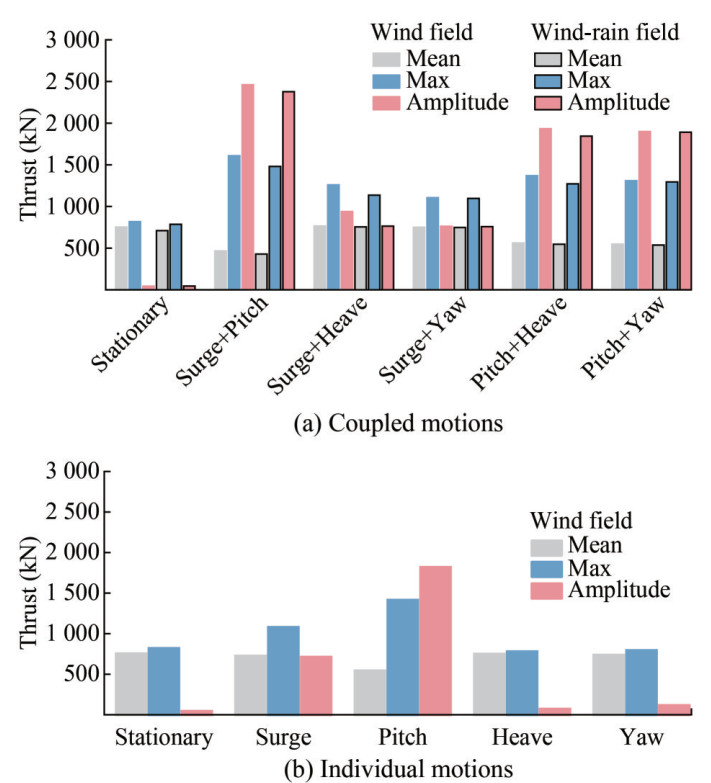 Figure 18 Average, maximum, and amplitude thrust values
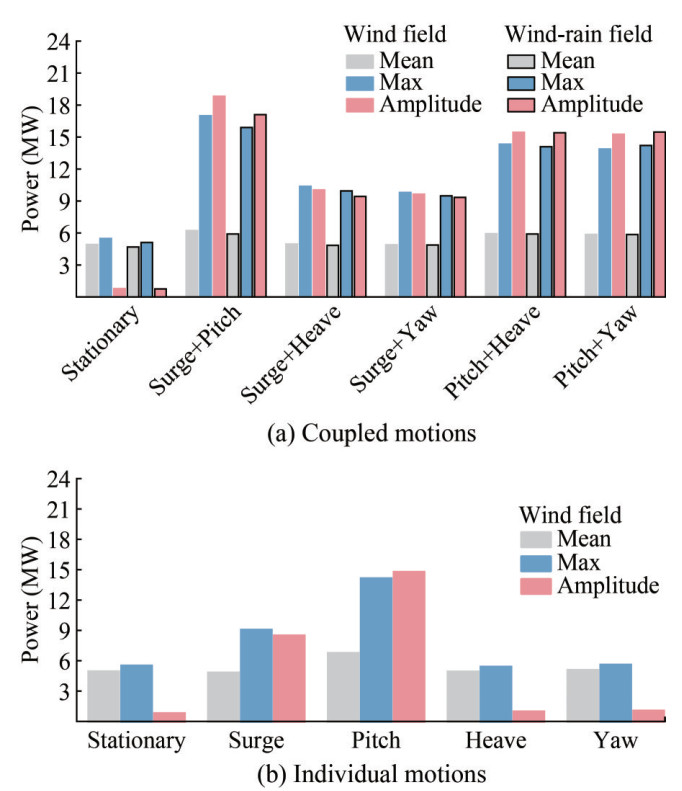 Figure 19 Average, maximum, and amplitude power values
As detailed in Figure 18 and Figure 19, we can intuitively and concretely observe that the coupled floating motions indeed exacerbated the unsteady aerodynamic performance of the turbine. Compared to the stationary turbine, decreasing mean thrust and increasing mean power were evident in almost all five types of coupled motions within both the wind field and the wind-rain field. However, there was an extremely significant increment in the maximum and amplitude values, demonstrating dramatically severe thrust and power fluctuations. The most prominent impact among the coupled motions was observed in surge +pitch. In this case, the maximum thrust and power were virtually twice and three times, respectively, as much as those on a fixed foundation. Additionally, the amplitudes of the thrust and power were almost fifty and twenty times greater than those of the stationary turbine, respectively. While the other types of coupled motions had less obvious impacts on the turbine's unsteady aerodynamic performance, their effects were still significant, especially regarding the maximum and amplitude values of thrust and power. Comparing the results of the coupled motions (see Figure 18(a) and Figure 19(a)) with the individual motions (see Figure 18(b) and Figure 19(b)), it is apparent that fluctuation amplitudes excited by coupled motions were larger than those excited by the corresponding single-DOF motions. This suggests the possible presence of resonance phenomena owing to the mutual influence and interactions between different floating motions within the same period. In conjunction with Figure 16 and Figure 17, it can be noted that the combination of two singleDOF motions indeed increased the amplitude of aerodynamic performance changes, making instantaneous fluctuations more severe under the coupled motions.
In conclusion, from Figure 16 to Figure 19, coupled motions aggravated changes in the unsteady aerodynamic performance of the floating turbine, regardless of whether within the wind field or the wind-rain field. The impact of pitch-dominated motions was even more prominent. These motions decreased the average thrust, increased the aver age power, and caused dramatic fluctuations in aerodynamic responses. Above all, the motion of surge + pitch was the most disadvantageous test operation condition for the FOWT.
3.3.2 Influence of coupled motion
The turbine's aerodynamics are influenced by the rela tive wind velocity and the rotor's swept area (Chen et al., 2021a; Wen et al., 2018). The relative wind velocity depends on the rotor's displacement in the incoming wind direction, according to Eq. (20). Surge motion causes a periodic displacement of the rotor with an amplitude (As) of 4 m in the incoming wind direction. With respect to the pitch motion, the rotor center/nacelle undergoes a rotational motion with the tower base as the center and the tower height (90 m) as the radius. This results in a displacement amplitude of displacement in the incoming wind direction of approximately 9.4 m when Ap = 4°. However, this dis placement of the rotor owing to heave and yaw is nearly negligible. Furthermore, the rotation of the rotor forms a periodic angle with the incoming wind and causes inconsistent displacement among the various blades in the rotor plane. This alters the swept area periodically and introduces heterogeneity in the relative wind speed at the rotor plane. These factors explain why turbine aerodynamics fluctuate most severely under the coupled motion of surge + pitch. Such increased aerodynamic variation can be harmful to the grid. Despite the increased mean power output under coupled motions, the fatigue damage introduced by fluctuating aerodynamic loads should be a primary concern (Wen et al., 2018). Therefore, it is crucial to implement measures to restrict floating motion, ensuring the stability and safety of FOWT operations.
4 Conclusions
This work performed a numerical simulation of a NREL- 5MW FOWT to investigate its aerodynamic performance under various operational conditions in wind-rain field, including single-DOF and coupled floating motions, respectively. Detailed analysis and interpretation of thrust and power data were performed to evaluate the aerodynamic efficiency degradation under various conditions. The con clusions are as follows:
1) The implementation of the standard k − ε turbulence model and the overset mesh technology for the wind turbine model have proven effective in simulating the aerodynamic response of the wind turbine. This is confirmed by comparing the results from the stationary wind turbine with those from NREL officials and other scholars.
2) The discrete phase has been incorporated for follow-up wind-rain coupling iterations. The results showed that the thrust and power of the stationary wind turbine manifested similar fluctuating patterns in both the wind field and the wind-rain field, respectively. The fluctuating amplitude rose with higher wind speeds. However, aerodynamic performance degradation was observed in the wind-rain field compared to that in the wind field, despite rain loads account ing for a small proportion of total loads. Specifically, the mean thrust and power of the wind turbine in the wind-rain field declined by about 1% to 6% compared to those in the wind field at wind speeds of 5 m/s, 9 m/s, and 11.4 m/s.
3) With respect to the aerodynamic performance of the FOWT under single-DOF floating motions, the pitch motion had the greatest impact on the turbine's aerodynamic performance in the wind field, especially when Ap = 4° and T = 5 s. This was followed by surge motion in the case of As = 4 m and T = 5 s, owing to the large periodic changes in the relative wind speed and swept area of the rotor. By contrast, the influence of the heave and yaw motions on the turbine's thrust and power was negligible, with a change rate generally below 2%.
4) Under coupled motions, rain-induced aerodynamic reduction was evident in the mean, maximum, and amplitude values of the FOWT's thrust and power. Moreover, all five types of coupled motions tested in this study exerted notable effects on the FOWT's aerodynamic performance, especially pitch-dominated motions. Among these, the surge + pitch imposed the harshest operational environment on the FOWT, highlighting the necessity of optimizing the FOWT to mitigate excessive pitch and surge.
Competing interest The authors have no competing interests to declare that are relevant to the content of this article. -
Figure 1 Motion forms of the FOWT
Figure 2 Turbine configuration
Figure 3 Schematic setup of the computational domain
Figure 4 Comparison of thrust and torque at different wind velocities
Figure 5 Diagram of motion forms
Figure 6 Thrust time history responses at different wind velocities
Figure 7 Power time history responses at different wind velocities
Figure 8 Raindrop distributions at each part of the wind turbine
Figure 9 Time series of thrust under surge
Figure 10 Time series of power under surge
Figure 11 Time series of thrust under pitch
Figure 12 Time series of power under pitch
Figure 13 Time series of thrust and power under heave
Figure 14 Time series of thrust and power under yaw
Figure 15 Summary and comparison of FOWT's aerodynamic responses under individual motions
Figure 16 Time series of thrust under various coupled motions
Figure 17 Time series of power under various coupled motions
Figure 18 Average, maximum, and amplitude thrust values
Figure 19 Average, maximum, and amplitude power values
Table 1 Calculation results of raindrop density
Raindrop diameter (mm) 0-1 1-2 2-3 3-4 4-5 5-6 raindrop density (m-3) 4 406 1 153 302 79 20 7 Table 2 Basic properties of the NREL-5MW wind turbine
Parameter Value Rotor diameter (m) 126 Hub diameter (m) 3 Cut-in wind speed (m/s) 3 Rated wind speed (m/s) 11.4 Cut-out wind speed (m/s) 25 Rated rotor speed (r/min) 12.1 Table 3 Comparison of the calculation results of different grid numbers
Grid Mesh number ×106 Thrust (kN)/Error Power (MW)/Error Coarse 1.37 773/3.3% 4.74/5.2% Medium 2.16 785/1.9% 5.03/0.6% Fine 3.27 791/1.1% 5.08/1.6% Table 4 Comparison of the calculation results of different downstream distances
Downstream distance (m) Thrust (kN)/Error Power (MW)/Error 550 785/1.9% 5.03/0.6% 1 100 789/1.4% 5.05/1.0% 1 650 791/1.1% 5.01/0.2% Table 5 Wind and rain load distributions of the wind turbine
(kN) Load type Impeller Tower Nacelle Wind load 753.09 15.37 0.63 Rain load F(+) 4.28 1.64 0.006 F(-) 0.53 0.07 0 Note: F(+) is the rain load on the windward surface of the structure, and F(−) is the rain load on the leeward surface of the structure. Table 6 Typical floating motions and relevant parameters in prior research
References Floating motion Amplitudes Periods/Frequency Pitch 2.475°, 4.95°, 7.34° 8.1 s (Cottura et al., 2022) Pitch from 0° to 2.5° with step of 0.25° from 0.05 Hz to 0.2 Hz with step of 0.025 Hz (Xu et al., 2023) Pitch 2°, 4°, 6°, 8° 10 s (Dong and Viré, 2022) Surge 9.4 m 8.1 s (Sun et al., 2023) Surge 0.916 m, 1.348 m, 2.56 m 12.66 s, 13.33 s, 15.38 s (Guo et al., 2022) Pitch, Surge 4°, 2°, 2 m, 1 m 5 s, 10 s (Chen et al., 2021b) Pitch, Yaw 4° 5 s, 10 s (Hu et al., 2023) Pitch, Yaw 2°, 4°, 6° 5 s, 10 s (Wu et al., 2024) Surge, Heave 2.5 m 5 s Table 7 Floating motion parameters for modeling
Floating motion Amplitudes Periods Surge 1 m, 2 m, 4 m 5 s, 10 s, 15 s Pitch 1°, 2°, 4° 5 s, 10 s, 15 s Heave 0.5 m, 1 m, 1.5 m 5 s, 10 s, 15 s Yaw 2° 5 s Table 8 Parameter settings of coupled motions in wind-rain field
Motion period Coupled motions Amplitudes 5 s Surge + Pitch As= 4 m, Ap= 4° Surge + Heave As= 4 m, Ah= 5 m Surge + Yaw As= 4 m, Ay= 2° Pitch + Heave Ap= 4°, Ah= 0.5 m Pitch + Yaw Ap= 4°, Ay= 2° -
Arastoopour H, Cohan A (2017) CFD simulation of the effect of rain on the performance of horizontal wind turbines. AIChE Journal 63(12): 5375-5383. http://doi.org/10.1002/aic.15928 Bera P, Lakshmi RV, Pathak SM, Bonu V, Mishnaevsky L, Barshilia HC (2023) Recent progress in the development and evaluation of rain and solid particle erosion resistant coatings for leading edge protection of wind turbine blades. Polymer Reviews 64(2): 639-689. http://doi.org/10.1080/15583724.2023.2270050 Cai Y, Zhao H, Li X, Liu Y (2023) Aerodynamic analysis for different operating states of floating offshore wind turbine induced by pitching movement. Energy 285: 129538. http://doi.org/10.1016/j.energy.2023.129538 Chen G, Liang XF, Li XB (2022) Modelling of wake dynamics and instabilities of a floating horizontal-axis wind turbine under surge motion. Energy 239: 122110. http://doi.org/10.1016/j.energy.2021.122110 Chen Z, Wang X, Guo Y, Kang S (2021a) Numerical analysis of unsteady aerodynamic performance of floating offshore wind turbine under platform surge and pitch motions. Renewable Energy 163: 1849-1870. http://doi.org/10.1016/j.renene.2020.10.096 Chen Z, Wang X, Kang S (2021b) Effect of the coupled pitch-yaw motion on the unsteady aerodynamic performance and structural response of a floating offshore wind turbine. Processes 9(2): 290. http://doi.org/10.3390/pr9020290 Cottura L, Caradonna R, Novo R, Ghigo A, Bracco G, Mattiazzo G (2022) Effect of pitching motion on production in a OFWT. Journal of Ocean Engineering and Marine Energy 8(3): 319-330. http://doi.org/10.1007/s40722-022-00227-0 Dong J, Viré A (2022) The aerodynamics of floating offshore wind turbines in different working states during surge motion. Renewable Energy 195: 1125-1136. http://doi.org/10.1016/j.renene.2022.06.016 El-Askary WA, Sakr IM, AbdelSalam AM, Abuhegazy MR (2017) Modeling of wind turbine wakes under thermally-stratified atmospheric boundary layer. Journal of Wind Engineering and Industrial Aerodynamics 160: 1-15. http://doi.org/10.1016/j.jweia.2016.11.001 Fang J, Hu W, Liu Z, Chen W, Tan J, Jiang Z, Verma AS (2022) Wind turbine rotor speed design optimization considering rain erosion based on deep reinforcement learning. Renewable and Sustainable Energy Reviews 168: 112788. http://doi.org/10.1016/j.rser.2022.112788 Fang Y, Duan L, Han Z, Zhao Y, Yang H (2020) Numerical analysis of aerodynamic performance of a floating offshore wind turbine under pitch motion. Energy 192: 116621. http://doi.org/10.1016/j.energy.2019.116621 Fang Y, Li G, Duan L, Han Z, Zhao Y (2021) Effect of surge motion on rotor aerodynamics and wake characteristics of a floating horizontal-axis wind turbine. Energy 218: 119519. http://doi.org/10.1016/j.energy.2020.119519 Farrugia R, Sant T, Micallef D (2016) A study on the aerodynamics of a floating wind turbine rotor. Renewable Energy 86: 770-784. http://doi.org/10.1016/j.renene.2015.08.063 Feng X, Lin Y, Zhang G, Li D, Liu H, Wang B (2021) Influence of combined motion of pitch and surge with phase difference on aerodynamic performance of floating offshore wind turbine. Journal of Marine Science and Engineering 9(7): 699. http://doi.org/10.3390/jmse9070699 Fontanella A, Facchinetti A, Di Carlo S, Belloli M (2022) Wind tunnel investigation of the aerodynamic response of two 15 MW floating wind turbines. Wind Energy Science 7(4): 1711-1729. http://doi.org/10.5194/wes-7-1711-2022 Fu S, Li Z, Zhu W, Han X, Liang X, Yang H, Shen W (2023) Study on aerodynamic performance and wake characteristics of a floating offshore wind turbine under pitch motion. Renewable Energy 205: 317-325. http://doi.org/10.1016/j.renene.2023.01.040 Gueydon S (2016) Aerodynamic damping on a semisubmersible floating foundation for wind turbines. Energy Procedia 94: 367-378. http://doi.org/10.1016/j.egypro.2016.09.196 Guo Y, Liu LQ, Li Y, Xiao CS, Tang YG (2018) The surge-heave-pitch coupling motions of the ϕ-type vertical axis wind turbine supported by the truss Spar floating foundation. Journal of Hydrodynamics 31(4): 669-681. http://doi.org/10.1007/s42241-018-0158-7 Guo Y, Wang X, Mei Y, Ye Z, Guo X (2022) Effect of coupled platform pitch-surge motions on the aerodynamic characters of a horizontal floating offshore wind turbine. Renewable Energy 196: 278-297. http://doi.org/10.1016/j.renene.2022.06.108 Hoksbergen TH, Akkerman R, Baran I (2023) Rain droplet impact stress analysis for leading edge protection coating systems for wind turbine blades. Renewable Energy 218: 119328. http://doi.org/10.1016/j.renene.2023.119328 Hu D, Deng L, Zeng L (2021) Study on the aerodynamic performance of floating offshore wind turbine considering the tower shadow effect. Processes 9(6): 1047. http://doi.org/10.3390/pr9061047 Hu D, Zeng L, Deng L, Yin J, Liu J (2023) Aerodynamic wake characteristics analysis of floating offshore wind turbine under platform pitching and yawing motions. Journal of Renewable and Sustainable Energy 15(3): 033303. http://doi.org/10.1063/5.0148352 Jiang Y, Hu G, Zong Z, Zou L, Jin G (2020) Influence of an integral heave plate on the dynamic response of floating offshore wind turbine under operational and storm conditions. Energies 13(22): 6122. http://doi.org/10.3390/en13226122 Kang TW, Kim ES, Yang HI (2021) Effects of dynamic motion and structural response of a semi-submersible floating offshore wind turbine structure under waves generated in a hurricane environment. International Journal of Precision Engineering and Manufacturing-Green Technology 9(2): 537-556. http://doi.org/10.1007/s40684-021-00331-w Ke S, Yu W, Wang T, Ge Y (2019) Aerodynamic performance and wind-induced effect of large-scale wind turbine system under yaw and wind-rain combination action. Renewable Energy 136: 235-253. http://doi.org/10.1016/j.renene.2018.12.123 Kirby AC, Brazell MJ, Yang Z, Roy R, Ahrabi BR, Stoellinger MK, Sitaraman J, Mavriplis DJ (2019) Wind farm simulations using an overset hp-adaptive approach with blade-resolved turbine models. International Journal of High Performance Computing Applications 33(5): 897-923. http://doi.org/10.1177/1094342019832960 Kuang L, Lu Q, Huang X, Song L, Chen Y, Su J, Han Z, Zhou D, Zhao Y, Xu Y, Liu Y (2022) Characterization of wake interference between two tandem offshore floating vertical-axis wind turbines: Effect of platform pitch motion. Energy Conversion and Management 265: 115769. http://doi.org/10.1016/j.enconman.2022.115769 Le C, Li Y, Ding H (2019) Study on the coupled dynamic responses of a submerged floating wind turbine under different mooring conditions. Energies 12(3): 418. http://doi.org/10.3390/en12030418 Lee H, Lee DJ (2019) Effects of platform motions on aerodynamic performance and unsteady wake evolution of a floating offshore wind turbine. Renewable Energy 143: 9-23. http://doi.org/10.1016/j.renene.2019.04.134 Lei H, Su J, Bao Y, Chen Y, Han Z, Zhou D (2019) Investigation of wake characteristics for the offshore floating vertical axis wind turbines in pitch and surge motions of platforms. Energy 166: 471-489. http://doi.org/10.1016/j.energy.2018.10.101 Lei H, Zhou D, Bao Y, Chen C, Ma N, Han Z (2017) Numerical simulations of the unsteady aerodynamics of a floating vertical axis wind turbine in surge motion. Energy 127: 1-17. http://doi.org/10.1016/j.energy.2017.03.087 Li J, Bian J, Ma Y, Jiang Y (2021) Impact of typhoons on floating offshore wind turbines: A case study of typhoon mangkhut. Journal of Marine Science and Engineering 9(5): 543. http://doi.org/10.3390/jmse9050543 Li N, Li L, Liu Y, Wu Y, Meng H, Yan J, Han S (2022) Effects of the parameter C4ε in the extended k-ε turbulence model for wind farm wake simulation using an actuator disc. Journal of Marine Science and Engineering 10(4): 544. http://doi.org/10.3390/jmse10040544 Nedjari HD, Guerri O, Saighi M (2020) Full rotor modelling and generalized actuator disc for wind turbine wake investigation. Energy Reports 6: 232-255. http://doi.org/10.1016/j.egyr.2019.10.041 Norouzian F, Marchetti E, Gashinova M, Hoare E, Constantinou C, Gardner P, Cherniakov M (2020) Rain attenuation at millimeter wave and low-THz frequencies. IEEE Transactions on Antennas and Propagation 68(1): 421-431. http://doi.org/10.1109/tap.2019.2938735 Nybo A, Nielsen FG, Reuder J, Churchfield MJ, Godvik M (2020) Evaluation of different wind fields for the investigation of the dynamic response of offshore wind turbines. Wind Energy 23(9): 1810-1830. http://doi.org/10.1002/we.2518 Putra MJ, Oguz E, Uzol NS (2023) Aerodynamic and hydrodynamic investigations on linear upscaling and optimization of floating offshore wind turbines. Ocean Engineering 287: 115728. http://doi.org/10.1016/j.oceaneng.2023.115728 Qin M, Shi W, Chai W, Fu X, Li L, Li X (2023) Extreme structural response prediction and fatigue damage evaluation for large-scale monopile offshore wind turbines subject to typhoon conditions. Renewable Energy 208: 450-464. http://doi.org/10.1016/j.renene.2023.03.066 Rezaee M, Fathi R, Jahangiri V, Ettefagh MM, Jamalkia A, Sadeghi MH (2021) Detection of damages in mooring lines of spar type floating offshore wind turbines using fuzzy classification and arma parametric modeling. International Journal of Structural Stability and Dynamics 21(8): 2150111. http://doi.org/10.1142/s021945542150111x Sant T, Buhagiar D, Farrugia RN (2018) Evaluating a new concept to integrate compressed air energy storage in spar-type floating offshore wind turbine structures. Ocean Engineering 166: 232-241. http://doi.org/10.1016/j.oceaneng.2018.08.017 Serio MA, Carollo FG, Ferro V (2019) Raindrop size distribution and terminal velocity for rainfall erosivity studies: A review. Journal of Hydrology 576: 210-228. http://doi.org/10.1016/j.jhydrol.2019.06.040 Sun Q, Li G, Duan L, He Z (2023) The coupling of tower-shadow effect and surge motion intensifies aerodynamic load variability in downwind floating offshore wind turbines. Energy 282: 128788. http://doi.org/10.1016/j.energy.2023.128788 Tang Z, Melville B, Singhal N, Shamseldin A, Zheng J, Guan D, Cheng L (2022) Countermeasures for local scour at offshore wind turbine monopile foundations: A review. Water Science and Engineering 15(1): 15-28. http://doi.org/10.1016/j.wse.2021.12.010 Wang Q, Liao K, Ma Q (2020) The influence of tilt angle on the aerodynamic performance of a wind turbine. Applied Sciences-basel 10(15): 5380. http://doi.org/10.3390/app10155380 Wang X, Cai C, Cai SG, Wang T, Wang Z, Song J, Rong X, Li Qa (2023) A review of aerodynamic and wake characteristics of floating offshore wind turbines. Renewable and Sustainable Energy Reviews 175: 113144. http://doi.org/10.1016/j.rser.2022.113144 Wang Y, Lin J, Duan H, Zhang J (2021) Investigation on thrust characteristics of a downstream offshore floating wind turbine under yawed inflow conditions. Journal of Marine Science and Engineering 9(11): 1215. http://doi.org/10.3390/jmse9111215 Wen B, Dong X, Tian X, Peng Z, Zhang W, Wei K (2018) The power performance of an offshore floating wind turbine in platform pitching motion. Energy 154: 508-521. http://doi.org/10.1016/j.energy.2018.04.140 Wu S, Sun H, Li X (2022a) Response of 5 MW floating wind turbines to combined action of wind and rain. Journal of Marine Science and Engineering 10(2): 284. http://doi.org/10.3390/jmse10020284 Wu S, Sun H, Zheng X (2022b) A numerical study on dynamic characteristics of 5 MW floating wind turbine under wind-rain conditions. Ocean Engineering 262: 112095. http://doi.org/10.1016/j.oceaneng.2022.112095 Wu X, Lu W, Wang K, Hu W, Fang J, Zha R (2024) Numerical study on aerodynamic performance of floating dual-rotor wind turbines in heave and surge motions. China Ocean Engineering 37(6): 1011-1021. http://doi.org/10.1007/s13344-023-0084-5 Xu B, Kang H, Shen X, Li Z, Cai X, Hu Z (2023) Aerodynamic analysis of a downwind offshore floating wind turbine with rotor uptilt angles in platform pitching motion. Ocean Engineering 281: 114951. http://doi.org/10.1016/j.oceaneng.2023.114951 Yang Y (2019) Discussion of "An improved k-ω turbulence model for the simulations of the wind turbine wakes in a neutral atmospheric boundary layer flow" by Ioannis Bouras, Lin Ma, Derek Ingham & Mohamed Pourkashanian. Journal of Wind Engineering & Industrial Aerodynamics 184: 458-459. http://doi.org/10.1016/j.jweia.2018.12.004 Ye Z, Wang X, Chen Z, Wang L (2020) Unsteady aerodynamic characteristics of a horizontal wind turbine under yaw and dynamic yawing. Acta Mechanica Sinica 36(2): 320-338. http://doi.org/10.1007/s10409-020-00947-2 Yu Z, Zheng X, Ma Q (2018) Study on actuator line modeling of two NREL 5-MW wind turbine wakes. Applied Sciences-basel 8(3): 434. http://doi.org/10.3390/app8030434 Zheng X, Yao Y, Hu Z, Yu Z, Hu S (2022) Influence of turbulence intensity on the aerodynamic performance of wind turbines based on the fluid-structure coupling method. Applied Sciences-basel 13(1): 250. http://doi.org/10.3390/app13010250
