
Hydrodynamic Behavior of a Trawl Codend and its Fluttering Motions in Flume Tank
https://doi.org/10.1007/s11804-025-00666-9
-
Abstract
This study experimentally investigates the hydrodynamic characteristics, geometric configurations, fluttering motions of the codend, and the instantaneous flow fields inside and around the codend, with and without a liner, under varying catch sizes and inflow velocities. A proper orthogonal decomposition method is employed to extract phase-averaged mean properties of unsteady turbulent flows from flow measurement data obtained using an electromagnetic current velocity meter inside and around the codend. The results reveal that as catch size increases, the drag force, codend motion, Reynolds number, and codend volume increase while the drag coefficient decreases. Owing to the codend shape and pronounced motion, a complex fluid-structure interaction occurs, demonstrating a strong correlation between drag force and codend volume. The oscillation amplitudes of the hydrodynamic forces and codend motions increase with increasing catch size, and their oscillations mainly involve low-frequency activity. A significant reduction in the flow field occurs inside and around the unlined codend without a catch. The flow field is 5.81%, 14.39%, and 27.01% lower than the unlined codend with a catch, the codend with a liner but without a catch, and the codend with both a liner and a catch, respectively. Fourier analysis reveals that the codend motions and hydrodynamic forces are mainly characterized by low-frequency activity and are synchronized with the unsteady turbulent flow street. Furthermore, the proper orthogonal decomposition results reveal the development of unsteady turbulent flow inside and around the codend, driven by flow passage blockage caused by the presence of the liner, intense codend motions, and the catch. Understanding the hydrodynamic characteristics and flow instabilities inside and around the codend, particularly those associated with its fluttering motions, is crucial for optimizing trawl design and improving trawl selectivity.Article Highlights• The impact of the catch size on the dynamic behaviour of trawl codends were examined.• A proper orthogonal decomposition method was developed to extract the phase averaged mean properties of turbulent flows.• Understanding the hydrodynamic and flow instabilities inside and around the codend is of great importance to optimizing the design of the optimal trawl structure and enhancing its selectivity. -
1 Introduction
The codend is the terminal and most critical part of the trawl, and it plays a vital role in the selectivity and storage of the fish catch. Its hydrodynamic force contributes approximately 15% of the total force acting on the trawl net (Madsen et al., 2015; Liu et al., 2021). To reduce juvenile fish mortality and enhance their escape rate, the selectivity of midwater and bottom trawls has garnered attention from the scientific community (Bouhoubeiny et al., 2011; McHugh et al., 2016). While previous studies have mainly focused on the relationship between mesh size and fish size to improve selectivity, they often overlooked the impact of turbulent flow, codend motion, and codend drag, which are the key factors influencing codend performance (O'Neill et al., 2005; Kim, 2013). The fluttering motion of the codend arises from the pressure exerted by both eddy flows and vortex shedding, which are directly associated with elastic, kinematic, and dynamic instabilities. These flows result from the presence of a liner within the codend, designed as a series of overlapping cones that produce a wavelike motion gently rippling with the water flow. Additionally, the catch restricts water flow through the codend, further contributing to these dynamic flows (Wardle, 1993; Liu et al., 2012; Underwood et al., 2016; Thierry et al., 2021a). This fluttering motion also alters the codend mesh openings, influencing both the hydrodynamic forces and the codend selectivity (Madsen et al., 2015; Druault and Germain, 2016).
Studying the motion of the codend is a challenging task in both simulations and experiments owing to various factors, including hydrodynamic forces, turbulent flow fields, and the fluttering motion of the codend. This topic has been explored in several studies, including those by Fuwa et al. (2003), Druault et al. (2015), Bouhoubeiny et al. (2011), Druault and Germain (2016), and Durgesh et al. (2014). One of the main sources of complexity is the inter action between the flexible codend structure, the unsteady turbulent flow, and the catch. This interaction is influenced by factors such as the large deformation of the codend, its oscillatory motions, fish behavior inside the gear, and the shape of the gear. These factors simultaneously influence the hydrodynamic forces acting on the codend (Bouhoubeiny et al., 2011; Thierry et al., 2021c). The turbulent flow surrounding the trawl codend generates vertical pres sure on the codend, leading to fluttering motions. These motions affect the mesh openings, which in turn influence the selectivity properties of the codend by altering the probability of fish escaping. In addition, such codend motions can impact the quality of the catch, as they may cause epidermal damage to the fish (Jones et al., 2008; Kim and Whang, 2010; Kim, 2013; Madsen et al., 2015; Brinkhof et al., 2021; Liu et al., 2021).
Recently, the dynamic behavior of the codend has been examined through numerical simulations, flume tank experiments, and sea trials. O'Neill et al. (2005) identified both catch pressure drag and codend motion as the primary com ponents of codend drag. Pichot et al. (2009) and Bouhoubeiny et al. (2011) studied the turbulent flow around the rigid codend structure via laser Doppler velocimetry (LDV) and particle image velocimetry (PIV) measurements. Their findings showed that the oscillatory motions of the codend strongly influenced the flow behavior around it, and they also demonstrated the presence of a symmetric vortex behind the codend. Kim (2012, 2013) conducted onepoint measurements inside codends, similar to those in shrimp beam and bottom trawls, confirming that the turbulent flow inside the codend structure affects the maneuverability of swimming fish. Priour (2014) developed a model of a codend composed of hexagonal mesh elements based on the approximation that codends were axisymmetric and that twines were elastic. Using this model, Priour and de la Prada (2015) determined that the shape and selectivity of the codend mainly depended on the catch's volume, the mesh's shape (diamond, square, or hexagonal), and the number of meshes along and around the codend. Madsen et al. (2015) evaluated the behavior of six codend designs with various mesh shapes to provide fundamental information that can improve both the selectivity and quality of the catch while also reducing energy consumption. They found that each codend oscillated considerably when loaded with fish, with the standard codend identified as the most stable of the six designs investigated. Druault and Germain (2016) used PIV to characterize the flow in the unsteady wake that develops behind the moving codend structure, as well as the frequency content of codend oscillations. Furthermore, they linked these data to the physical mecha nisms that induced oscillations. They found that local hydrodynamic effects, such as vortex shedding occurring in the wake zone around the codend, can lead to codend oscillations. More recently, Liu et al. (2021, 2023a, b) analyzed the effect of codend design parameters and the catch on the drag characteristics and fluttering motion of the codend. They found that the angle between the flow and the codend, as well as the height of the codend, were directly proportional to the inflow velocity. Thierry et al. (2021a, 2022a, 2023) identified the turbulent flow that developed inside and around different parts of bottom and midwater trawls. They also found that the velocity fields inside and around the codend were lower than the velocity fields observed in other parts of the trawl net.
Despite existing research, further experimental studies are needed to investigate the effect of catch size and the liner inside the codend on the fluid–structure interaction of fluttering codend structures. The interaction between unsteady flow and the fluttering motion of the codend makes this a complex problem. Therefore, to elucidate codend selectivity and the design of selective devices, it is crucial to address the current lack of detailed quantitative information on the coupled dynamics between a fluttering codend structure and its hydrodynamic behavior.
The present study designed a scaled and flexible codend structure, including a liner, based on a real fullscale flexi ble trawl codend used for Antarctic krill trawling. The model was tested in a flume tank under various catch sizes, with and without a liner, and different inflow veloci ties to analyze the interaction between the flow field and the fluttering codend structure. This analysis focused on hydrodynamic forces, fluttering motions, codend config uration, and the flow field both inside and outside the codend. Flow measurements were conducted using an electromagnetic current velocity meter (ECVM). Fast Fou rier transform (FFT) was employed to analyze the time frequency characteristics of the hydrodynamic forces and fluttering motions, as well as the proper orthogonal decomposition (POD) coefficients. In addition, POD was employed to examine the phase-averaged mean properties of unsteady turbulent flows as a function of structure motions, catch, and liner. The findings of this study pro vide a foundation for improving trawl net design and selectivity control.
2 Materials and methods
2.1 Experimental setup and codend design
The experiments were conducted at the Tokyo University of Marine Science and Technology in a flume tank measuring 9.0 m in length, 2.2 m in width, and 1.6 m in depth (for more details, see Hu et al., 2004, and Thierry et al., 2022a, 2022b).
The midwater trawl codend, commonly used in Antarctic trawl fisheries by the target fishing vessel "LONG TENG" of the China National Fisheries Corporation, was selected as the trawl design for this study (Figure 1). The trawl codend models were constructed with and without a liner, based on a modified version of Tauti's law, with a 1/20 length scale and a 1/5 scale for mesh size and twine diameter, respectively. In this study, the liner represents an inner-panel trawl designed as a series of overlapping cone assemblies inside the Antarctic krill trawl to prevent small organisms, such as Antarctic krill, from becoming tangled and to enhance catch efficiency. More details about the modified Tauti's law can be found in Hu et al. (2001) and Kumazawa et al. (2009). The codend models used in this study were constructed by assembling four pieces of nylon netting with diamond mesh. Figure 1 illustrates images of the codends during the flume tank tests, and Table 1 provides the details of the codend and liner parameters.
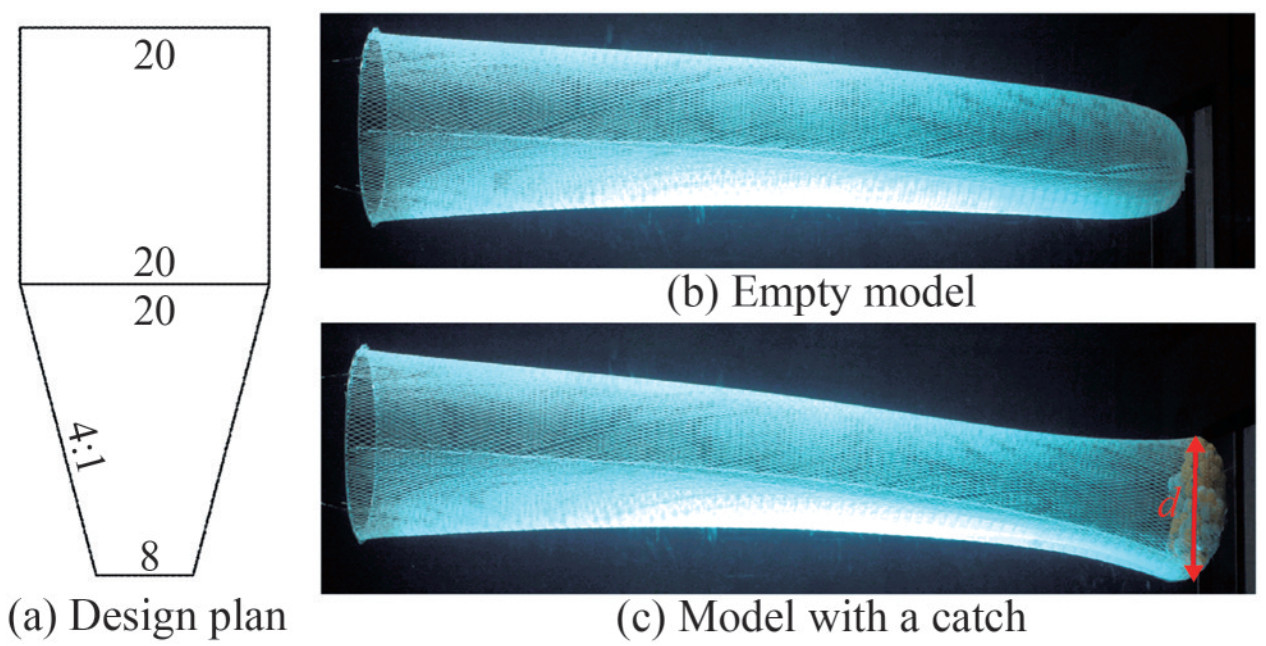 Figure 1 Physical model used in the testTable 1 Parameters of the codend and liner
Component Twine materials Mesh size (mm) Bar diameter (mm) Cutting ratio Cutting sequence Codend Part 1 Nylon 30 1.2 No cutting ration [N]22 Part 2 Nylo 30 1.2 4∶1 N [NBNBN]6 Liner Nylon 10 0.2 4∶1 N [NBNBN]6 The catches inside the codend were simulated using table tennis balls filled with water, as the water flow through the trawl codend model could be analogous to the behavior of a fullscale trawl codend during a sea trial (O'Neill et al., 2005; Zhang et al., 2023).
The diameter of each ball was 40 mm, and the weight of each ball was 2.7 g (Figure 1c). The mass of the water inside the ball was calculated as follows:
$$ M=\frac{4 \pi \rho r^3}{3} $$ (1) where ρ is the water density, r is the ball radius, and M is the mass of the water inside each ball. The catch weight was calculated as the sum of the empty ball weight and the weight of the water inside the ball. The resulting catch weights inside the codend are listed in Table 2.
Table 2 Characteristics of the catch in the codendCodend Number of balls Catch weight (kg) Codend with 0 ball 0 0 Codend with 50 balls 50 1.68 Codend with 100 balls 100 3.35 Codend with 150 balls 150 5.04 According to Zhang et al. (2023), table tennis balls filled with water were used as a simulated catch because the codend motions and the shape of the codend catch section closely match those observed in the sea with fish inside the codend, compared with other geometric configurations. Additionally, the flow passing through this section of the codend with tennis balls is similar to that in a full-scale codend in the ocean, as observed by O'Neill et al. (2005) and Kim (2013). However, no movement of the catch was observed during the experiments despite the sea conditions. The end part of the codend was assumed to be spherical, and the diameter of this sphere (d) was measured during the experiments, as illustrated in Figure 1(c). To analyze the effect of catch size on the hydrodynamic performance of the codend, as well as on the unsteady turbulent flow, the Reynolds number was calculated as a function of the codend diameter (Bouhoubeiny et al., 2011; Druault and Germain, 2016) and the inflow velocity u0:
$$ R e=\frac{u_0 d}{v} $$ (2) where u0 is the inflow velocity, ν is the kinematic viscosity, and d is the diameter of the end section of the codend. In this study, the diameters of the end section of the codend, measured during the experiments, were 10.47, 22.24, 26.28, and 30.45 cm for codends with 0, 50, 100, and 150 balls, respectively.
2.2 Description of drag measurement
To accurately measure hydrodynamic forces, the codend model was mounted on a circular rigid frame with a diameter of 36 cm and submerged in the flume tank to a depth of 10 cm (Figure 2). This circular rigid frame was connected to a six-component load cell with a capacity of 5 kgf each (Denshikogyo Co., Japan). The load cells were calibrated and zeroed at the beginning and end of each test, with their linearity verified. A current meter was positioned approximately 1.2 m upstream of the codend model to measure the flow velocity. In this experiment, the flow velocity varied from 50 to 90 cm/s in increments of 10 cm/s. Moreover, the temporal evolution of the drag force acting on the codend model for each inflow velocity was measured for different catch sizes (Table 1). The hydrodynamic force signals, measured using the load cell, were amplified with a dynamic strain amplifier (DPM-6H, Tokyo Measuring Instruments Co., Ltd., Japan). These signals, along with the flow velocity data, were transmitted to an A/D converter and then to a computer. The mean of 3 000 data points, obtained at a frequency of 50 Hz over 60 s, was recorded during the experiment, and the average value was calculated from the measurement data. The measurements were repeated three times for each inflow velocity. The water density of the flume tank was 999.8 kg/m3, and the water temperature was maintained between 17.6 ℃ and 18.4 ℃.
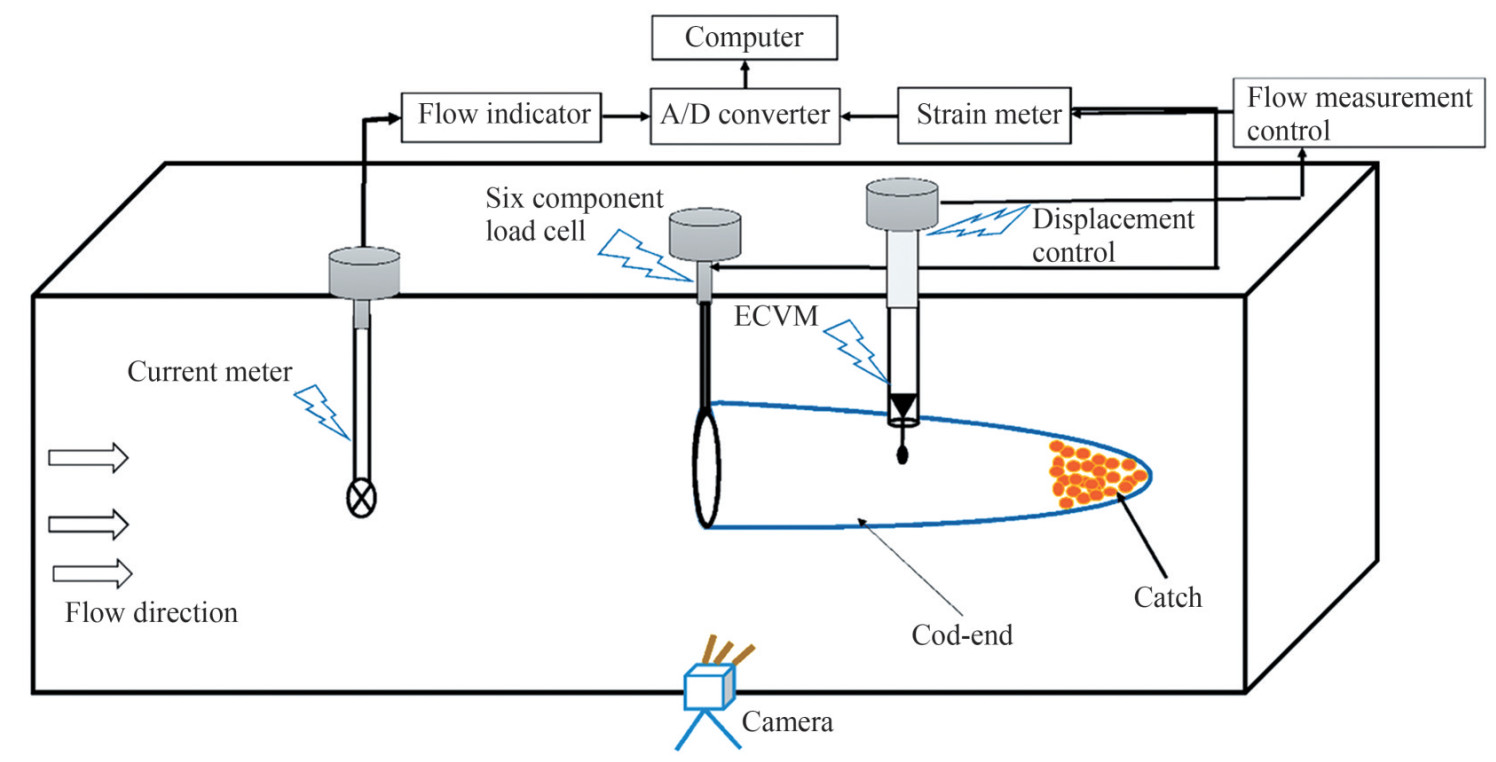 Figure 2 Schematic of the experimental setup used to measure the hydrodynamic forces, flow velocity, shape, and motion of the codend model
The drag coefficient was calculated based on the codend radius, as suggested by O'Neill et al. (2005), to assess the impact of the catch size on the hydrodynamic characteristics of the codend:
$$ C_d=\frac{F_D}{0.5 \rho \pi r^2 u_0^2} $$ (3) where Cd is the drag coefficient, FD is the drag force on the codend, r is the radius of the codend, and u0 is the inflow velocity.
2.3 Description of the measurement of the motion and shape of the codend
During the flume tank experiment, a series of videos cap turing the fluttering motion of the trawl codend was record ed using two video cameras (frequency: 59 Hz, resolution: 1 920 × 1 080 pixels2, manufactured by Dantec Hisense, with a 60 mm focal length). The cameras were positioned in front of and to the side of the flume tank with constant zoom (Figure 2). The codend motions were recorded for 3 min during each test, and a 60-second video segment was selected to extract the coordinates of different points on the codend. The inflow velocity used during the video recording was the same as that used for the hydrodynamic force measurements. The two-dimensional (2D) coordinates of the codend shape with different catches were extracted from the images using MATLAB R2014 and the GetData Graph Digitizer 4.0 software.
The codend motions were analyzed by selecting a series of images taken 0.25 s apart at a frequency of 4 Hz from the video footage. MATLAB was used to extract the coor dinates of various points on the codend within a plane-coordinate system. However, the accuracy of coordinate extraction was influenced by lens distortions, water refraction, and parallax. To mitigate these effects and calibrate the measurements, a standard bar was used. The coordinates of the points representing the shape of the codend were then interpolated, enabling the determination of the codend motions under different flow velocities. The FFT method was applied using Welch's approach, with a Hann window, to analyze the time history of the hydrodynamic forces on the codend and the time evolution of the codend motions. Further details about the method can be found in Torrence and Compo (1998), Farge (1992), Su et al. (2018), and Thierry et al. (2022a). A frequency resolution of 0.001 3 Hz was used for the analysis of the hydrodynamic forces and 0.017 Hz for the analysis of the codend motions.
2.4 Description of electromagnetic current velocity meter measurement
The instantaneous velocity vector fields inside and around the codend were measured in the symmetric plane using a two-component electromagnetic current velocity meter (ACM2-RS, JFE Advantech Co., Ltd., Hyogo, Japan) (Figure 2). The ACM2-RS is an electromagnetic induction ECVM with a maximum diameter of 34 mm and a length of 420 mm. The sensing components are cylindrical, with a diameter of 6 mm and a length of 163 mm, a specified accuracy of 0.5 cm/s (±2%), and a resolution of 0.1 cm/s (according to the manufacturer's specifications). Flow field measurements were conducted inside and around four flex ible codends under an inflow velocity of 50 cm/s. The four codends tested included an unlined codend without a catch, an unlined codend with a catch, an empty codend with a liner, and a codend with both a liner and a catch. The catch weight used in the experiment was 1.68 kg. The origin was placed at the endpoint of the codend along its central axis (Figures 3a and 3b). The flow direction was aligned with the x-axis, and the direction perpendicular to the water sur face was aligned with the z-axis (Figure 3a). In this config uration, the flow velocity inside and around the gear was defined relative to the top and side panels of the codend. These velocity fields consisted of two components: one along the longitudinal direction (u) and one along the trans verse direction (v). Seven points were spaced equidistantly between the endpoint of the codend and a point 120 cm along the x-axis. Along the y-axis, five points were posi tioned on one side of the water path, within 20 cm of the codend centerline (Figure 3b). Similarly, along the z-axis, five points were placed within 20 cm of the codend center line (Figure 3a). At each measurement point, the system recorded the mean of 800 data points, collected at a fre quency of 4 Hz over 200 s. These measurements were repeated three times to assess the repeatability of the results.
The data were post-processed to eliminate erroneous velocity readings and ensure a 2D velocity correlation value exceeding 95% between the two velocity components. Owing to the random motion of the codend structure and the limited number of instantaneous ECVM samples, in cases of completely unstable flow, each velocity field u(x, z, t) was instantaneously decomposed as follows:
$$ u(x, z, t)=u_m(x, z)+u^{\prime}(x, z, t), t=t_1, t_2, \cdots, t_{N t} $$ (4) 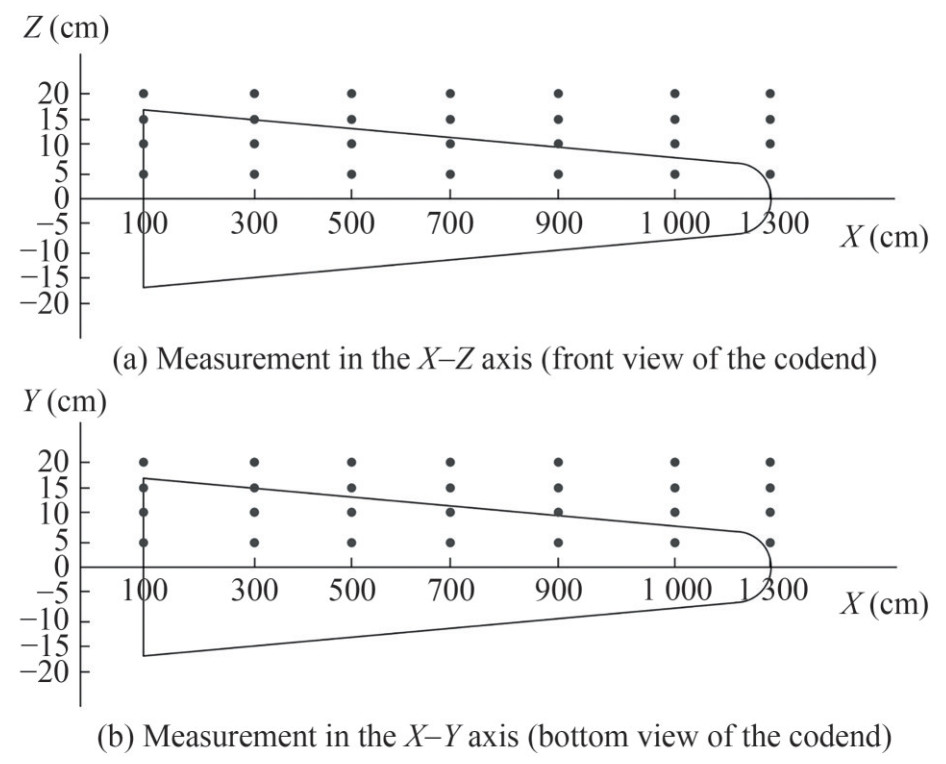 Figure 3 Schematic of the experimental setup for flow velocity measurement inside and around the codend. The black solid dots indicate the measurement points
where um and u' represent the mean velocity field and its associated fluctuating component, respectively.
The turbulent kinetic energy (TKE) can be expressed as follows:
$$ T_{\mathrm{ke}}=\frac{\overline{u^{\prime 2}}+\overline{v^{\prime 2}}}{2} $$ (5) where u' and v' represent the fluctuating components of the flow velocity in the u and v directions, respectively.
The velocity ratio can be calculated using the following expression:
$$ u_{\text {ratio }}=\frac{u_m(x, z)}{u_0} $$ (6) where
$$ u_m(x, z, t)=\left(u^2+v^2\right)^{0.5} $$ (7) Owing to the unsteady turbulent flow inside and around the codend, the flow velocity fields are analyzed using Reynolds averaging decomposition. The Reynolds stress tensor in the turbulent flow, denoted as τij, is given by:
$$ \tau_{x x}=\overline{u^{\prime 2}} $$ (8) $$ \tau_{y y}=\overline{v^{\prime 2}} $$ (9) $$ \tau_{x y}=\overline{u^{\prime} v^{\prime}} $$ (10) 2.5 Proper orthogonal decomposition
POD methodology is a powerful tool for data analysis. A key advantage of POD in turbulent flow analysis is its ability to provide a low-dimensional representation of tur bulent flows by extracting large-scale, energetic, coherent structures (Higham et al., 2018). POD was introduced by Lumley (1967) to identify these coherent structures within turbulent flows. This method relies on an energy criterion and involves determining a set of eigenmodes that can be used to reconstruct the flow signal (i.e., the flow velocity field). POD basis vectors are derived from the correlation tensor (either temporal or spatial) of the flow velocity. Depending on the correlation method used, two approaches can be employed: the classical approach and the so-called snapshot approach. In this study, the snapshot approach, introduced by Sirovich (1987), is applied. This method involves calculating the temporal correlations of the velocity fields as follows: $C\left(t, t^{\prime}\right)=\left\langle u(x, z, t) u\left(x, z, t^{\prime}\right)\right\rangle$, where "$\left\langle {} \right\rangle $" denotes the temporal correlation tensor. The next step is to solve the eigenvalue problem: Ca(n)(t) = λna(n)(t). Through this approach, a finite set of Nmod eigenvectors is obtained (where Nmod = Nt represents the number of POD modes). In the above expression, the eigenvectors a(n)(t) are referred to as the temporal coefficients of POD, while the eigenvalues λi represent the energy of the flow associ ated with the POD modes. The spatial modes, Φi(n)(x, z), are derived through the projection of the velocity fields onto the temporal coefficients corresponding to a(n)(t). Each fluctuating velocity component can then be repre sented as a linear combination of the deterministic modes, weighted by random coefficients:
$$ u_i^\prime (x,z,t) = \sum\nolimits_n {{a^{(n)}}} (t)\Phi _i^{(n)}(x,z) $$ (11) Equation (11) is used to reconstruct the velocity fields over a finite number of modes, N, which is selected based on the energy level to be represented (Druault et al., 2012; Bouhoubeiny et al., 2014). In this study, Reynolds decom position cannot be directly applied to determine the mean flow field owing to the unsteady nature of the flow. Instead, POD is applied to the instantaneous velocity fields to extract the mean flow fields from the velocity inside and around the fluttering codend. In this context, the POD modes are optimized to capture the total energy of the flow. This approach effectively captures the influence of the codend motion on the hydrodynamic turbulent flow that develops inside and around the codend structure.
3 Results
3.1 Analysis of the impact of catch size on the morphological and volume of the model trawl codend
The coordinates of the codend positions for different catch sizes and inflow velocities are illustrated in Figure 4. When the codend is empty, its shape widens with increas ing flow velocity, gradually tightening and approaching zero as the flow velocity decreases. However, the codend structure exhibits distinct upward trends when a catch is present. The inclination angle between the flow and the codend with a catch is greater than that of the codend with out a catch (Figure 4). This inclination angle increases with both catch size and inflow velocity. In general, both the inclination angle and the height of the codend endpoint are directly proportional to the inflow velocity and catch size.
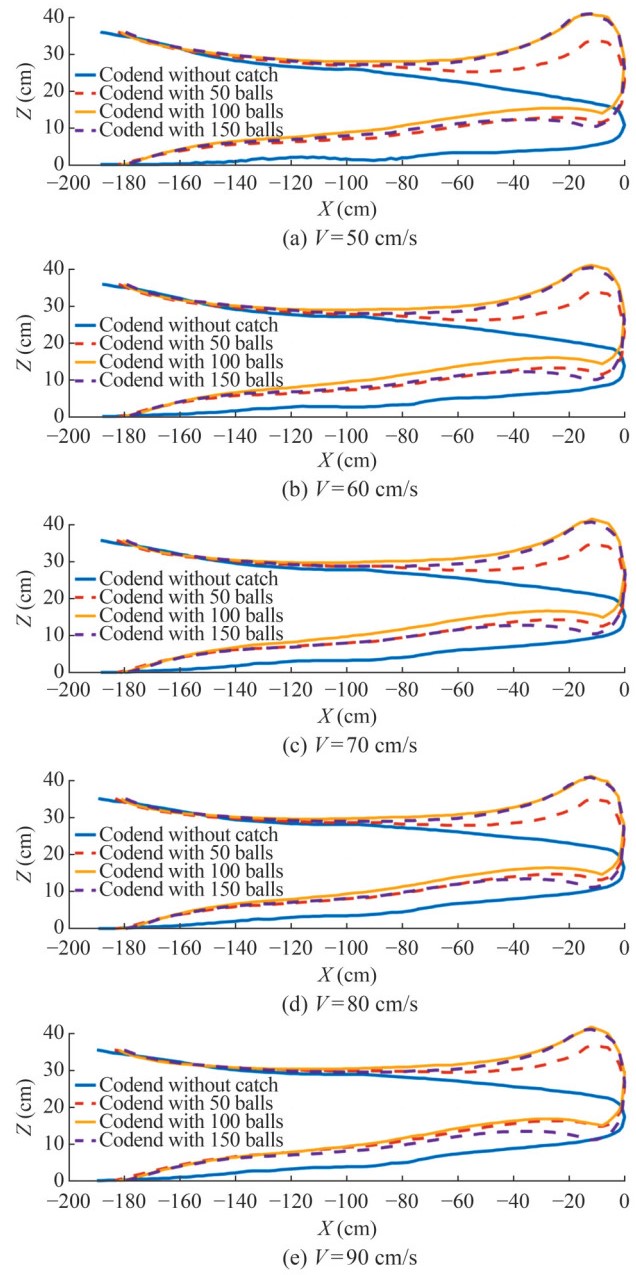 Figure 4 Variation of the codend profile with different catch sizes at various flow velocities (from 50 cm/s to 90 cm/s, top to bottom)
Figure 5 illustrates that the volume of the codend with out a catch is greater than that of the codends with catches. During the catch stage, the volume of the codend increases with the catch size. On average, the volume of the codend without a catch is 23.78%, 15.87%, and 10.61% larger than the volumes of the codends with 50, 100, and 150 balls, respectively. Additionally, the volume of all codends generally increases with the flow velocity.
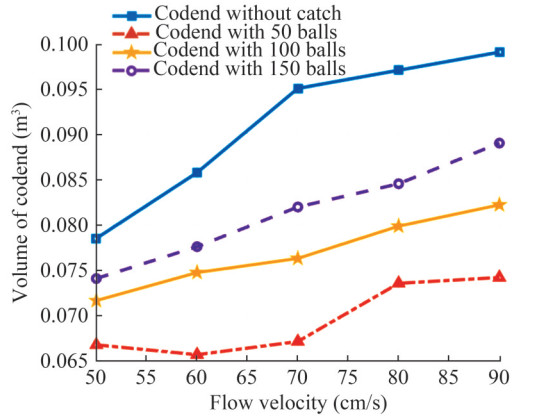 Figure 5 Volume of the codend model with different catch sizes at various inflow velocities
3.2 Influence of catch size and flow velocity on codend drag force
Figure 6 illustrates the drag force of the codend for dif ferent catch sizes at various flow velocities. The drag force of the codend without a catch oscillates continuously over time, while the drag force of the codends with a catch fluc tuates significantly (Figure 6). For the same catch size, the drag force at 50 cm/s is 32.05%, 51.88%, 62.75%, and 70.50% lower than the drag force at 60, 70, 80, and 90 cm/s, respectively. Furthermore, for a given flow velocity, the drag force for a catch size of 5.04 kg is approximately 44.93%, 23.92%, and 9.52% greater than the drag force for catch sizes of 0, 1.68, and 3.35 kg, respectively (Figure 6).
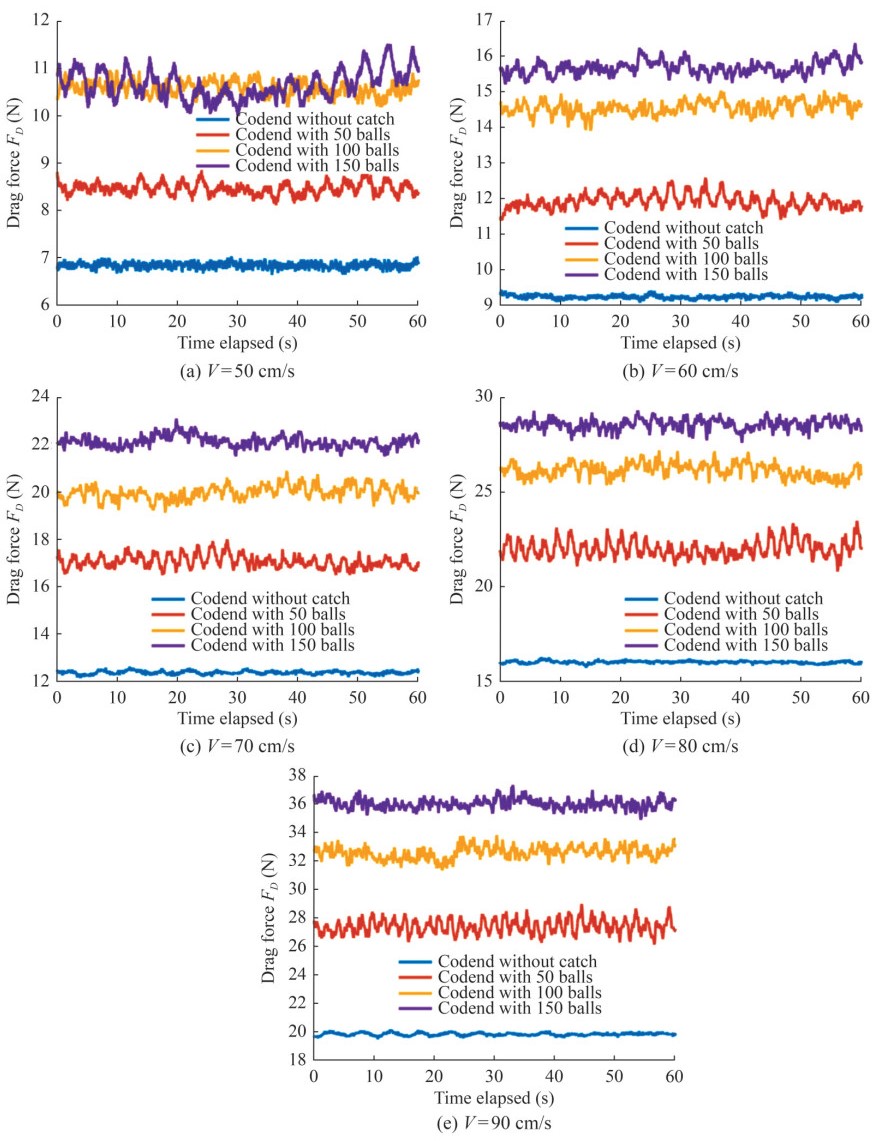 Figure 6 Time history of the codend drag force for different catch sizes at various flow velocities
The spectral content of the codend drag force oscillations is analyzed through the FFT method, using the database obtained from the drag force measurements at different catch sizes and flow velocities (Figure 7). The highest frequency peaks, representing the periodic drag force, is found at fre quencies ranging 0.032–0.037 Hz, 0.048–0.088 Hz, 0.043– 0.072 Hz, and 0.008–0.069 Hz for codends with catch sizes of 0, 1.68, 3.35, and 5.04 kg, respectively. The energy spec trum of the empty codend is 91.65%, 89.0%, and 98.71% lower than that of codends with 1.68, 3.35, and 5.04 kg of catch size, respectively (Figure 7). In addition, at the same catch size (5.04 kg), the highest frequency peak of the codend drag force occurs at the low frequencies of 0.04, 0.045, 0.008, 0.061, and 0.069 Hz for flow velocities of 50, 60, 70, 80, and 90 cm/s, respectively. An increase in flow velocity and catch size results in a higher energy spectrum, leading to greater fluctuations in the drag force (Figure 7).
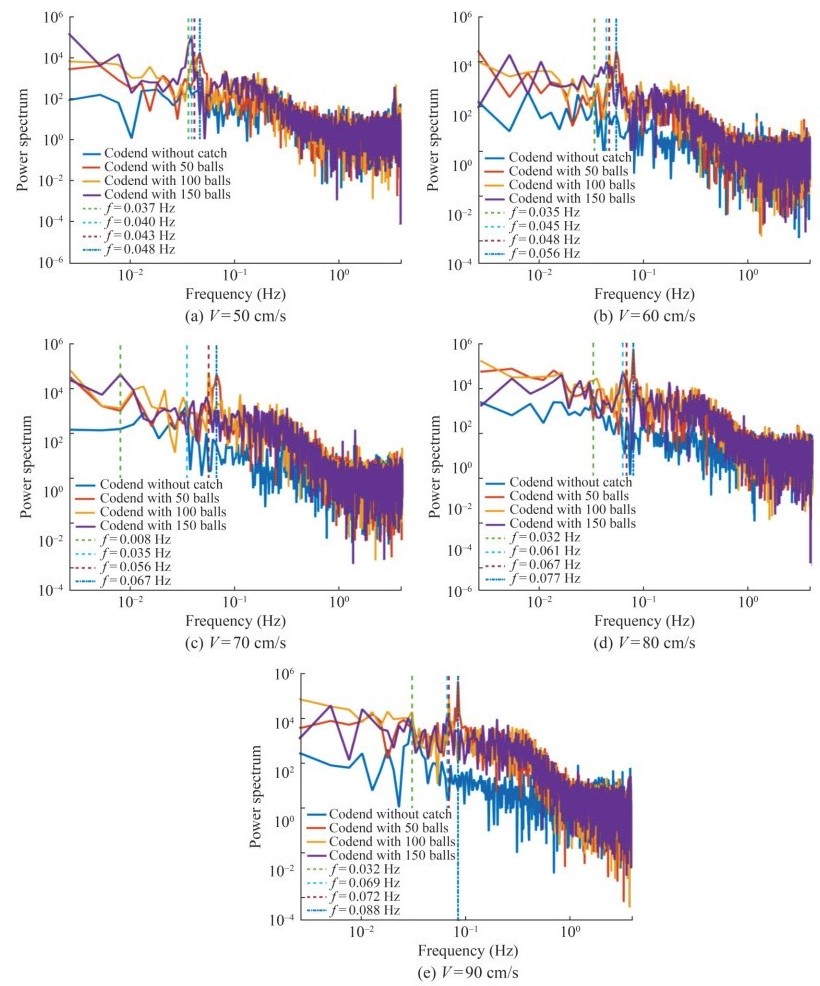 Figure 7 Normalized frequency spectrum of the codend drag force in log–log scale for different catch sizes
Figure 8 illustrates the drag coefficients of the four codends as a function of the Reynolds number. The Reyn olds number increases with both the catch size and the codend diameter, while the drag coefficient decreases as the catch size and codend diameter increase. On average, the drag coefficient of the codend without a catch is 39.36%, 47.82%, and 58.15% greater than those of the codends with 50, 100, and 150 balls, respectively. In contrast, the mean Reynolds number of the codend without a catch is 52.88%, 60.16%, and 65.62% lower than those of the codends with 50, 100, and 150 balls, respectively (Figure 8).
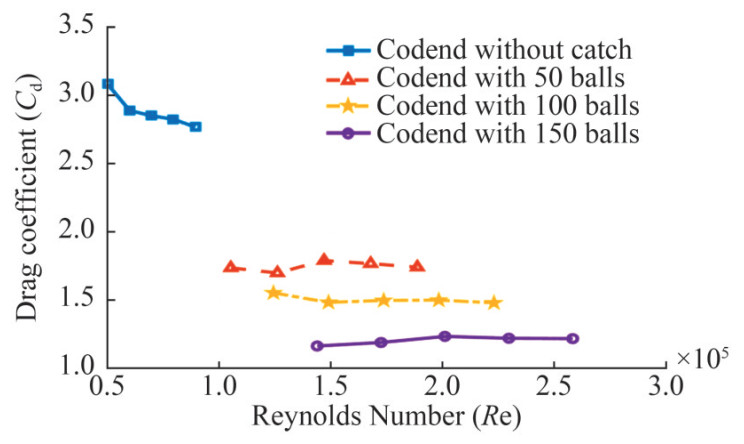 Figure 8 Drag coefficient as a function of Reynolds number calculated using codend diameter
3.3 Influence of catch size on the fluttering motions of the codend
Figure 9 illustrates the temporal evolution of the fluctu ating motions of the codend at inflow velocities of 50 and 90 cm/s. The motions in both directions are influenced by the catch size and exhibit quasi-periodic oscillations (Figure 9). The transverse motion of the codend increases with both catch size and inflow velocity, while the longitudinal motion decreases as the inflow velocity increases (Figure 9). The maximum amplitude of the transverse oscillations is 0.2, 0.61, 2.7, and 4.8 cm for the codend without a catch, and codends with 50, 100, and 150 balls, respectively. In contrast, the maximum amplitude of the longitudinal oscillations is 0.05, 0.3, 2.05, and 0.65 cm for the codend without a catch and codends with 50, 100, and 150 balls, respectively (Figure 9).
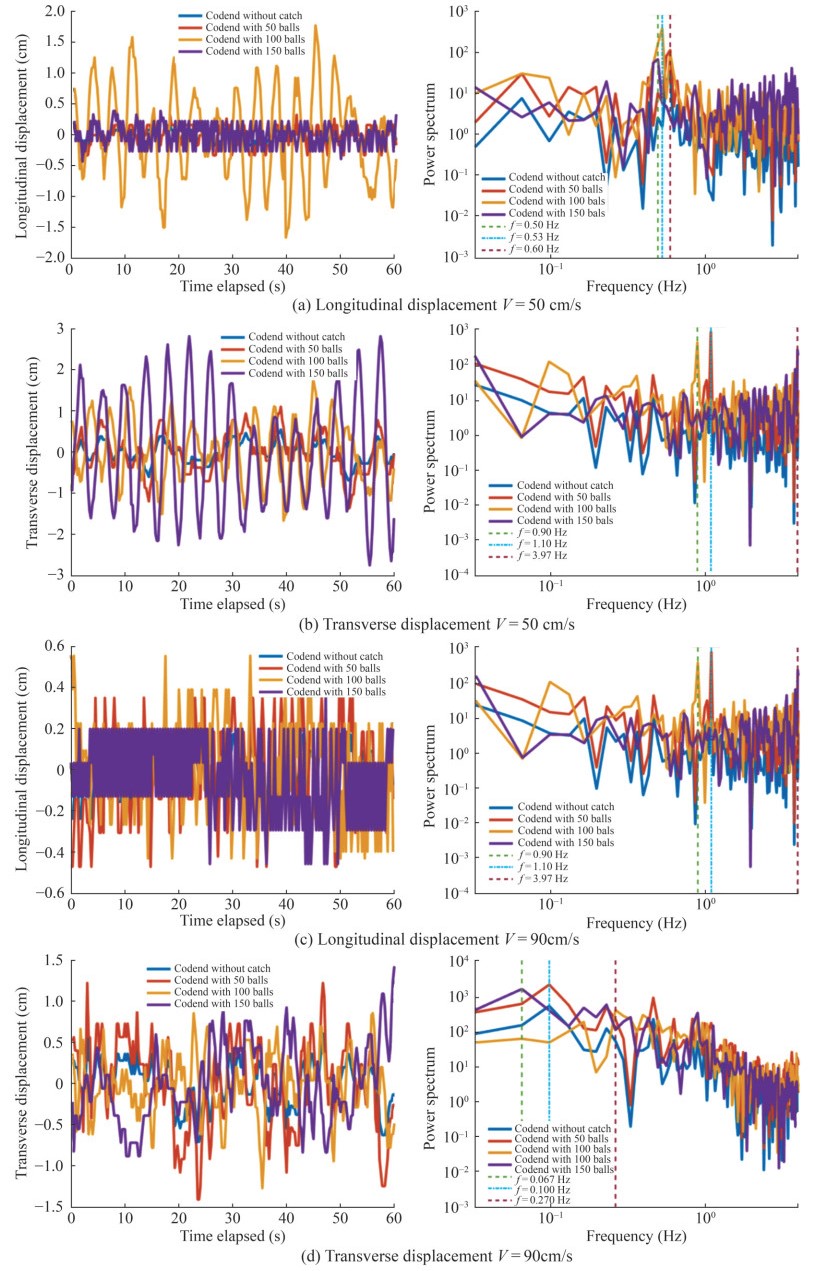 Figure 9 (Left) Time evolution of the longitudinal (a and c) and transverse (b and d) oscillations of the codend with different catch sizes at the lowest and highest flow velocities; (Right) Spectral representation of both longitudinal (a and c) and transverse (b and d) oscillations
To analyze the frequency content of both longitudinal and transverse oscillations, the FFT method is applied (Figure 9, right side). At an inflow velocity of 50 cm/s, the higher fre quency peaks for the longitudinal and transverse motions occur at frequency components of 0.53−0.6 Hz for codends with 0 and 50 balls and at 0.53 Hz and 0.5 Hz for the codends with 100 and 150 balls, respectively (Figures 9a, b). At 90 cm/s, the maximum power spectrum peaks for the longitudinal motion were found at 1.1 Hz for the codends with 0 and 50 balls and at 0.9 Hz and 3.97 Hz for the codends with 100 and 150 balls, respectively (Figure 9c). Furthermore, at 90 cm/s, the highest frequency peaks for the transverse motion occur at 0.1 Hz for the codends with 0 and 50 balls, and at 0.26 Hz and 0.066 Hz for the codends with 100 and 150 balls, respectively (Figure 9d). In general, the power spectrum of the codend motions increases as the catch size and inflow velocity increase.
3.4 Influence of catch size and liner on the mean flow properties inside and around the codend
3.4.1 Effect of catch size and liner on the instantaneous velocity field components measured by the electromagnetic current velocity meter
The analysis of instantaneous velocity components reveals flow velocity deficits caused by the spatial development of turbulent, unsteady flows inside and around different codends (Figure 10). The presence of the catch and liner inside the codend influences these unsteady turbulent flows. Specifically, the mean flow velocity inside and around the unlined codend without a catch is 14.39% and 27.01% greater than the mean flow velocities observed inside and around the codend with a liner and without a catch, as well as the codend with both a liner and a catch, respectively. In addition, the mean flow field inside and around the unlined codend with a catch is 5.81% lower than that inside and around the unlined codend without a catch (Figure 10). The turbulence in the codend wake is likely the primary cause of the unsteady turbulent flows that develop inside and around the codend. This turbu lence is more pronounced inside and around the unlined codend without a catch and the codend with both a liner and a catch (Figures 10a and 10b). Additionally, the pres ence of obstacles inside the codend, such as the liner, gen erates an eddy flow that contributes to the formation of these unsteady turbulent flows (Figure 10c). Finally, vor tex shedding, caused by the catch, creates additional resistance to the flow through the codend, leading to intense motion within the codend. Vortex shedding can be attrib uted to the lower flow speeds inside and around the end part of the codends (Figures 10b and 10d). As the flow moves closer to the end part of the codend, the flow velocity decreases further (Figure 10). Furthermore, the mean v is approximately 2.19%, 2.79%, 4.94%, and 4.61% of the mean u inside and around the unlined codend without a catch, the unlined codend with a catch, the codend with a liner and without a catch, and the codend with both a liner and a catch, respectively (Table 3).
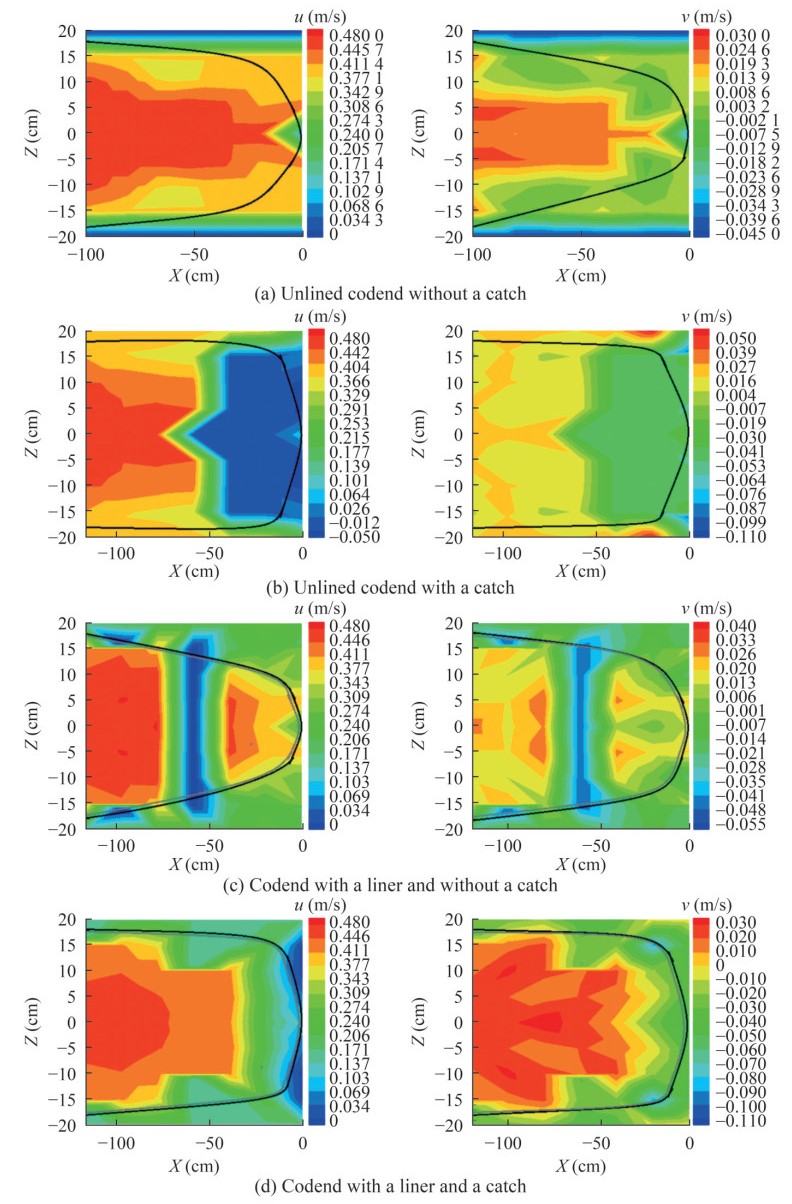 Figure 10 Flow velocity components in the longitudinal direction (u) and vertical direction (v) inside and aroundTable 3 Mean flow velocity components inside and around different codend types
Velocity components Unlined codend without a catch Unlined codend with a catch Codend with a liner and without a catch Codend with both a liner and a catch Inside u 0.35 ± 0.048 0.22 ± 0.055 0.21 ± 0.097 0.17 ± 0.047 v -0.0024 ± 0.0076 -0.022 ± 0.0087 -0.017 ± 0.0059 -0.029 ± 0.0067 Around u -0.29 ± 0.019 0.37 ± 0.055 0.31 ± 0.074 0.27 ± 0.011 v -0.048 ± 0.0036 0.0075 ± 0.0065 -0.0034 ± 0.00026 -0.017 ± 0.0046 Figure 11a illustrates the velocity ratio along the center line of different codends. For x < -80 cm, the velocity ratios inside the codends are nearly constant, with values of approximately 0.924, 0.897, 0.912, and 0.903 for the unlined codend without a catch, the unlined codend with a catch, the codend with a liner and without a catch, and the codend with both a liner and a catch, respectively. These ratios slightly increase and reach peaks of 0.941 at x = −20 cm, 0.901 at x = −80 cm, and 0.957 at x = −80 cm for the unlined codend without a catch, the unlined codend with a catch, and the codend with a liner and without a catch, respectively. For x > −20 cm, the velocity ratio inside the unlined codend without a catch decreases sharply, reaching a mini mum value of 0.196 at the end of the codend. In the unlined codend with a catch, the velocity ratio drops and reaches a minimum value of 0.112 in the middle of the structure before becoming constant. However, inside the codend with a liner and without a catch, the velocity ratio curve follows a parabolic shape in the range of −80 < x < −20 cm, with a minimum value of 0.1 at the center of the structure. Furthermore, in the wake zone inside the codend with both a liner and a catch (where −40 < x < 0 cm), the velocity ratio decreases to between 0.845% and 0.214% (Figure 11a).
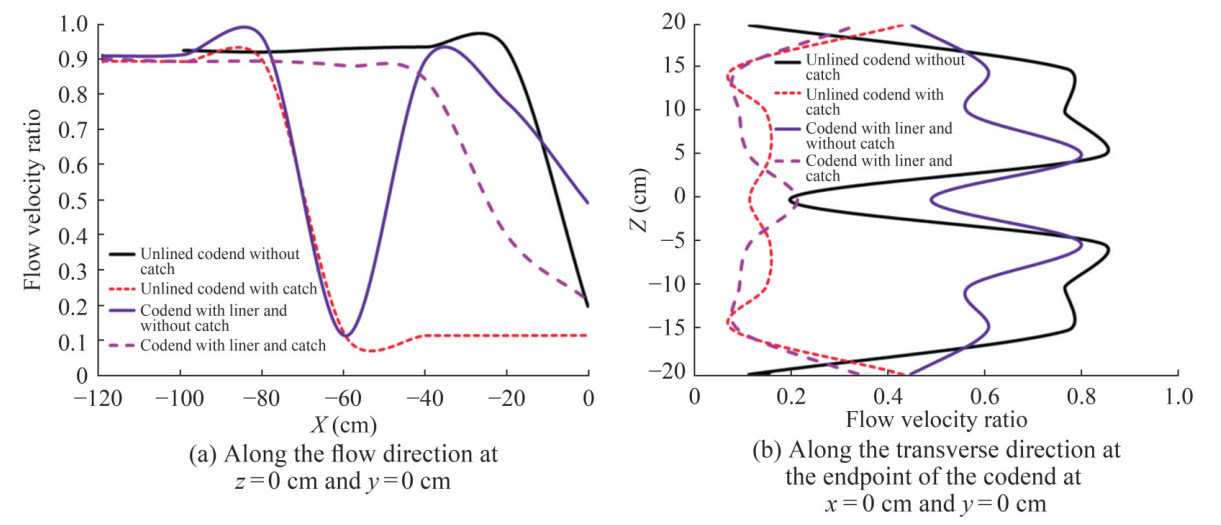 Figure 11 Flow velocity ratio for different codends along the flow direction and transverse direction
Figure 11b illustrates that the velocity ratio in the verti cal direction is highest at z = −20 cm and z = 20 cm for the codend with a catch. In contrast, for the codend without a catch, a high value is observed in the range −5 < z < 0 cm and 0 < z < 5 cm. The results also indicate that the velocity reduction reaches its maximum at z = 0 cm for all codends, except for the codend with both liners and catch, suggest ing that the wake zone is particularly significant at this point (Figure 11b).
3.4.2 Reynolds stress tensor
The results indicate that u'2 and v'2 are higher on the upper and lower sides of the unlined codend without a catch, as well as in the middle of the codend (Figure 12a). In contrast, u'2 is higher and v'2 is lower inside and around the end part of the unlined codend with a catch (Figure 12b). For codends with a liner, both u'2 and v'2 are higher in the front and middle sections inside the codend, with the Reynolds normal stress components decreasing closer to the end part (Figures 12c and 12d). The Reynolds stress shear component u'v' follows a similar trend to u'2 but exhibits two regions with opposite signs, located on either side of the wake region in codends with liners (Figures 12c and 12d). The Reynolds stress shear component u'v' ranges from −0.000 07 to 0.011 6, from −0.005 7 to 0.029, from −0.001 4 to 0.13, and from −0.004 to 0.016 m2/s2 inside and around the unlined codend without a catch, the unlined codend with a catch, the codend with a liner and without a catch, and the codend with both a liner and a catch, respec tively (Figure 12). In addition, the relationship between the normal Reynolds stress components follows u'2 > v'2 and u'v' ≠ 0, confirming the unsteady turbulent nature of the flow around the codend structure.
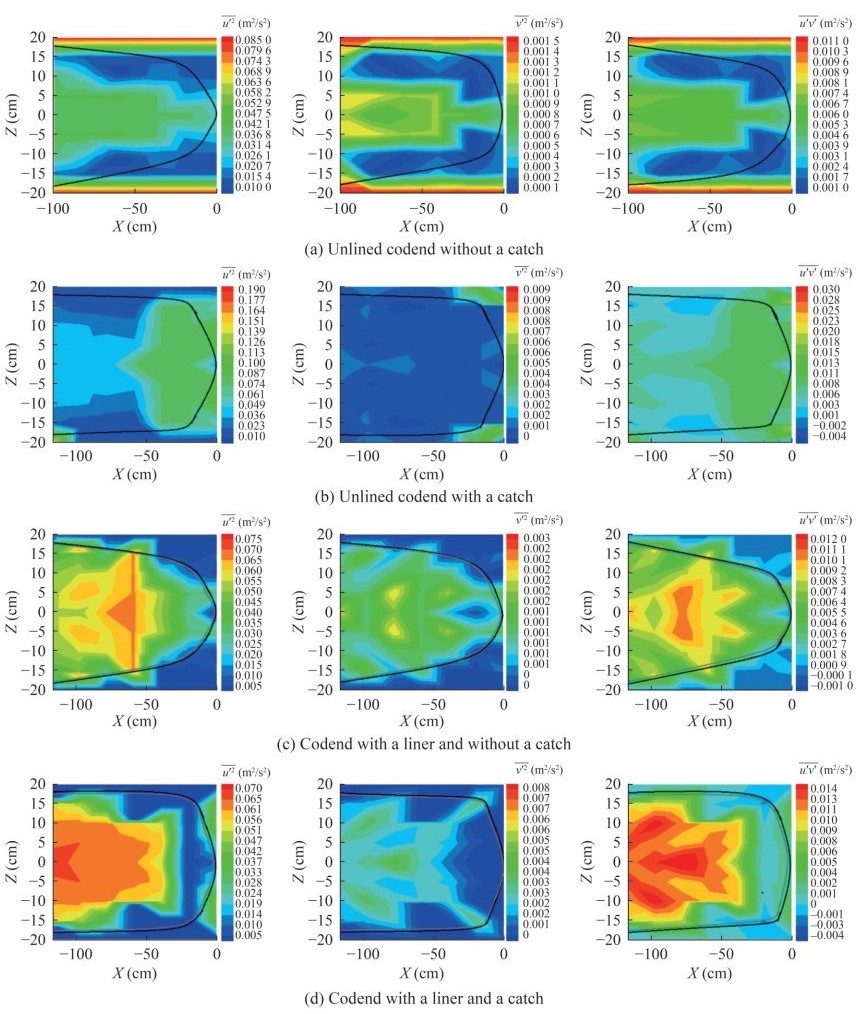 Figure 12 Reynolds stress tensor components of the flow field inside and around (from left to right: u'2, v'2, and u'v', respectively)
3.4.3 Turbulent kinetic energy
The TKE increases as the mean flow velocity rises (Figure 13). For the unlined codend without a catch, the TKE inside the codend is 40.86% lower than the TKE out side the codend (Figure 13a). For the unlined codend with a catch, the TKE increases as it approaches the end part of the codend. The TKE inside and around this codend varies from 0.000 123 to 0.102 m2/s2 (Figure 13b). In contrast, inside the codend with a liner, TKE is higher at the front part and decreases as both transverse and longitudinal coordinates increase (Figures 13c and 13d). On average, the unlined codend without a catch exhibits higher TKE than the other tested codends. Specifically, the TKE inside and around the unlined codend without a catch is 3.52%, 36.15%, and 42.52% greater than the TKE in the unlined codend with a catch, the codend with a liner and without a catch, and the codend with both a liner and a catch, respectively.
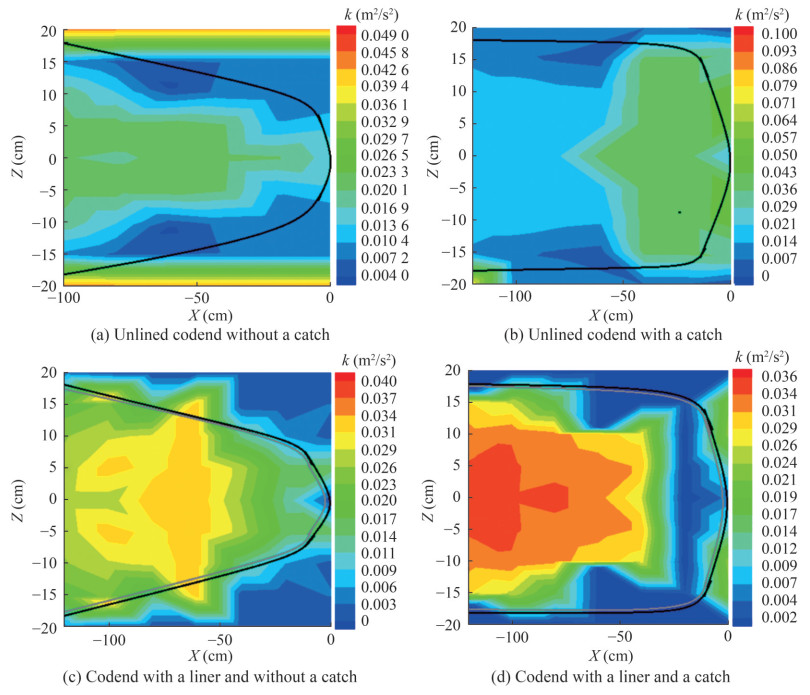 Figure 13 Turbulent kinetic energy inside and around the different codends
3.5 Proper orthogonal decomposition analysis of the electromagnetic current velocity meter velocity field
3.5.1 Proper orthogonal decomposition energetic content analysis
The POD energetics and energy content of the first 20 POD modes are analyzed, and the results are illustrated in Figure 14. In the first mode, the POD energy content inside the unlined codend without a catch is greater than that of the other codends; specifically, it is 16.66%, 33.33%, and 48.34% higher than the POD energy contents inside and around the unlined codend with a catch, the codend with a liner and without a catch, and the codend with both a liner and a catch, respectively. The first POD eigenvalues account for approximately 99.28%, 98.71%, 98.93%, and 97.77% of the total energy inside and around the unlined codend without a catch, the unlined codend with a catch, the codend with a liner and without a catch, and the codend with both a liner and a catch, respectively (Figure 14b and Table 4). The presence of the catch and liner inside the codend leads to a decrease in the POD energy through the codend, resulting in a more unsteady turbulent flow. The second and third POD eigenvalues for the unlined codend without a catch are 38.48%, 4.85%, and 43.81% lower than those for the unlined codend with a catch, the codend with a liner and without a catch, and the codend with both a liner and a catch, respectively (Table 4). Therefore, through the analy sis of the first two POD modes, information on the domi nant energetic phenomena of the turbulent flow can be ex tracted, while the third POD mode is associated with the codend motions.
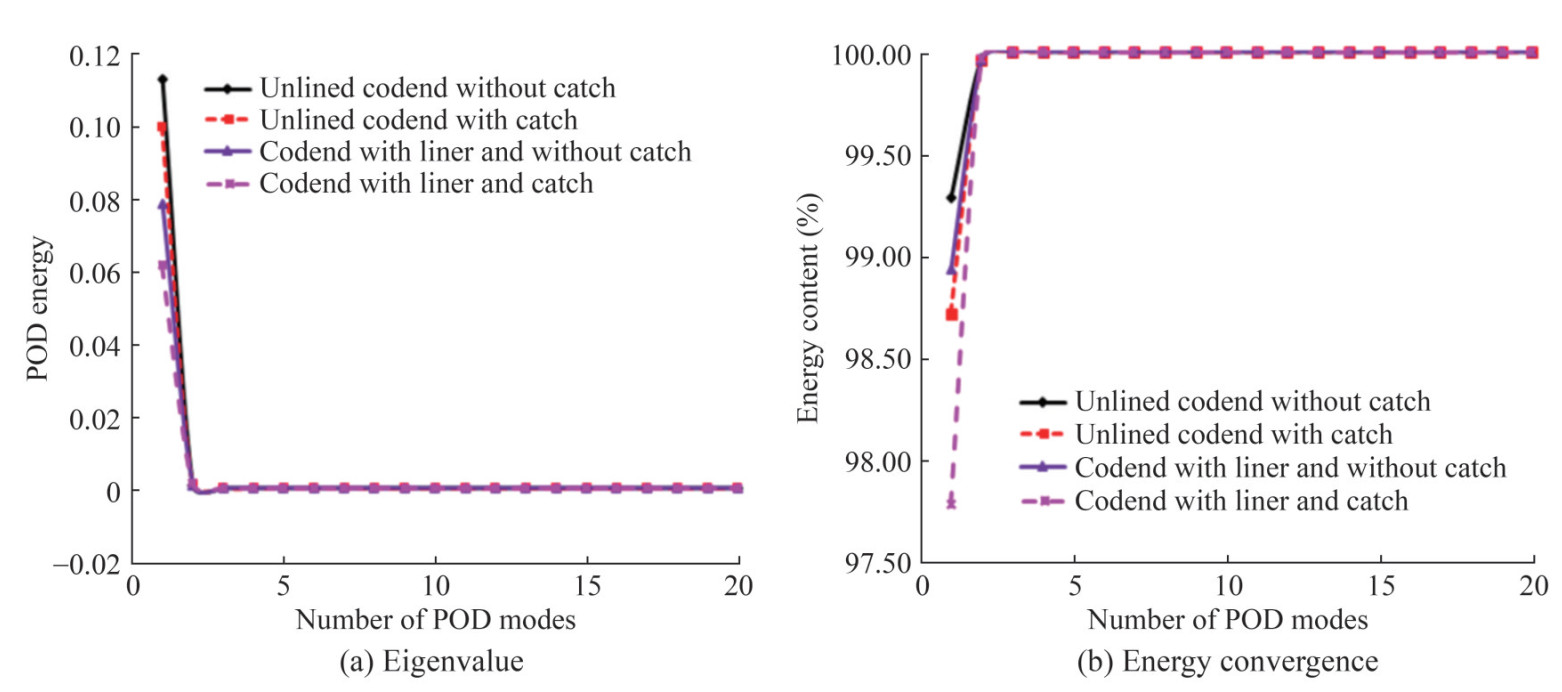 Figure 14 POD energy distribution inside and around codendsTable 4 Kinetic energy content of the first three proper orthogonal decompositions (POD) modes
% POD modes Unlined codend without a catch Unlined codend with a catch codend with a liner and without a catch Codend with both a liner and a catch 1st mode 99.28 98.71 98.93 97.77 2nd mode 0.68 1.25 1.03 2.21 3rd mode 0.041 0.043 0.045 0.037 3.5.2 Spatial shape of proper orthogonal decomposition
Figure 15 illustrates the first four spatial POD modes obtained for the four tested codends. The spatial modes Φu(1) and Φu(2) exhibit paired structures with inverse shapes. These modes are closely associated with the high energy content of the first two POD modes, accounting for approximately 99.97% of the total energy. This suggests the presence of periodic unsteady turbulent flow behavior with distinct phases in these two modes. Furthermore, the topology of these modes, characterized by regions with negative val ues, highlights the occurrence of unsteady flow around the codends. For the unlined codends, such unsteady flow is observed both within the codend and at its terminal section (Figures 15a and 15b). For codends with liners, the spatial topology indicates the presence of unsteady turbulent flow resulting from flow blockage (Figures 15c and 15d). These first two modes demonstrate the advection of the codend driven by turbulent structures across all configurations. In addition, the modes Φu(3) and Φu(4) are paired but feature a similar structure to the structure of Φu(1) in the unlined codend without a catch (Figures 15a and 15c). For codends with catches, these modes exhibit a disrupted structure (Figures 15b and 15d). The amplitude of the first spatial POD mode is approximately 96.66%, 79.43%, 87.2%, and 77.42% greater than the amplitudes of the other three spa tial POD modes for the unlined codend without a catch, the unlined codend with a catch, the codend with a liner and without a catch, and the codend with both a liner and a catch, respectively.
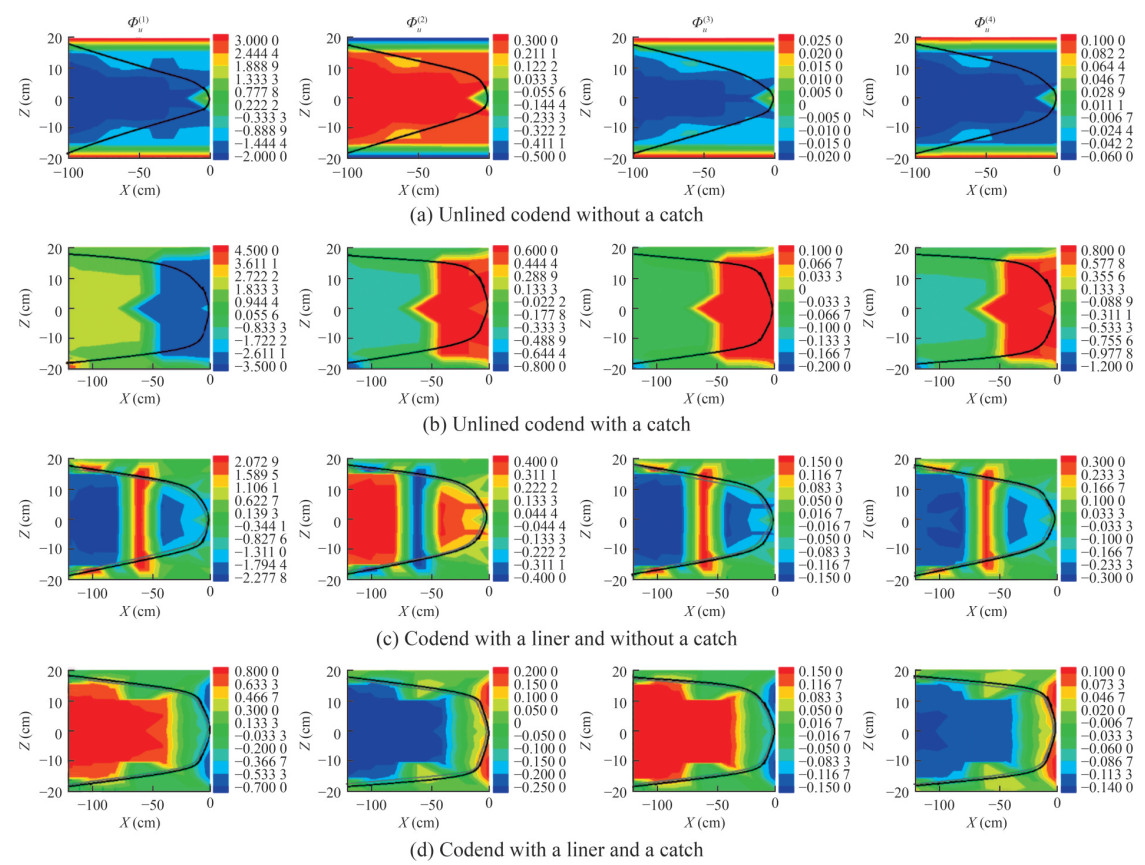 Figure 15 Spatial POD modes inside and around. From left to right: Φu(1), Φu(2), Φu(3), and Φu(4)
3.5.3 Temporal coefficient of proper orthogonal decomposition
Figure 16 illustrates the temporal evolution of the first three POD modes and their corresponding spectra derived from the ECVM measurement database for all codends. The first POD coefficients display a sinusoidal temporal pattern with nonperiodic fluctuations, likely associated with unsteady turbulent flow phenomena. For the codends without a catch, the temporal evolution of the first POD mode exhibits oscillations with an amplitude approximately half that of the POD coefficients for the second and third modes (Figures 16a and 16c). In contrast, the oscillations of the POD coefficients for the first three modes inside and around the codends with catches are nearly in phase, with a phase difference of less than 5% (Figures 16b and 16d). The maximum amplitude of the temporal evolution of the first POD mode for the unlined codend without a catch is 0.26, which is 44.68%, 16.12%, and 46.93% greater than the maximum amplitudes observed for the unlined codend with a catch, the codend with a liner and without a catch, and the codend with both a liner and a catch, respectively.
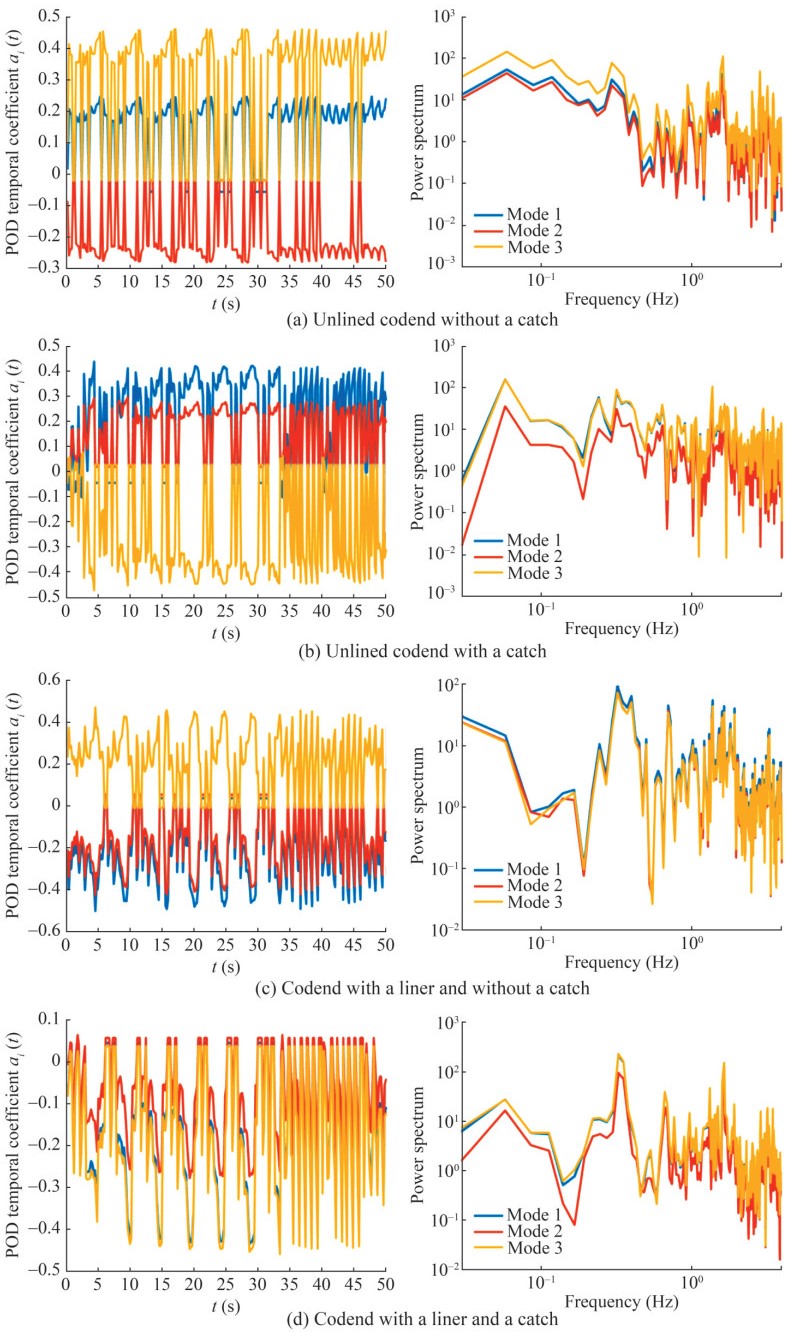 Figure 16 Time evolution of the first three POD coefficients (left) and the corresponding Fourier power spectrum obtained via the FFT method (right)
The spectrum associated with the POD temporal coefficients (shown on the righthand side) highlights frequency peaks in the Fourier power spectra at 0.059 Hz for mode 3, 0.046 Hz for modes 1 and 3, 0.28 Hz for mode 1, and 0.31 Hz for modes 1 and 3, corresponding to the unsteady turbulent flow inside and around the unlined codend without a catch, the unlined codend with a catch, the codend with a liner and without a catch, and the codend with both a liner and a catch, respectively. These low frequencies are comparable to those characterizing the time evolution of transverse motion in all codends.
3.6 Phaseaveraged mean properties of unsteady turbulent flow inside and around different codends obtained via proper orthogonal decomposition extraction
A POD-averaged operator is applied to the ECVM data corresponding to the measurement planes inside and around the different codends based on the results of the POD analysis. The phase-averaged mean properties of the unsteady turbulent flow are derived from the instantaneous flow velocity field projected onto the first two POD modes, as follows:
$$ u_m(x, z, t)=\sum\limits_{n=1}^2 a(t)^{(n)} \varPhi_u^{(n)} $$ (12) Figure 17 confirms the presence of unsteady turbulent flow in the codend wake inside and around these structures, attributed to the fluttering motions of the codend. For the unlined codend without a catch, this turbulent flow is likely composed of boundary layer flow, influenced by the pres ence of different layers inside and around the codend (as indicated by varying colors), as well as vortex shedding at the codend end, driven by very low flow velocities (um(x, z, t) /u0 = 0.27) (Figure 17a). In the case of the codend with a catch, the turbulent flow consists of a wake-induced turbulent flow and vortex shedding (−60 < x < 0 cm) at the end part of the codend, again caused by very low flow velocities (um(x, z, t) /u0 = 0.16) (Figures 17b and 17c). In addition, the phase-averaged mean flow velocity confirms the presence of eddy flow in the middle of the codend and around the structure. This eddy flow is caused by flow blockage owing to the liner and its wave motion (−60 < x < 0 cm with (um(x, z, t) /u0 = 0.19) (Figure 17c).Furthermore, the phase-averaged mean flow velocity fields derived using Eq. (13) align with those obtained through ECVM measurements, validating the applicability of the POD method to the ECVM database.
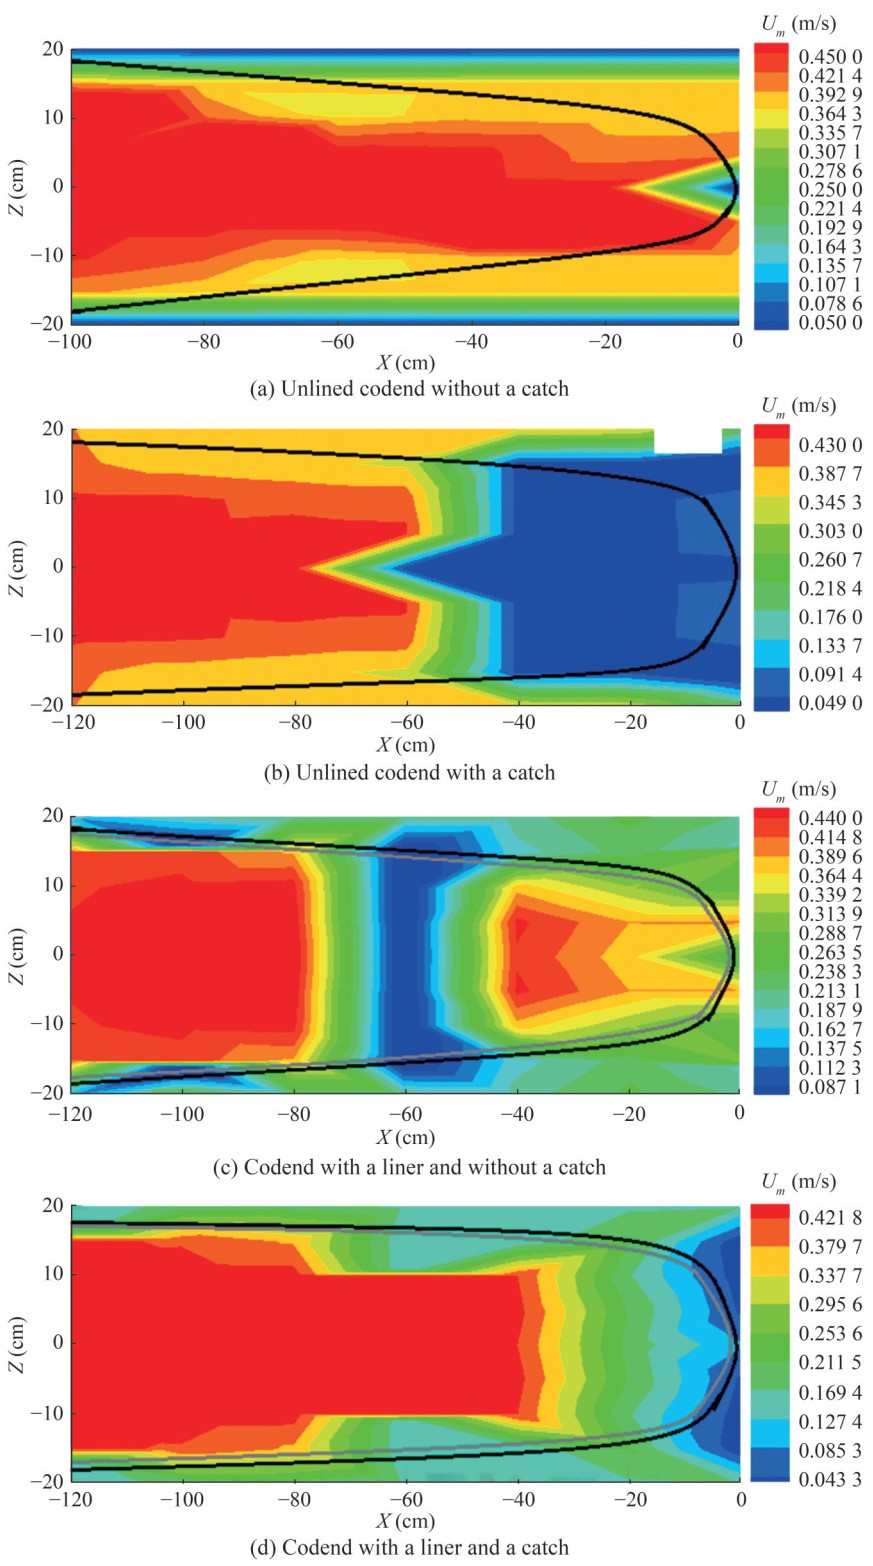 Figure 17 Phase-averaged mean velocity inside and around the different codends
Figure 18 illustrates the time evolution of Um(x, z, t) at a point near the end of the codend, along with its Fourier content. Each time representation is superimposed on the transverse oscillations of the codend. The spectrum is plotted as a function of the Strouhal number:
$$ S t=\frac{f d}{u_0} $$ (13) 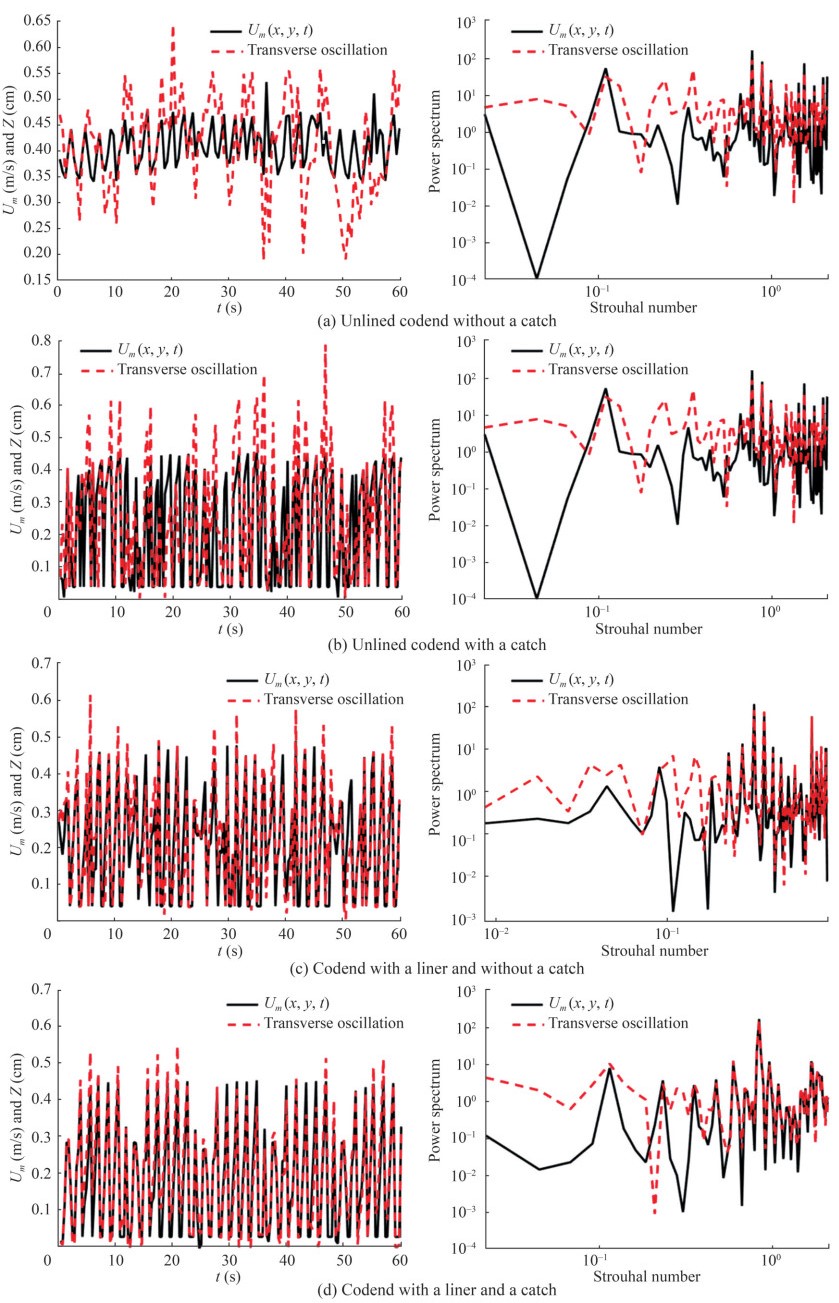 Figure 18 Time evolution of the phase-averaged mean velocity at a point
where St is the Strouhal number, f is the frequency, and d is the codend diameter.
The phase-averaged mean flow velocity fields exhibit the same oscillatory behavior as the transverse motion of the codend (Figure 18), confirming that codend motions considerably influence the flow passage through the struc ture. During the computation of the temporal evolution of the phase-averaged mean flow velocity for each signal and each codend um(x, z, t), the following order is obtained: um (for the codend with both a liner and a catch) < um (for the codend with a liner and without a catch) < um (for the unlined codend with a catch) < um (for the unlined codend without a catch). This trend occurs because the velocity reductions inside the codend with both a liner and a catch are greater than those inside the other codends. The Fourier spectrum displays peaks corresponding to Strouhal num bers of 0.12, 0.77, 0.31, and 0.85 inside and around the unlined codend without a catch, the unlined codend with a catch, the codend with a liner and without a catch, and the codend with both a liner and a catch, respectively. These values of St are associated with low-frequency turbulence flow.
4 Discussion
Analyzing the fluid–structure interaction of the trawl codend structure is complex yet essential for improving the efficiency of midwater and bottom trawls. This optimization is crucial for ensuring profitability, promoting resource sustainability, reducing fuel consumption, and enhancing bycatch selectivity. This study demonstrates that catch size and liner type influence variations in drag, the interaction between the motions of the fluttering codend and the unsteady turbulent flow, shear layer instabilities, and the unsteady turbulent flow that develops inside and around the codend. The findings from this study, in conjunction with previous research by O'Neill et al. (2005), Bouhoubeiny et al. (2011), Maldsen et al. (2015), Priour and Prada (2015), and Thierry et al. (2023), highlight that catch size and the liner affect codend motion, thereby altering the shape of the codend. This modification restricts the flow passage through the codend, resulting in the development of a large unsteady turbulent flow. This flow, in turn, affects the hydrodynamic forces acting on the codend and influences catch selectivity. According to the findings of this study, the primary factors that impact the interaction between the codend structure and the unsteady turbulent flow inside and around the codend include codend oscillation, inflow velocity, the wave motion of the liner, mesh opening, and catch size. Additionally, the motion of the fishing vessel and natural underwater currents can also affect this interaction during fishing operations at sea (O'Neill et al., 2003; Kim, 2012, 2013).
This study demonstrates that the drag on the codend is influenced by catch size, inflow velocity, and the motions of the codend. During the experiment, as the catch size increases from 0 kg (no balls) to 5.04 kg (150 balls), the drag on the codend increases from 6.82 N to 10.64 N at the lowest flow velocity, representing a rise of over 35.91%. At the highest flow velocity, the drag ranges from 19.85 N to 36.07 N, an increase of more than 44.97%. As both catch volume and flow velocity increase, the drag also increases. This leads to an amplification of the transverse motion of the codend and the development of unsteady turbulent flow inside and around it. This phenomenon is attributed to the transverse and longitudinal motions, which consider ably alter the mesh opening and reduce the flow passage. Consequently, the development of unsteady turbulent flow inside and around the codend increases drag and affects the physiology and behavior of fish. This phenomenon has been confirmed in various studies by O'Neill et al. (2005), Bouhoubeiny et al. (2011, 2014), Madsen et al. (2015), Liu et al. (2021), and Thierry et al. (2021a) Moreover, the accumulation of catch in the codend, which blocks the mesh opening and deforms the codend shape, explains the increase in drag associated with higher catch volumes (O'Neill et al., 1997, 2005). This blockage and deformation disrupt the free flow of water through the codend, resulting in energy exchange phenomena. These phenomena lead to unsteady turbulent flow in the codend wake, significantly increasing the water pressure exerted on the trawl. The increase in water pressure due to unsteady turbulent flow affects both the codend drag and the overall trawl drag (Thierry et al., 2021a, 2021c, 2022a). As the flow velocity and catch volume increase, the codend drag also increases, leading to higher drag coefficients. This trend has also been reported by O'Neill et al. (2005), Zang et al. (2012), and Liu et al. (2021, 2023a, b), who observed an increase in codend drag with higher catch volumes. In the present study, the drag force of the codend without a catch is lower than that of the codend with a catch owing to reduced oscillations in the latter. This finding is consistent with the results of previous studies on rigid codends (Pichot et al., 2009; Bouhoubeiny et al., 2011). Another reason for the significant difference in drag between codends with and without a catch is that the catch substitutes (in this case, water-injected table tennis balls) block the direct flow of water through the mesh, thereby generating turbulent flow at the end of the codend. This turbulent flow creates vertical pressure on the codend, causing fluctuations in the hydrodynamic force acting on it (O'Neill et al., 2005; Jones et al., 2008; Thierry et al., 2021b).
The catch inside the codend determines its porosity and, consequently, affects the drag coefficient. To evaluate the effect of catch size on the codend drag, the diameter of the codend (i. e., the diameter of the catch zone) is used to calculate both the Reynolds number and drag coefficient (O'Neill et al., 2005; Druault and Germain, 2016). The codend drag coefficients at catch sizes of 0, 1.68, 3.35, and 5.04 kg are 2.77–3.09, 1.71–1.79, 1.48–1.55, and 1.17– 1.23, respectively. The drag coefficient of the empty codend is greater than that of the codend with a catch because the projected area of the empty codend is approximately 54.43%, 67.42%, and 75.73% smaller than that of the codend at catch sizes of 1.68, 3.35, and 5.04 kg, respectively. The present study demonstrates that drag coefficients decrease with increasing catch size. This reduction in drag coefficient results from the larger catch size, which leads to a larger codend diameter and, consequently, an increase in the codend area (O'Neill et al., 2005). The estimated drag coefficient for the codend without a catch is consistent with the values reported by Tang et al. (2018, 2022a) and Thierry et al. (2021b) for the netting, by Nepali et al. (2020) for two square cylinders in a tandem arrangement, and by Bi et al. (2020) for plane nets fouled by hydroids. However, the estimated drag coefficient differs from those obtained by Liu et al. (2021) for the empty codend and by Thierry et al. (2020a). This difference mainly occurs because, in the present study, the drag coefficient is dependent on the catch size (i.e., the codend area), whereas in the previous studies, it was based on the twine area. Fur thermore, Thierry et al. (2020a, 2020b) noted that the codend of the bottom trawl tended to pile up and undulate with the current. For codends with catches, the estimated drag coefficient is consistent with the values reported by Hoerner (1965), O'Neill et al. (2005), and Zou et al. (2021). This similarity is attributed to the pressure drag on the codend catch, which plays a dominant role in the total drag experienced by the codend. The analysis of the results from this study, compared with those of Hoerner (1965) and O'Neill et al. (2005), shows that the codend drag increases proportionally with the amplitude of transverse oscillations. This trend arises because as catch weight increases, the transverse motion of the codend becomes more intense and unstable (Kim, 2012).
The oscillations generated by a codend attached to a cir cular rigid frame are more intense than those of a codend attached to a trawl (O'Neill et al., 2003). These oscillations synchronize with the drag force oscillations. More over, the drag force oscillation, which includes a weak wave component, is caused by vortex and eddy flows developed inside and around the codend. These flows impose transverse pressure on the codend (Madsen et al., 2015; Druault and Germain, 2016). The oscillations mainly occur at low frequencies, with increasing amplitude as the catch size and inflow velocity rise. The FFT analysis shows that the low frequencies of the drag range between 0.003 and 0.08 Hz for all codends. These frequencies are lower than those reported by Nepali et al. (2020) for the drag force on a square cylinder. In addition, the frequencies obtained in the present study are similar to those reported for the codend and the horizontal surface of bottom trawls by Druault et al. (2012) and Druault and Germain (2016).
During the experiments, the codend exhibits oscillatory motion in both longitudinal and transverse directions. This behavior occurs because the codend, when attached to a trawl, oscillates in both longitudinal and vertical directions in response to the dynamic interaction of the fishing vessel under trawling conditions (O'Neill et al., 2003, 2005). These results also support the hypothesis proposed by Madsen et al. (2015), which suggests that the oscillatory motion of the codend can be represented along all axes perpendicular to the central axis of the codend. The longitudinal and trans verse motions are characterized by quasi-periodic oscillations, with their corresponding FFT spectra showing two peak frequencies: 0.1 and 1.1 Hz for the longitudinal motion and 0.067 and 0.47 Hz for the transverse motion of all codends. The high-frequency spectra associated with these two motions are nearly flat, which aligns with the findings of Bouhoubeiny et al. (2011). These flat high-frequency spectra are attributed to the presence of unsteady turbulent flows, particularly the vortices related to the low frequencies (Pichot et al., 2009; Bouhoubeiny et al., 2011). In contrast, the low-frequency motion appears to be directly related to the cyclical variations in codend drag, which are tied to the elastic nature of the extended codend. Furthermore, the first peaks of these two motions may be caused by vibrations of the codend structure. These frequencies are similar to those detected for a porous codend by Druault and Germain (2016). The second peak possibly results from the periodic oscillations induced by vortex shedding and eddy flows inside and around the fluttering structure. Williamson (1996) demonstrated that for cylindrically or spherically shaped obstacles vibrating in an unsteady turbulent flow, vortex motions were responsible for the oscillations of the obstacle.
Codends with catch weights of 3.35 and 5.04 kg exhibit greater instability with more pronounced oscillations (trans verse motion at larger amplitudes) than codends without a catch and those with a catch weight of 1.68 kg. However, in terms of longitudinal motion, codends with catch weights of 1.68 and 3.35 kg display more unsteady behavior than the other two codends. This difference in motion is attrib utable to the fact that during the physical model test, the catch area is not completely controlled, resulting in vari ability in the catch size at each level. Furthermore, the unsteady behavior of the codend motion observed in this study can be explained by the increase in catch inside the codend, leading to a larger codend volume. The larger vol ume of the codend allows unsteady turbulent flows to develop inside and around the structure, generating consid erable pressure on the free surface of the catch, as previ ously mentioned. This increased pressure amplifies the instability and the amplitude of the codend oscillatory motion due to the periodicity of the unsteady turbulent flow (Druault and Germain, 2016). Consequently, the increase in the unsteady oscillatory motion of the codend, driven by the larger catch size, leads to a reduction in codend selec tivity. This reduction occurs because of a decrease in the fish swimming performance inside the codend and a reduc tion in mesh opening, which limits the free flow of water through the codend (O'Neill et al., 2005; Priour and Prada, 2015). Moreover, the instabilities in codend motion can negatively impact both catch quality and overall trawl per formance (Liu et al., 2021; Thierry et al., 2021a, 2022a).
As previously mentioned, Figure 4 llustrates that the codend's drag force increases with both catch size and flow velocity. However, Figures 7 and 9 illustrate that as catch size and flow velocity rise, the intensity of the codend oscillations increases, leading to greater amplitudes and an increase in codend volume. This indicates that the flutter ing motions and deformation of the codend have a consid erable impact on the codend drag. Additionally, the codend drag force increases with the rising amplitudes of the trans verse motions and the increasing codend volume, while the velocity reduction inside and around the codend decreases (Figures 4, 7, 9, 10, and 11).
According to the flow velocity component contours and POD results, three main types of unsteady turbulent flow can develop inside and around the codend. The first type is turbulent flow caused by the codend wake and nearby knots, which develops more distinctly inside and around codends without a liner. The probability of this flow occur ring inside the codend was studied by Kim (2012, 2013), although his study lacked a sufficiently large flow velocity database, as flow measurements were conducted at only a single point inside the codend. However, the presence of this flow around the codend of the bottom trawl has been confirmed by Pichot (2007), Bouhoubeiny (2012), and Thierry et al. (2021a, c). The second type of unsteady turbu lent flow involves vortex shedding that develops inside and around the end part of the codend. This flow is caused by the unsteady motion of the codend and the presence of the catch, which can lead to a larger codend volume and mesh blockage. These issues limit the flow passage through the codend structure and increase the transverse pressure on the codend, as described above (Bouhoubeiny et al., 2011; Druault and Germain, 2016). Vortex shedding thus causes a considerable reduction in flow velocities and dis rupts the flow (Thierry et al., 2021b, c). The evolution of this vortex flow inside and around the fluttering codend with a catch is similar to that observed behind a circular cylinder, as reported by Perrin (2005). The third type of unsteady turbulent flow that develops inside and around the codend is eddy flow. Specifically, this flow forms inside the codend owing to the blockage of the flow passage through the codend mesh caused by the presence of the liner, which is typically located in the middle part of the codend or near the catch. The likelihood of this eddy flow formation inside the codend was evaluated by Underwood et al. (2016). The presence of this eddy flow results in a systematic increase in hydrodynamic force and catch, as well as a reduction in the loss of small organisms, such as prawns and Antarctic krill (Engås et al., 2013; Feng et al., 2017; Tang et al., 2022b). However, this flow prevents juvenile fish from escaping the codend, thus reducing the trawl selectivity. To address this issue, implementing a selective device to guide the fish closer to the codend and minimize bycatch is recommended (Kim, 2012; Druault and Germain, 2016).
The presence of turbulent flows inside and around the codend is confirmed by the Reynolds number, calculated as a function of catch size (i. e., codend diameter). At a flow velocity of 50 cm/s, the Reynolds numbers for the empty codend and the codend with a catch are 49 340.2 and 104 712.32, respectively. These values are smaller than those reported by Pichot et al. (2009) but higher than those obtained by Bouhoubeiny et al. (2011) and Druault and Germain (2016). The differences in Reynolds numbers between this study and those by Bouhoubeiny et al. (2011) and Druault and Germain (2016), who also used codend diameter, can be attributed to variations in catch weight and test conditions. The difference in Reynolds numbers between the present study and that of Pichot et al. (2009) arises because Pichot et al. (2009) used the codend length in their calculation and a different inflow velocity.
The present research is unique in that it demonstrates the impact of catch size and liner on the behavior of the unsteady turbulent flow developing inside and around the codend structure based on ECVM measurements taken at multiple points inside and outside various codend struc tures. Kim (2012) explored the impact of turbulent flow on fish behavior by conducting one-point measurements inside a shrimp beam codend via acoustic Doppler velocimetry. In addition, Bouhoubeiny et al. (2011) and Druault and Germain (2016) used time-resolved particle image velocime try to examine the flow field around a fluttering codend structure with a catch, analyzing how codend motions influence vortex shedding development. In the present study, the velocity measurements taken inside the codend reveal flow velocity deficits of 6.77%, 49.64%, 23.64%, and 19.57% for the unlined codend without a catch, the unlined codend with a catch, the codend with a liner but without a catch, and the codend with both a liner and a catch, respectively. These results demonstrate that the pres ence of the liner and catch considerably influences the flow field inside the codend, as reported by Kim (2013) and Underwood et al. (2016).
Furthermore, the results of the present study for the unlined codend without a catch, along with the findings reported by Vincent (1996) and Theret (1998), demonstrate that the velocity inside the codend is close to the towing speed during fishing operations. However, when both the liner and catch are added to the codend, the difference becomes more pronounced. The discrepancy between the results obtained by Theret (1998) and those of the present study for codends with both catch and liner can be attrib uted to the presence of the liner and catch, which consider ably increases the velocity reduction. The flow hindrance caused by the mesh opening and the catch impedes flow passage (Bouhoubeiny, 2012).
Regarding the momentum flux (i.e., the Reynolds stress tensor), normal turbulence stresses (u'2 and v'2) and shear stresses (u'v') show high values around the codend with out a catch. However, these stresses are also high inside the codend with a liner and inside and around the end part of the codend with a catch. The increased values inside the codend with a catch are attributed to the pressure exerted by vortex shedding on the free surface of the catch, as reported by Bouhoubeiny et al. (2011) and Druault and Germain (2016). This suggests that a considerable proportion of tur bulent stress is generated by the passage of the von Kármán vortex through the codend with both catch and liner. Com pared with other fluctuations, the passage of the von Kármán vortex is of considerable energetic importance. The topology of these constraints on the codend without a catch aligns with the findings of Druault and Germain (2016) for the wake downstream of the codend. In con trast, the value obtained in the present study is approxi mately 12.5% lower than that reported by Bouhoubeiny et al. (2011) for the region around the rigid codend but 25% greater than that reported by Druault and Germain (2016) for the region downstream of a fluttering codend. This discrepancy arises because the rigid codend disrupts the flow passage through the structure more strongly than the fluttering codend, leading to the generation of a more unstable and considerably turbulent flow. Another reason for the discrepancy is the difference in the Reynolds num ber, as Tran et al. (2019) noted that a higher Reynolds number resulted in increased flow velocity fluctuations and Reynolds stress.
The present study demonstrates that the POD method can effectively extract the unsteady turbulent dynamic flows from each available ECVM instantaneous unsteady velocity field. Although this method may seem complex, it offers the ability to describe processes crucial for under standing the behavior of unsteady turbulent flows inside and around fishing gear (Druault et al., 2012; Thierry et al., 2021a). The results of this POD analysis reveal that the first POD mode, Φu(1), represents the signature of a global mean flow, where a flow velocity deficit is evident near the structure and catch. This global mean flow is associated with the instability of the current turbulent flow, which includes turbulence from the codend wake, eddy flow, and vortex shedding, as well as the oscillations of the codend. Φu(2), Φu(3), and Φu(4) present deficit zones in the regions affected by the motions of the codend structure. These zones are located near the codend structure and catch, which may be associated with the fluttering motion of the codend and flow fluctuations (Figure 15). These findings are con sistent across all flow configurations (all four codends) and align with the conclusions reported by Druault et al. (2012), Bouhoubeiny et al. (2014), and Thierry et al. (2021a). According to these studies, POD functions as a phase-averaging operator for unsteady turbulent flow.
As shown by Bouhoubeiny et al. (2011) and Druault and Germain (2016), the Strouhal number related to the vortex shedding frequency of the natural wake flow excita tion is 0.19 for rigid codends and 0.135 for fluttering codends. According to the POD phase-averaged mean velocity, this frequency is modified to 0.124, 0.774, 0.317, and 0.851 for the unlined codend without a catch, the unlined codend with a catch, the codend with a liner and without a catch, and the codend with both a liner and a catch, respectively. These increases demonstrate that the vortex and eddy flow frequencies of the codend structure with a catch are higher than those of the codend without a catch. Therefore, the presence of both the liner and catch considerably influences the behaviors of both vortex and eddy flows. Furthermore, the present study complements the work of Bouhoubeiny (2012), who demonstrated that the vortex shedding frequency of a fluttering codend struc ture was lower than that of a rigid codend structure. The clear peak observed in the Fourier spectrum of the unlined codend without a catch, along with the decrease in the Strouhal number (St), aligns with the findings of Druault and Germain (2016). As the flow passage through the codend is obstructed by both catch and liner, the codend with both a liner and a catch helps explain the increase in the energy contribution of a(t)(3) in the POD spectra (Figures 16 and 18).
5 Conclusions
This study experimentally investigated the hydrodynamic characteristics of the codend under uniform flow, focusing on hydrodynamic forces, codend shape, codend motions, codend volume, and the flow field inside and around the codend, considering different catch sizes and liners. The objective was to further elucidate the fluid–structure inter action of typical codends used in midwater trawl fisheries. The FFT method was employed to analyze nonstationary time series, while the POD method was used to extract the phase-averaged mean properties of unsteady flows from the ECVM databases and to characterize the unsteady tur bulent flow inside and around the codend. The following conclusions can be drawn:
1) Substantial codend deformations were observed. Fur thermore, drag forces, transverse motion, geometrical shape, and Reynolds number all increased with catch size and inflow velocity, while the drag coefficient and longitudinal motion decreased as catch size increased. A strong correla tion existed between codend drag, codend volume, and codend motions. The codend motions were synchronized with the unsteady turbulent flow field inside and around the codend.
2) The fluid–structure interactions between the codend structure and the unsteady flow were complex. The reduc tion in flow velocity inside and around the trawl codend varied significantly with catch size and the presence of a liner inside the codend. However, average velocity ratios for the regions inside and around the codend were determined.
3) This study demonstrated the effective application of combining the POD procedure with the ECVM database to extract instantaneous, phaseaveraged mean flow velocity fields from the unsteady turbulent flow formed inside and around a randomly oscillating codend structure owing to fluctuations and dissipations. The results confirmed that the distribution of mean velocity profiles in such turbulent flows was strongly influenced by the catch size, the pres ence of the liner, and the motions of the structure.
4) Considering that the experiment used a 1/20 scale codend model, the amplitude of codend oscillations during actual fishing operations may be 20 times larger. This scal ing resulted in a vertical motion of approximately 1/20th of the codend diameter. A better understanding of the forces acting on the trawl, including metrics such as codend drag, codend volume, and flow instabilities associated with codend fluttering motions, enables the characterization of the shape, drag, and behavior of the fishing structure dur ing trawling, as well as the tension and loads in its threads and ropes. Furthermore, this improved understanding of the dynamic interaction between the unsteady turbulent flow and the moving codend structure is crucial for implement ing bycatch selectivity devices to reduce the capture of juvenile and unwanted species.
Acknowledgement: This study was financially sponsored bythe National Natural Science Foundation of China (Grant No. 32373187), the Research Fund for International Scientists of the National Natural Science Foundation of China (Grant No. 32350410404), and the Natural Science Foundation of Shanghai (Grant No. 23ZR1427000).Competing interest The authors have no competing interests to declare that are relevant to the content of this article. -
Figure 1 Physical model used in the test
Figure 2 Schematic of the experimental setup used to measure the hydrodynamic forces, flow velocity, shape, and motion of the codend model
Figure 3 Schematic of the experimental setup for flow velocity measurement inside and around the codend. The black solid dots indicate the measurement points
Figure 4 Variation of the codend profile with different catch sizes at various flow velocities (from 50 cm/s to 90 cm/s, top to bottom)
Figure 5 Volume of the codend model with different catch sizes at various inflow velocities
Figure 6 Time history of the codend drag force for different catch sizes at various flow velocities
Figure 7 Normalized frequency spectrum of the codend drag force in log–log scale for different catch sizes
Figure 8 Drag coefficient as a function of Reynolds number calculated using codend diameter
Figure 9 (Left) Time evolution of the longitudinal (a and c) and transverse (b and d) oscillations of the codend with different catch sizes at the lowest and highest flow velocities; (Right) Spectral representation of both longitudinal (a and c) and transverse (b and d) oscillations
Figure 10 Flow velocity components in the longitudinal direction (u) and vertical direction (v) inside and around
Figure 11 Flow velocity ratio for different codends along the flow direction and transverse direction
Figure 12 Reynolds stress tensor components of the flow field inside and around (from left to right: u'2, v'2, and u'v', respectively)
Figure 13 Turbulent kinetic energy inside and around the different codends
Figure 14 POD energy distribution inside and around codends
Figure 15 Spatial POD modes inside and around. From left to right: Φu(1), Φu(2), Φu(3), and Φu(4)
Figure 16 Time evolution of the first three POD coefficients (left) and the corresponding Fourier power spectrum obtained via the FFT method (right)
Figure 17 Phase-averaged mean velocity inside and around the different codends
Figure 18 Time evolution of the phase-averaged mean velocity at a point
Table 1 Parameters of the codend and liner
Component Twine materials Mesh size (mm) Bar diameter (mm) Cutting ratio Cutting sequence Codend Part 1 Nylon 30 1.2 No cutting ration [N]22 Part 2 Nylo 30 1.2 4∶1 N [NBNBN]6 Liner Nylon 10 0.2 4∶1 N [NBNBN]6 Table 2 Characteristics of the catch in the codend
Codend Number of balls Catch weight (kg) Codend with 0 ball 0 0 Codend with 50 balls 50 1.68 Codend with 100 balls 100 3.35 Codend with 150 balls 150 5.04 Table 3 Mean flow velocity components inside and around different codend types
Velocity components Unlined codend without a catch Unlined codend with a catch Codend with a liner and without a catch Codend with both a liner and a catch Inside u 0.35 ± 0.048 0.22 ± 0.055 0.21 ± 0.097 0.17 ± 0.047 v -0.0024 ± 0.0076 -0.022 ± 0.0087 -0.017 ± 0.0059 -0.029 ± 0.0067 Around u -0.29 ± 0.019 0.37 ± 0.055 0.31 ± 0.074 0.27 ± 0.011 v -0.048 ± 0.0036 0.0075 ± 0.0065 -0.0034 ± 0.00026 -0.017 ± 0.0046 Table 4 Kinetic energy content of the first three proper orthogonal decompositions (POD) modes
% POD modes Unlined codend without a catch Unlined codend with a catch codend with a liner and without a catch Codend with both a liner and a catch 1st mode 99.28 98.71 98.93 97.77 2nd mode 0.68 1.25 1.03 2.21 3rd mode 0.041 0.043 0.045 0.037 -
Bi CW, Chen QP, Zhao YP, Su H, Wang XY (2020) Experimental investigation on the hydrodynamic performance of plane nets fouled by hydroids in waves. Ocean Engineering 213: 107839. https://doi.org/10.1016/j.oceaneng.2020.107839 Bouhoubeiny E (2012) Caractérisation de l' écoulement autour de structures souples et poreuses: Application aux engins de pêche [PhD thesis]. Université Pierre et Marie Curie-Paris VI. https://archimer.ifremer.fr/doc/00092/20276/ Bouhoubeiny E, Druault P, Germain G (2014) Phase-averaged mean properties of turbulent flow developing around a fluttering sheet of net. Ocean Engineering 82: 160–168. https://doi.org/10.1016/j.oceaneng.2014.03.009 Bouhoubeiny E, Germain G, Druault P (2011) Time-resolved PIV investigations of the flow field around rigid cod-end net structure. Fisheries Research 108(2–3): 344–355. https://doi.org/10.1016/j.fishres.2011.01.010 Brinkhof J, Herrmann B, Sistiaga M, Larsen RB, Jacques N, Gjøsund SH (2021) Effect of gear design on catch damage on cod (Gadus morhua) in the Barents Sea demersal trawl fishery. Food Control 120: 107562. https://doi.org/10.1016/j.foodcont.2020.107562 Druault P, Germain G (2016) Analysis of hydrodynamics of a moving trawl codend and its fluttering motions in flume tank. European Journal of Mechanics-B/Fluids 60: 219–229. https://doi.org/10.1016/j.euromechflu.2016.06.010 Druault P, Bouhoubeiny E, Germain G (2012) POD investigation of the unsteady turbulent boundary layer developing over porous moving flexible fishing net structure. Experiments in Fluids 53(1): 277–292. https://doi.org/10.1007/s00348-012-1290-8 Druault P, Germain G, Facq JV (2015) PIV measurements combined with the motion tracking technique to analyze flow around a moving porous structure. Journal of Fluids and Structures 56: 190–204. https://doi.org/10.1016/j.jfluidstructs.2015.04.004 Durgesh V, Thomson J, Richmond MC (2014) Noise correction of turbulent spectra obtained from acoustic Doppler velocimeters. Flow Measurement and Instrumentation 37: 29–41. https://doi.org/10.1016/j.flowmeasinst.2014.03.001 Engås A, Eriksen E, Pavlenkov A, Prokhorova T, Øvredal JT, Aasen A (2013) Trials of inner net to reduce clogging of Harstad trawlnet by small fish (Cruise report). Institute of Marine Research Farge M (1992) Wavelet transforms and their applications to turbulence. Annual Review of Fluid Mechanics 24: 395–457. https://doi.org/10.1146/annurev.fl.24.010192.002143 Feng C, Liu J, Zhang Y, Wang Y, Zhang X, Zhou A, Wang L, Wang L (2017) Structure improvement design and performance experiment of Antarctic krill trawl net. Transactions of the Chinese Society of Agricultural Engineering 33(7): 75–81. (in Chinese with English abstract). https://doi.org/10.11975/j.issn.1002-6819.2017.07.010 Fuwa S, Nakamura J, Ebata K, Kumamura T, Hirayama M (2003) Flow distribution on a simple separator device for trawling. Trends in Fisheries Science 69: 1169–1175. https://doi.org/10.1111/j.0919-9268.2003.00742.x Higham J, Brevis W, Keylock CJ (2018) Implication of the selection of a particular modal decomposition for the analysis of shallow flows. Journal of Hydraulic Research 56(5): 1–15. https://doi.org/10.1080/00221686.2017.1419990 Hoerner SF (1965) Fluid-dynamic drag. Hoerner Fluid Dynamics Hu F, Matuda K, Tokai T (2001) Effects of Drag Coefficient of Netting for Dynamic Similarity on Model Testing of Trawl Nets. Fisheries Science 67: 84–89 https://doi.org/10.1046/j.1444-2906.2001.00203.x Hu F, Tadashi T, Seiichi T, Daisuke S, Hiroshi I, Yasuhisa H (2004) The performance of the new circulating water channel of Tokyo University of Marine Science and Technology. Journal of the Japanese Society of Fisheries Engineering 41(2): 153–163. (in Japanese with English abstract). https://doi.org/10.18903/fisheng.41.2_153 Jones EG, Summerbell K, O'Neill F (2008) The influence of towing speed and fish density on the behaviour of haddock in a trawl cod-end. Fisheries Research 94(2): 166–174. https://doi.org/10.1016/j.fishres.2008.06.010 Kim HY (2012) Analysis of turbulence and tilt by in-situ measurements inside the cod-end of a shrimp beam trawl. Ocean Engineering 53: 6–15. https://doi.org/10.1016/j.oceaneng.2012.06.014 Kim HY (2013) Analysis of the turbulent flow and tilt in the cod-end of a bottom trawl during fishing operations. Ocean Engineering 64: 100–108. https://doi.org/10.1016/j.oceaneng.2013.02.019 Kim YH, Whang DS (2010) An actively stimulating net panel and rope array inside a model cod-end to increase juvenile red seabream escapement. Fisheries Research 106(1): 71–75. https://doi.org/10.1016/j.fishres.2010.07.005 Kumazawa T, Hu F, Fuwa S, Nagamatu K, Kinoshita H, Tokai T (2009) Model test of trawl gear with a net-mouth opening device based on modified Tauti's law. Nippon Suisan Gakkaishi 75(5): 793–801. https://doi.org/10.2331/suisan.75.793 Liu L, Kinoshita T, Wan R, Bao W, Itakura H (2012) Experimental investigation and analysis of hydrodynamic characteristics of a net panel oscillating in water. Ocean Engineering 47: 19–29. https://doi.org/10.1016/j.oceaneng.2012.03.013 Liu W, Tang H, You X, Dong S, Xu L, Hu F (2021) Effect of cutting ratio and catch on drag characteristics and fluttering motions of midwater trawl codend. Journal of Marine Science and Engineering 9(3): 256. https://doi.org/10.3390/jmse9030256 Liu W, Tang H, Nyatchouba Nsangue BT, et al. (2023a) Revealing the fluttering motions of mid-water trawl codend through sea trials: Case study of Antarctic krill trawl codend. Journal of Ocean University of China 22(3): 555–564. https://doi.org/10.1007/s11802-023-5301-6 Liu W, Tang H, Nyatchouba Nsangue BT, et al. (2023b) The profile and fluttering characteristics of a codend with different mesh sizes and catch by fast Fourier transform and Morlet wavelet methods. Fisheries Research 264: 106714. https://doi.org/10.1016/j.fishres.2023.106714 Lumley JL (1967) The structure of inhomogeneous turbulent flows. In A. M. Yaglom & V. I. Tatarsky (Eds. ), Atmospheric turbulence and radio wave propagation (pp. 166–178). Nauka Madsen N, Hansen K, Madsen NAH (2015) Behavior of different trawl codend concepts. Ocean Engineering 108: 571–577. https://doi.org/10.1016/j.oceaneng.2015.08.047 McHugh MJ, Broadhurst MK, Sterling DJ (2016) Choosing anteriorgear modifications to reduce the global environmental impacts of penaeid trawls. Reviews in Fish Biology and Fisheries 26(1): 1–24. https://doi.org/10.1007/s11160-016-9459-5 Nepali R, Ping H, Han Z, Zhou D, Yang H, Tu J, Zhao Y, Bao Y (2020) Two degree-of-freedom vortex-induced vibrations of two square cylinders in tandem arrangement at low Reynolds numbers. Ocean Engineering 218: 102991. https://doi.org/10.1016/j.oceaneng.2020.102991 O'Neill FG, O'Donoghue T (1997) The fluid dynamic loading on catch and the geometry of trawl cod-ends. Proceedings of the Royal Society A: Mathematical, Physical and Engineering Sciences 453(1959): 1631–1648. https://doi.org/10.1098/rspa.1997.0087 O'Neill F, Knudsen L, Wileman D, McKay S (2005) Cod-end drag as a function of catch size and towing speed. Fisheries Research 72(1): 107–118. https://doi.org/10.1016/j.fishres.2004.11.005 O'Neill F, McKay S, Ward J, Strickland A, Kynoch R, Zuur A (2003) An investigation of the relationship between sea states induced vessel motion and cod-end selection. Fisheries Research 60(1): 107–130. https://doi.org/10.1016/S0165-7836(02)00056-5 Perrin R (2005) Analyse physique et modélisation d' écoulements incompressibles instationnaires turbulents autour d'un cylindre circulaire à grand nombre de Reynolds [PhD thesis]. Institut National Polytechnique de Toulouse. https://theses.fr/2005INPT016H Pichot G (2007) Modélisation et analyse numérique du couplage filet-écoulement hydrodynamique dans une poche de chalut [PhD thesis]. Université de Rennes. https://archimer.ifremer.fr/doc/2007/these-3350.pdf Pichot G, Germain G, Priour D (2009) On the experimental study of the flow around a fishing net. European Journal of Mechanics-B/Fluids 28(1): 103–116. https://doi.org/10.1016/j.euromechflu.2008.02.002 Priour D (2014) Modelling axisymmetric codends made of hexagonal mesh type. Ocean Engineering 92: 1–11. https://doi.org/10.1016/j.oceaneng.2014.09.037 Priour D, La Prada D (2015) An experimental/numerical study of the catch weight influence on trawl behavior. Ocean Engineering 94: 94–102. https://doi.org/10.1016/j.oceaneng.2014.11.016 10.1090/qam/910462
Su B, Yin Y, Li S, Guo Z, Wang Q, Lin M (2018) Wavelet analysis on the turbulent flow structure of a T-junction. International Journal of Heat and Fluid Flow 73: 124–142. https://doi.org/10.1016/j.ijheatfluidflow.2018.07.008 Tang H, Nsangue BTN, Pandong AN, He P, Xu L, Hu F, Zou B (2022a) Hydrodynamic and turbulence flow characteristics of fishing nettings made of three twine materials at small attack angles and low Reynolds numbers. Ocean Engineering 249: 110964. https://doi.org/10.1016/j.oceaneng.2022.110964 Tang H, Nsangue BTN, Pandong AN, Sun Q, Xu L, Hu F, Zou B (2022b) Flume tank evaluation on the effect of liners on the physical performance of the Antarctic krill trawl. Frontiers in Marine Science 8: 829615. https://doi.org/10.3389/fmars.2021.829615 Tang H, Xu L, Hu F (2018) Hydrodynamic characteristics of knotted and knotless purse seine netting panels as determined in a flume tank. PLOS ONE 13(2): e0192206. https://doi.org/10.1371/journal.pone.0192206 Theret F (1998) Development of a predictive model of cod-end selectivity, Individual Progress Report IFREMER-Second Year-From December 97 to November 98, European project Fair Programme CT96 1555 Thierry BNN, Tang H, Njomoue PA, Xu L, Hu F, You X (2020a) Hydrodynamic performance of bottom trawls with different materials, mesh sizes, and twine thicknesses. Fisheries Research 221: 105403. https://doi.org/10.1016/j.fishres.2019.105403 Thierry BNN, Tang H, Njomoue PA, Xu L, Hu F, You X (2020b) Comparative study on the full-scale prediction performance of four trawl nets used in the coastal bottom trawl fishery by flume tank experimental investigation. Applied Ocean Research 95: 102022. https://doi.org/10.1016/j.apor.2019.102022 Thierry NNB, Tang H, Xu L, Hu F, You X, Njomoue PA, Zhou B (2021a) Identifying the turbulent flow developing inside and around the bottom trawl by electromagnetic current velocity meter approach in the flume tank. Journal of Hydrodynamics 33(4): 636–656. https://doi.org/10.1007/s42241-021-0058-0 Thierry NNB, Tang H, Achille NP, Xu L, Zhou C, Hu F (2021b) Experimental and numerical investigations of the hydrodynamic characteristics, twine deformation, and flow field around the netting structure composed of two types of twine materials for midwater trawls. Journal of Ocean University of China 20(6): 1215–1235. https://doi.org/10.1007/s11802-021-4740-1 Thierry NNB, Tang H, Xu L, Hu F, Dong S, Njomoue PA, Zhou B (2021c) Comparison between physical model testing and numerical simulation using two-way fluid-structure interaction approach of new trawl design for coastal bottom trawl net. Ocean Engineering 233: 109112. https://doi.org/10.1016/j.oceaneng.2021.109112 Thierry NNB, Tang H, Achille NP, Xu L, Hu F (2022a) Unsteady turbulent flow developing inside and around different parts of fluttering trawl net in flume tank. Journal of Fluids and Structures 108: 103451. https://doi.org/10.1016/j.jfluidstructs.2021.103451 Thierry NNB, Tang H, Achille NP, Xu L, Hu F (2022b) Examining engineering performance of midwater trawl with different horizontal spread ratio, floatage, and weight parameters: A case study of model net for Antarctic krill fisheries. International Journal of Naval Architecture and Ocean Engineering 14: 100448. https://doi.org/10.1016/j.ijnaoe.2022.100448 Thierry NNB, Tang H, Liu W, et al. (2023) Turbulent flow interacting with flexible trawl net structure including simulation catch in flume tank. Scientific Reports 13: 6249. https://doi.org/10.1038/s41598-023-33230-y Torrence C, Compo GP (1998) A practical guide to wavelet analysis. Bulletin of the American Meteorological Society 79(1): 61–78. https://doi.org/10.1175/1520-0477(1998)079<0061:APGTWA>2.0.CO;2 https://doi.org/10.1175/1520-0477(1998)079<0061:APGTWA>2.0.CO;2 Tran TH, Ambo T, Lee T, Ozawa Y, Chen L, Nonomura T, Asai K (2019) Effect of Reynolds number on flow behavior and pressure drag of axisymmetric conical boattails at low speeds. Experiments in Fluids 60(3): 36. https://doi.org/10.1007/s00348-019-2679-4 Underwood MJ, Shale RA, Engås A, Hemnes T, Melle W, Aasen A (2016) Flume tank testing of a multiple inner-paneled trawl to reduce loss and clogging of small organisms (Cruise report). Institute of Marine Research Vincent B (1996) Etude numérique et expérimentale des écoulements guides par une paroi perméable axisymétrique. Application à la modélisation des chaluts pour en améliorer la sélectivité [PhD thesis]. École Centrale de Nantes Wardle CS (1993) Fish behaviour and fishing gear. In T. J. Pitcher (Ed. ), Behaviour of teleost fishes (2nd ed., pp. 609–644). Chapman & Hall Williamson CHK (1996) Vortex dynamics in the cylinder wake. Annual Review of Fluid Mechanics 28: 477–539 https://doi.org/10.1146/annurev.fl.28.010196.002401 Zang Y, Yu C (2012) Study on the expansion performance of the mesh of the filter net fishing gear. Journal of Zhejiang Ocean University 31(4): 350356. (in Chinese with English abstract) Zhang F, Tang H, Thierry NNB, Liu W, Sun Q, Zhu M, Zhang C, Guo X, Shan C, Xu L, Hu F (2023a) The Oscillating Behavior of Trawl Codends Including Various Geometric Configurations of Simulated Catch. Journal of Marine Science and Engineering, 11(5): 1026. https://doi.org/10.3390/jmse11051026
