
New Approach for Environmental Load Charts of Jack-ups Considering Actual Preloading Operations
https://doi.org/10.1007/s11804-024-00391-9
-
Abstract
The environmental load chart is an important technical support required for the jack-up drilling platform to facilitate its adaptation to different operating waters and ensure the safety of operation. This chart is a crucial part of the platform operation manual. The chart data are closely related to external factors such as water depth, wind, wave, and current conditions of the working water, as well as to the structural characteristics of the platform itself and the number of variable loads. This study examines the platform state under extreme wind, wave, and current conditions during preloading. In addition, this study focuses on the difference between the ultimate reaction force of the pile leg during preloading and the reaction force of the pile leg without considering any environmental load before preloading. Furthermore, the relationship between the difference and the new reaction force of the pile leg caused by the combination of different environmental conditions is established to facilitate the construction of a new form of environmental load chart. The newly formed chart is flexible and simple; thus, it can be used to evaluate the environmental adaptability of the platform in the target well location and provides the preloading target demand or variable load limit according to the given environmental constraints. Moreover, the platform can perform personalized preloading operations, thereby improving its capability to cope with complex geological conditions, such as reducing punch-through risks. This condition reduces the load on jacking system devices and increases its service life.-
Keywords:
- Jack-up ·
- Environmental load chart ·
- Preloading ·
- Geometrically nonlinear effect ·
- Punch through
Article Highlights● A new approach for the environmental load chart of jack-ups, which can consider the actual preloading operation, was proposed.● A unified model for analyzing the comprehensive nonlinear behaviors of jack-ups was adopted in the new chart.● The new load chart is flexible and can perform personalized preloading operations.● The new load chart offers the advantage of improving the service life of jack-ups. -
1 Introduction
Jack-up is an important offshore oil and gas exploration and development equipment that is widely used in sea areas with water depths of less than 150 m. A few years ago, the global offshore oil and gas production market was relatively depressed due to fluctuations in oil and gas prices, and several jack-ups were left idle. Since 2014, oil and gas prices have gradually rebounded, and Brent crude oil futures have returned to the $90/barrel mark again, even climbing up to $130/barrel. With rising oil prices, offshore oil and gas exploitation during the downturn has also gradually accelerated, and jack-ups have received leases. On February 12, 2022, the owner of Malaysian Ocean Engineering, Icon Offshore, reported to the Malaysian Exchange that its subsidiary had received the bid-winning notice on December 23, 2021, and would drill 3+1 wells. To date, jack-ups remain an indispensable force in offshore oil and gas exploration and production.
The safe and reliable operation of jack-ups is an important guarantee to protect the marine environment and the safety of personnel and property. However, throughout their entire life cycle, jack-ups withstand complex environmental conditions, including wind, wave, current, seabed soil, and their different combinations. Thus, a jack-up will exhibit complex behaviors under different combinations of environmental factors during its life cycle.
Several studies have focused on different aspects, such as the structural characteristics, environmental factors, and mechanical response characteristics of jack-ups. Ren and Bai (2013) addressed the dynamic analysis of three frequently used truss-type legs of a jack-up: X-, reverse K-, and mixing types. They used the modified Morison equation for each of the lattice legs and integrated them along the length of all members. Consequently, the multipoint constraint (MPC) and spring elements are used to address the boundary condition. Zhao and Sun (2014) proposed a new type of jack-up rig spudcan to remove the soil resting on the upper surface of the spudcan and thus reduce the pull-out resistance during the extraction process after drilling. Jalal et al. (2016) developed second-order constrained NewWaves to simulate the nonlinearity of ocean waves for a jack-up. Their results confirmed the effect of wave nonlinearity on the dynamic behaviors of the structure during extreme events. Heo et al. (2016) provided a fast, reliable, and optimized numerical procedure for the hydrodynamic response analysis of a six-leg jack-up type wind turbine installation vessel. Through this procedure, the modified Morison equation was utilized to calculate the environmental excitation forces on the slender-body members, where Cd = 1.0 and Cm = 2.0. Zhao et al. (2018) developed a fully coupled model for a typical elevated jack-up crane vessel, considering the hydrodynamic and aerodynamic loads on the vessel, the soil–structure interaction, and the structural flexibility of the jack-up legs and crane. In the proposed model, the soil reaction force was represented using equivalent linear elastic springs combined with linear dampers to account for the soil damping effects. Kryzhevich and Rybalko (2020) discussed the use of a jack-up to analyze the influence of the elastic and damping properties of the soil on the hull vibration amplitudes in waves. The numerical analysis facilitated the construction of the amplitude–frequency characteristics of the jack-up, which indicated the significant influence of the dissipative properties of the soil on the hull vibration damping. Yang et al. (2022) used CFD to calculate the random pulsating wind load on an optimized jack-up platform to test the effect of wind resistance reduction. Their results revealed that the appropriate addition of a certain proportion of transparent layers in the superstructure increased the aesthetics of the building and optimized its stability under different wind directions. Various achievements in the nonlinear load and response of jack-ups provide a theoretical basis for the safety and reliability evaluation of the platform.
The jack-up platform experiences several conditions, such as preloading, in-site operation, and storm survival, at its work site. Punch-through incidents may occur in layered soils during the preloading process. Certain scholars have conducted relevant research considering this occurrence. Lin et al. (2016) used the Monte Carlo method considering preloading probability distribution to analyze the punch-through risk for a 400 ft jack-up in the Gulf of Mexico. Dean (2018) proposed an assessment method for the leaning instability of a jack-up during preloading in deep soft clay. Long et al. (2021) employed a piezocone penetration test to develop a while-drilling evaluation system for the punch-through risk of a jack-up during preloading. Wang et al. (2022) studied the real-time prediction of the punch-through of spudcan foundations based on the combination of monitoring data during penetration with the punch-through failure mechanism.
This study proposes a new type of environmental load chart to guide the operation of jack-up drilling platforms and effectively ensure their operational safety under complex sea conditions. The chart data are closely related to external factors such as water depth, wind, wave, and current conditions of the working water, as well as the structural characteristics of the platform itself and the number of variable loads. The proposed environmental load chart is flexible and simple to use based on the essence of platform preloading operations. This chart can be used to evaluate the environmental adaptability of the platform in the target well location and to provide the preloading target demand or variable load limit according to the provided well location environmental constraints. The working strategy and idea, implementation method and steps, and application example of the chart will be comprehensively introduced in the future.
2 New ideas on the environmental load chart
The standard expression of the environmental load chart describes the maximum number of variable loads that the platform can carry under different operating water depths and wind, wave, and current combinations. Considering that the platform's light ship and leg weights remain unchanged in the in-site state, the maximum variable load can also be expressed as the maximum allowable jacking weight or the maximum allowable leg ground force of the platform. Guo et al. (2012) provided a conventional method for generating similar environmental load charts from different perspectives or application objects. Feng (2018) used SACS software to analyze the environmental adaptability of self-elevating wind turbine installation platforms and provided an environmental atlas. Joo et al. (2020) studied the load-carrying capacity design criteria of a jack-up using the LRFD method under environmental loading conditions. However, none of these studies mentioned a crucial operation process of the jack-up, that is, the preloading process, or by default, assumed that the platform would conduct preloading according to the maximum preloading capacity in the operation manual. Moreover, the actual state of preloading is an important factor affecting the capability of the platform to resist external environmental conditions, thereby influencing the environmental load chart results.
As shown in Figure 1, the jack-up drilling platform is delivered to the ship owner following the completion of the construction and acceptance. The platform generally reaches the well location site through wet or dry towing. Subsequently, preloading was conducted under relatively mild weather conditions. Consequently, when all preparations are ready, the drilling operation begins, and the platform enters the in-site working state.
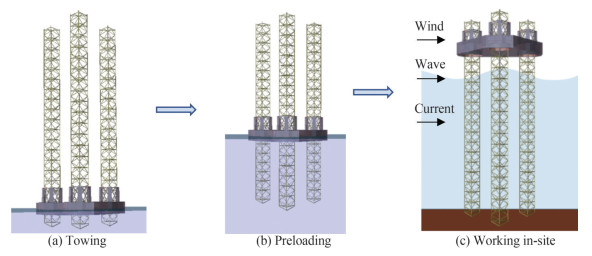 Figure 1 Jack-up flow chart before operation
As shown in Figure 2, the preloading principle involves the use of ballast water to simulate the environmental loads that may be encountered during the in-site state of the platform. The preloading process facilitated the simulated reaction force of each leg generated during the process to exceed the vertical load generated by the expected extreme environment.
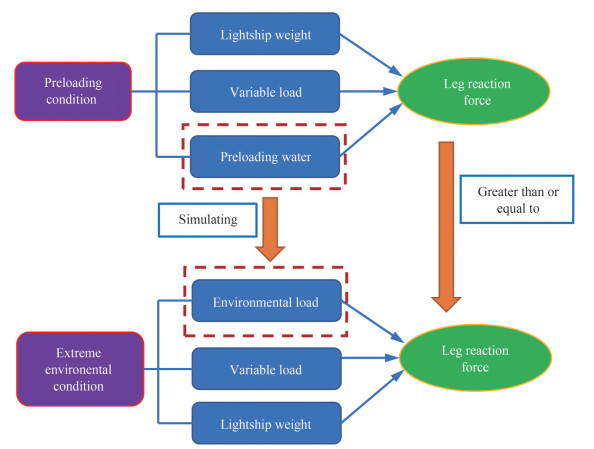 Figure 2 Principle of preloading
The preloading operation is significantly affected by the geological conditions of the seabed at a specified position. An unreasonable preloading plan may result in the platform punching through or even overturning. However, the preloading scheme provided in the operation manual is often based on certain design geological conditions that are different from the actual data in practical well sites, possibly demonstrating considerable differences. Thus, new preloading procedures must be developed based on the geological survey data of the well location. In addition, the preloading operation process requires repeated lifting of the platform. An excessively large lifting load inevitably increases the loss of the jacking system and the core valuable components of the platform. Thus, preloading the platform to the maximum design value is often unnecessary in the actual preloading operation when geological conditions and expected extreme environmental constraints are satisfied.
Thus, this study focused on a new form of chart based on the actual difference between preloading and the realization of the demand target of the load chart.
3 Implentation principle of a new form of environmental load chart
The analysis in Figure 2 reveals that if the relationship between the environmental load and its induced new vertical load of the leg can be established and the calculation problem of the vertical load of the leg caused by the platform dead weight, variable load, and preloading water can be solved, then the leg reaction force against the sea bed under the preloading and storm survival conditions can be obtained. Furthermore, as shown in Eqs. (1) and (2), the relationship among the preloading water volume, variable load, and environmental load can be established based on the above analysis. Thus, a new form of environmental load chart is constructed.
$$ R_{\mathrm{LW}}+R_{\mathrm{VDL}_{\mathrm{PRE}}}+R_{\mathrm{PRE}} \geqslant R_{\mathrm{LW}}+R_{\mathrm{VDL}_{\mathrm{SUR}}}+R_{\mathrm{ENV}} $$ (1) The following formula is obtained after derivation:
$$ R_{\mathrm{VDL}_{\mathrm{PRE}}}+R_{\mathrm{PRE}} \geqslant R_{\mathrm{VDL}_{\mathrm{SUR}}}+R_{\mathrm{ENV}} $$ (2) where RLW is the leg reaction force against the sea bed caused by lightship weight, RVDLPRE is the leg reaction force against the sea bed caused by variable load during preloading condition, RVDLSUR is the leg reaction force against the sea bed caused by the variable load under extreme environmental condition, RPRE is the leg reaction force against the sea bed caused by ballast water during preloading condition, RENV is the leg reaction force against the sea bed caused by environmental load under extreme environmental conditions.
The leg reaction force against the sea bed caused by variable load and ballast water may be classified as the problem of gravity load distribution. The force balance principle, considering the geometric position of the platform leg, is used to obtain this classification. This part is no longer comprehensively described in this study.
However, the external environmental conditions of the platform are complex and changeable. At least hundreds of thousands of calculation conditions are involved when combining different operating water depths, winds, waves, and currents. Moreover, several influencing factors should be considered in the analysis. In addition, the platform exhibits nonlinear and strong dynamic characteristics under the action of external environmental loads. Therefore, the key to constructing the stated new form chart involves deducing a method to obtain the new leg reaction force against the sea bed due to the combination of environmental loads such as wind, wave, and current.
3.1 New leg reaction force against the sea bed caused by the combination of environmental loads
The calculation of the new leg reaction force against the sea bed caused by environmental loads using a formula is difficult and often requires finite element analysis.
Cao et al. (2016) performed a series of static, modal, and transient analyses for the FEM jack-up model. In this study, a unified model for analyzing the comprehensive nonlinear behaviors of jack-ups is proposed, considering all environmental loads. The equilibrium equations for the jack-up subjected to small deformations can be expressed in matrix form as follows:
$$ \boldsymbol{M} \ddot{\boldsymbol{u}}+\boldsymbol{C} \dot{\boldsymbol{u}}+\boldsymbol{K} \boldsymbol{u}=\boldsymbol{F} $$ (3) where M, C, and K are the mass, damping, and stiffness matrices, respectively, $\ddot{\boldsymbol{u}}$ is the acceleration vector, $\dot{\boldsymbol{u}}$ is the velocity vector, u is the displacement vector, and F is the force vector described in Sections 3.1.1–3.1.4.
Equation (3) can be solved numerically. According to the structural characteristics of the jack-up, the corresponding structural model can be established using finite element software, and M, C, and K can be automatically obtained. Therefore, accurate calculation of the load terms on the right side of the equation is the key to constructing the equation.
3.1.1 Wind load
As a function of the vertical location above the still water level, the wind velocity can be expressed using an exponential function according to the code DNV (2015) published by DNV classification Society.
$$ v_{\text {wind }}(z)=v_r\left(\frac{z}{z_0}\right)^{\frac{1}{n}} $$ (4) where vwind is the wind velocity at an arbitrary location above the sea surface, vr is the one-minute averaged wind velocity at the reference height, z is the height of the load center point above the still water level, z0 is the reference height of 10 m, and n is a selective value to be determined by the jack-up condition, which is set as 11 for the elevated condition.
The total wind force is the sum of the wind loads acting on each member exposed to the air of the jack-up. Assuming that the wind force is a quasistatic load, the steady-state wind pressure, P, acting normally on the member surface can be described according to ABS (2023) instead of
$$ P=f C_h C_s v_{\text {wind }}^2 $$ (5) where f is equal to 0.611, vwind stands for wind velocity (m/s), Ch is the height coefficient, and Cs is the shape coefficient.
Subsequently, the wind force F can be calculated using the following equation for each vertical area:
$$ F=P A $$ (6) where A is the projected area (m2), including all exposed surfaces above sea level.
Many complicated pieces of equipment or structures are arranged on the main deck of the jack-up platform, and their shapes and sizes are quite different. The wind blows from different directions to the jack-up, and a shielding effect exists between these complex pieces of equipment or structures. Compared with the size of the main hull of the jack-up of approximately 100 m, the wind load on a piece of equipment or structure with a size of less than 0.5 m can be ignored in the wind load calculation. Simultaneously, the shielding effect between the pieces of equipment and structures is disregarded. Ignoring the small size of the equipment or structure yields low wind load results, while ignoring the shielding effect between the equipment or structures yields high wind load calculation results. Therefore, the two effects cancel each other, simplifying the calculation process and maintaining the accuracy of the wind load calculation results. Therefore, the wind load experienced by the equipment or structure with a size of less than 0.5 m is ignored, and the shielding effect between the structures or the equipment is disregarded in the wind load calculation.
The solidification effect must be considered for truss structures, such as derrick towers, booms, and helideck structures. This effect may be approximated by considering 30% of the projected block areas of the front and back sides, that is, 60% of the projected block area of one side for double-sided truss operation.
The wind load is proportional to the square of wind velocity. Therefore, only the wind load under the unit wind velocity of a certain wind direction must be solved, and the wind velocity under this wind direction can be obtained by multiplying the load with the square of the other wind velocity in the actual analysis.
3.1.2 Wave and current loads
The hydrodynamic loads acting on the jack-up are primarily caused by waves and currents.
The current is assumed to be steady and can be treated as quasistatic loads on the jack-up. Moreover, the distribution of the current linearly varies with depth. Herein, the current velocity is the maximum at sea level and is 0 at sea bottom, and the velocity between the sea level and bottom exhibits a linear distribution. This conservative assumption covers most of the actual distribution of current in the general sea area.
However, the waves are treated as dynamic loads; thus, the type of wave model is crucial for the dynamic response analysis of jack-ups. Jalal et al. (2016) found that the wave nonlinearity effect flattened the wave trough and sharpened the crest, whereas the wave period remained unaffected. In addition, this effect produced additional energy, which can substantially influence the jack-up. Consequently, the wave in the calculation is assumed to be nonlinear fifth-order Stokes.
The velocity potential φ is
$$ \varphi=\frac{L}{k T} \sum\limits_{n=1}^5 \varphi_n \operatorname{ch}(n k s) \sin (n \theta) $$ (7) The wave profile equation η is
$$ \eta=\frac{1}{k} \sum\limits_{n=1}^5 \eta_n \cos (n \theta) $$ (8) The horizontal velocity uw of the water quality point is
$$ \boldsymbol{u}_w=\boldsymbol{c} \sum\limits_{n=1}^5 n \varphi_n \operatorname{ch}(n k s) \cos (n \theta) $$ (9) The horizontal acceleration aw of the water quality point is
$$ \boldsymbol{a}_w=\omega \boldsymbol{c} \sum\limits_{n=1}^5 n^2 \varphi_n \operatorname{ch}(n k s) \sin (n \theta) $$ (10) where n is a positive integer (1≤n≤5), L is the wavelength, T is the wave period, c is the wave velocity, ω is the wave circle frequency, θ is the wave phase angle, k is the wave number, s is the distance from the free surface to the seabed, φn is the velocity potential, and ηn is the waveform coefficient.
The relationship between the wave height and the period is
$$ T=4.1 H^{0.4}+1 $$ (11) where H is the wave height.
During the working period of the jack-up, the legs are the main structures subjected to hydrodynamic load. The horizontal dimension of the legs is substantially smaller compared to the wavelength. Thus, the Morison equation (Morison et al., 1950) can be used to compute the hydrodynamic loads. Furthermore, the quasistatic current load can be superimposed on the wave load due to the joint action of wave and current on the legs:
$$ \boldsymbol{f}=\frac{1}{2} \rho_w C_d D\left(\boldsymbol{u}_c+\boldsymbol{u}_w\right)\left|\boldsymbol{u}_c+\boldsymbol{u}_w\right|+\rho_w C_m A_w \boldsymbol{a}_w $$ (12) where ρw is the sea water density (kg/m3), Cd is the drag coefficient, Cm is the inertial coefficient, D is the hydrodynamic diameter, uc is the current velocity, and Aw is the projected area of the component in the direction perpendicular to the incoming flow.
Notably, the exploration of wave phase angles is performed to determine the maximum wave shear force and wave bending moment and identify the most dangerous working condition of the structure.
The core section of the Morison equation involves choosing the drag coefficient, that is, Cd. In the truss-type leg structure, Cd can be set to 0.65 in the high Reynolds number flow field during jack-up operation for the braces of the conventional tubular structure. By contrast, for chords with complex rack structures, Xie et al. (2021) found that Cd is related to the chord section structure form and the angle of the section structure relative to the incoming flow direction.
Lin and Sun (2020) calculated the hydrodynamic load of the chord under the action of different waves and currents using CFD according to Wang (2004), and the Cd value obtained was substituted into the Morison equation.
The chord of the leg, an important supporting component of the jack-up, is welded by two semicircle plates sandwiched with a rectangular rack, as shown in Figure 3.
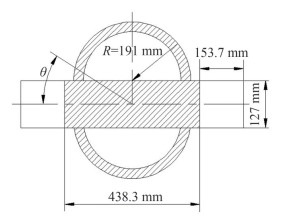 Figure 3 Chord section geometry
The flow field characteristics around the chord are completely different from those of tubular structures due to the existence of the rectangular rack. Thus, a realistic K- ε model and a scaling wall function suitable for large pressure gradients and high Reynolds number flow can be employed.
Figure 4 presents a sample curve of the hydrodynamic coefficient Cd of a chord section with tooth height and thickness of 153.7 and 127 mm, respectively, in different inflow directions. The Cd coefficient of the chord in any flow direction can be obtained by interpolating the curves considering its geometric bisymmetry.
 Figure 4 Cd under different inflow directions α
3.1.3 Inertial load
The natural jack-up period typically ranges from 6 s to 14 s; thus, dynamic amplification factors with waves may emerge in this period range. Therefore, considering the dynamic effects of the jack-up in the elevated condition is often desirable due to the waves or waves combined with current.
The random wave dynamic analysis approach is based on the wave as a random quantity. Taylor et al. (1997) regarded the jack-up dynamics as a Gaussian process, while Huang et al. (2010) and Yu et al. (2012) comprehensively discussed the dynamic response of the jack-up platform, including the study of the mechanism and the influence of external environmental factors. ABS (2014) recommended that the most probable maximum extreme (MPME) wave overturning moments of selected static and dynamic responses can be obtained using a time domain approach. The CDAF is the ratio of the MPME of the dynamic response to that of the static response.
Subsequently, the inertial load can be obtained according to CDAF and static amplitude wave force.
$$ F_I=\left(C_{\mathrm{DAF}}-1\right) \times F_{\mathrm{Static}}=\frac{\left(C_{\mathrm{DAF}}-1\right)}{2}\left(F_{\max }-F_{\min }\right) $$ (13) where FI is the inertial load to be applied at the center of gravity of the jack-up, FStatic is the static amplitude of wave force, and Fmax and Fmin are the maximum and minimum total combined wave and current force, respectively, obtained from quasistatic structural analysis.
3.1.4 Geometrically nonlinear effect (P-Delta effect)
Under the action of horizontal wind, waves, and currents, the jack-up exhibits a horizontal displacement. Compared with the vertical state, the stiffness of the leg due to horizontal displacement becomes weaker, allowing the platform to produce a new horizontal displacement. The entire loading process exhibits geometric nonlinearity characteristics when constantly repeated. By compiling an iterative calculation program, the leg stiffness Kl in the finite element analysis is continuously modified (Eq. (14)), until the increase in the horizontal displacement of the leg is reduced to an acceptable value.
$$ K_l=-P_g / L_g $$ (14) where Pg is the total effective gravity load on each leg, including the hull and leg weights above the hull and leg joint points, respectively, and Lg is the distance from the low constraint point to the vertical center of gravity.
3.1.5 Leg reaction force RENV
The constraint force of the leg can be obtained through finite element analysis, and its vertical component is the leg reaction force against the sea bed. The maximum leg reaction force under extreme and no environmental conditions is R1 and R2, respectively. Consequently, the new vertical leg reaction force RENV is expressed by the difference between the two forces as follows:
$$ R_{\mathrm{ENV}}=R_1-R_2 $$ (15) 3.2 Flow chart illustration of the environmental load chart
According to the above analysis, the relationship curve of the new leg reaction force against the sea bead caused by the combination of extreme wind, wave, and current under different working water depths is established. This is the new form of environmental load chart of jack-up proposed in this study to adapt to the actual preloading situation.
The specific flow chart of the load chart drawing is shown in Figure 5.
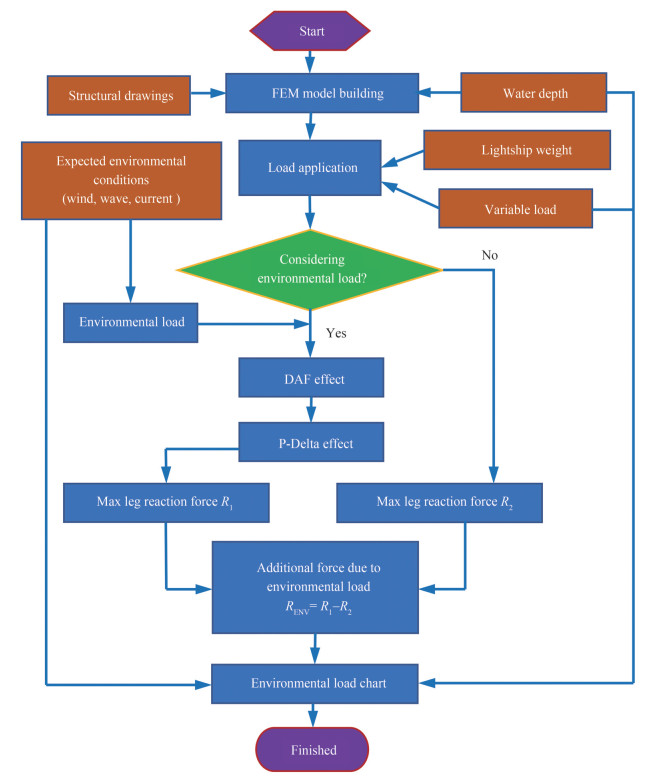 Figure 5 Flow chart illustration of the environmental load chart
3.3 Application of the environmental load chart
The described load chart can perform three functions depending on the known data and requirements, as shown in Figure 6.
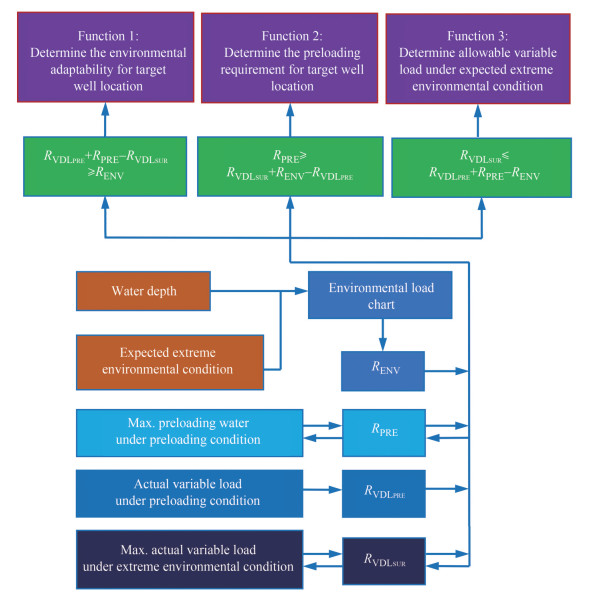 Figure 6 Application of environmental load chart
3.3.1 Determination of the environmental adaptability of one jack-up in the target well location
The main process is as follows:
Step 1: Preparation of the known data
These data include the following: water depth, ballast water upper limit, and variable load carried during the preloading process; maximum value of variable load to be carried during normal operation; and combination of expected extreme wind, wave, and current that may be encountered during the working period.
Step 2: Chart querying
An appropriate chart to query is selected according to the water depth and expected environmental conditions in the working site, and the value of RENV under the environmental conditions is determined.
Step 3: Determination of environmental adaptability Calculation of the allowable leg reaction force against the sea bed generated by carrying a variable load, maximum ballast water, and maximum allowable variable load during preloading, that is, RVDLPRE, RPRE, RVDLSUR, respectively. The adaptability can be determined according to the following formula:
$$ R_{\mathrm{VDL}_{\mathrm{PRE}}}+R_{\mathrm{PRE}}-R_{\mathrm{VDL}_{\mathrm{SUR}}} \geqslant R_{\mathrm{ENV}} $$ (16) The left side of Eq. (16) is the difference between the maximum leg reaction force against the sea bed during preloading and operation conditions, and the right side is the additional leg reaction force against the sea bed caused by extreme environmental conditions. If the conditions in Eq. (16) are satisfied, then the jack-up possesses the capability to adapt to the expected environmental conditions.
3.3.2 Determination of the preloading requirement of one jack-up in the target well location
As previously described, the chart is queried, the relevant data are calculated, and the ballasting water volume is constantly adjusted during the preloading process until the leg reaction force against the sea bed satisfies Eq. (17), which is the ballast water requirement for preloading.
$$ R_{\mathrm{PRE}} \geqslant R_{\mathrm{VDL}_{\mathrm{SCR}}}+R_{\mathrm{ENV}}-R_{\mathrm{VDL}_{\mathrm{PRE}}} $$ (17) 3.3.3 Determination of allowable variable load of the jack-up under expected extreme environmental conditions
As previously described, the chart is queried, the relevant data are calculated, and the variable load amount to be carried during operation is constantly adjusted until the leg reaction force against the sea bed satisfies Eq. (18), which is the upper limit of the variable load to be carried when encountering the expected extreme environments.
$$ R_{\mathrm{VDL}_{\mathrm{SUR}}} \geqslant R_{\mathrm{VDL}_{\mathrm{PRE}}}+R_{\mathrm{PRE}}-R_{\mathrm{ENV}} $$ (18) 4 Application examples
One self-elevating drilling platform is taken as the application object to illustrate the generation process of the described environmental load chart.
4.1 Basic known data
As shown in Figure 7, the example platform is a 300 ft water depth jack-up with truss-type legs. The lightship weight is approximately 6 470 t, and the total length of each leg is 125.3 m. Table 1 lists the primary parameters closely related to the environmental load chart.
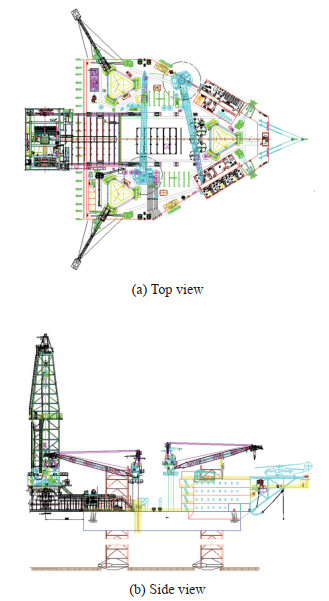 Figure 7 General layout of analyzed jack-upTable 1 Upper limit of environmental parameters
Parameters Upper limit Water depth (ft) 300 Wind velocity (kn) 70 Current velocity (kn) 2 Wave height (ft) 35 Variable load (t) 3 500 4.2 Gridding of environmental parameters
According to the jack-up data in Table 1 and considering the actual situation that may be encountered in the future, Table 2 shows the grid of the environmental parameters. The upper limit of these grided environmental parameters should not exceed the extreme design environmental data found in the approved in-place analysis report to ensure the security of structural strength during the preloading.
Table 2 Grid of environmental parametersParameters Grid value Water depth (ft) 100, 150, 200, 250, 300 Wind velocity (kn) 5, 15, 25, 35, 45, 55, 70 Current velocity (kn) 1, 2 Weight height (ft) 10, 15, 20, 25, 30, 35 Moreover, the air gap values are not grided in this example because the height from the platform's bottom to the sea is rarely adjusted unless a special case occurs; that is, the air gap normally remains unchanged when the jack-up stands up for working. However, if the air gap is taken as one of the griding parameters, then the adaptability of the environmental load chart will be highly extensive.
4.3 Finite element analysis
As shown in Figure 8, the finite element model for in-site analysis is established according to the structural illustrations of the platform using the SESAM software.
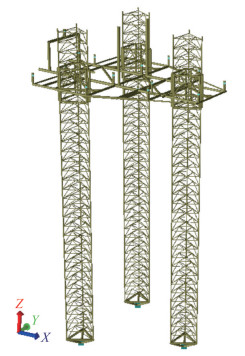 Figure 8 Finite element model of the jack-up
The detailed model establishment, load application, and constraint treatment are shown as follows.
1) The substituted equivalent beam with the same attributes is considered in the model because the cross-section of the leg chord is irregular.
2) The leg brace structures are built according to their real section.
3) The equivalent beams are used to simulate the structures of the spudcan.
4) The truss beams with the same stiffness are modeled to substitute the hull structures.
5) Horizontal displacement of the spudcan is not considered in this study, and the penetration depth of the spudcan can be determined based on geological conditions. Considering the constraint characteristics of the soil on the spudcan, certain scholars have conducted relevant research. Aagesen et al. (2018) considered the possibility of beneficial effects of soil resistance generated by leg chord and brace members. Korzani and Aghakouchak (2015) studied the load–displacement behavior of a jack-up foundation. They obtained moment rotation curves at the end of platform legs to be used in a simplified model to account for the relative fixity at the soil–foundation interface. Subsequently, the corresponding boundary constraints were applied at the location of the spudcan.
In this study, the maximum rotational stiffness Krs defined by Eq. (19) is applied to the model.
$$ K_{\mathrm{rs}}=E I /\left(L_m C_{\min }\right) $$ (19) where E is the Young's modulus (Pa), I is the leg moment of inertia (m4), Lm is the distance from the hull bottom to the seabed plus the penetration depth (m), and Cmin is the coefficient related to the structural form of the leg.
In the case of limited geological data, the boundary conditions can be conservatively considered as being pin-ended at 3.05 m below the sea bed.
6) The force transfer between the leg and the main hull primarily depends on the locking and guiding systems. Under in-site service conditions, the locking system constrains the horizontal and vertical displacements of the leg along its axial and vertical directions, respectively. This system also restrains the rotation freedom of the leg chord along its axial direction. By contrast, the guiding system constrains the horizontal displacement of the leg along the axial direction of the guiding structures.
7) The mass value and its distribution directly affect the natural period and the dynamic response of the platform. Mass balls are used to represent the mass of the structures and equipment. The quality and position of mass balls must be adjusted according to the actual data under the working conditions of the jack-up.
8) The wind load is applied as follows. First, a rigid beam is created at the geometric center of the structure or equipment subjected to wind load. Subsequently, a concentrated force is applied at the top of the beam, and the magnitude of all wind loads and wind overturning moments is ensured to be similar to the calculated value. Otherwise, the magnitude must be adjusted by the wind load value or position.
9) Regarding the inertial force, the horizontal acceleration is calculated by dividing the calculated inertial force by the total mass of the platform, which is applied to the FE model.
10) Regarding the geometrically nonlinear effect mentioned in Section 3.1.4, programming languages (such as C# or Python) and SESAM software must be combined to implement the process.
4.4 Environmental load chart illustration
According to the process shown in Figure 5, combined with the above finite element model, the new leg vertical reaction force RENV caused by environmental loads under different water depths, wind speeds, wave heights, and flow velocities presented in Table 2 can be calculated. Thus, the environmental load chart was illustrated, as shown in Figure 9.
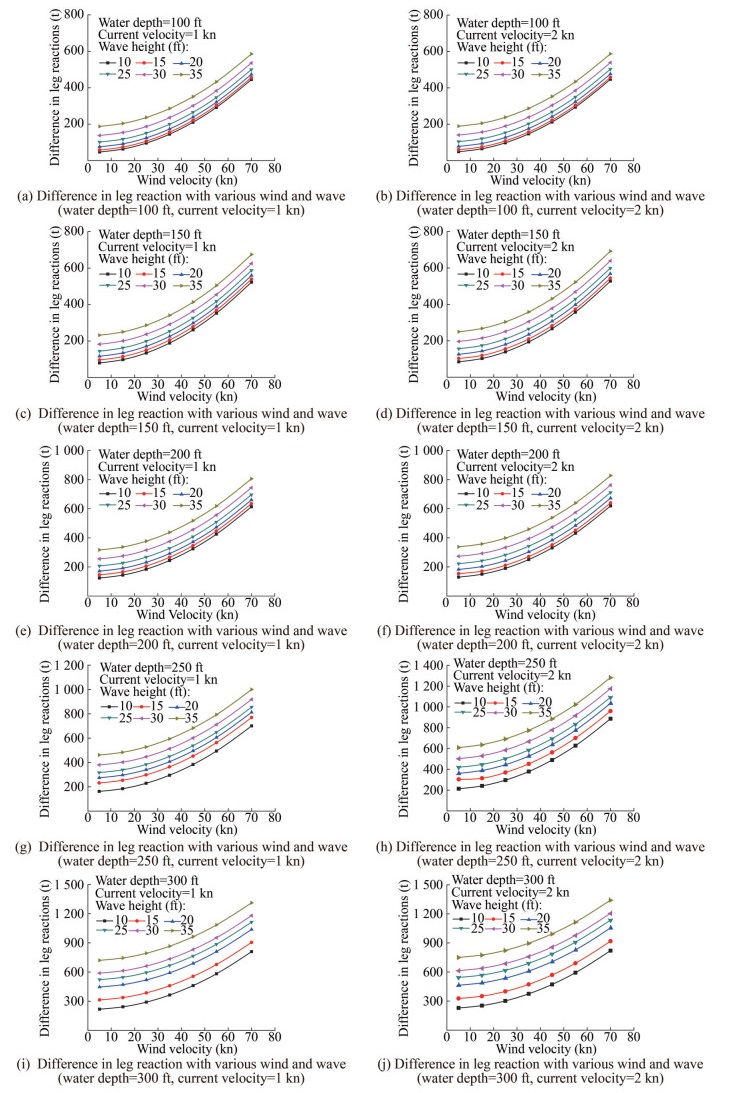 Figure 9 Environmental load chart of 300 ft jack-up
The following results can be observed from the figures in the environmental load chart.
1) With the increase in wind speed, the RENV value increased in the form of a parabola with an index slightly greater than 1. This increase is reasonable because the wind load is proportional to the square of the wind speed.
2) With constant water depth and current velocity, the distance between the two curves corresponding to related wave heights was nearly identical, demonstrating that the RENV force increased linearly with the wave height.
3) As the current velocity increased from 1 to 2 kn, the RENV value increased correspondingly under the same water depth.
4) As the wave height increased, the RENV value correspondingly increased. This finding indicates that the velocity and acceleration of the water point are large at high wave heights, resulting in a substantial load. However, under the same wind speed, the gradient of RENV varied with water depth. When the water depth was 200 ft and below, the gradient value of RENV increased from small to large. By contrast, when the water depth was greater than 200 ft, the gradient value first increased and then decreased. This phenomenon is attributed to the close relation of the natural period of the jack-up to the water depth. When the period is close to the wave period, the inertial load reaches a maximum.
5) All curves in the chart exhibited good consistency; thus, the results under other environmental parameters can be directly obtained via interpolation.
5 Conclusions
The following conclusions can be derived from the study:
1) The environmental load chart of the jack-up is closely related to the preloading operation. The chart essentially reflects the capability of the platform to resist the future expected extreme environments while ensuring its structural strength safety. Furthermore, the preloading operation uses ballast water to simulate the effect of encountering possible extreme environments to ensure its safe operation in the future. The "future possible extreme environment" yields a close connection between the two aspects.
2) The additional leg reaction force due to the future possible extreme environment can be derived from the difference between the maximum leg reaction force reached during the preloading process and the force without considering any environmental load before the preload. A new form of environmental load chart can be obtained to construct the mapping of the new leg reaction force with the grided environmental parameters and describe its connection with the preloading operation.
3) The actual preloading state of the platform directly affects its adaptability to future extreme environments. Furthermore, the proposed new form of environmental load chart provides reasonable suggestions for preloading. Using the chart, the required ballast water during the preloading process can be easily determined, similar to that for future extreme environments; it is usually less than the upper limit of the ballast capacity. Moreover, reasonable personalized preloading operation consistent with the future extreme environment can reduce the loads on the jacking system device, which is the core and expensive component of the jack-up, thereby increasing its service life.
4) The proposed new environmental load chart can also be used to evaluate the environmental adaptability of the jack-up to the target operation well or provide the upper limit of variable load at extreme environmental conditions.
5) The structural safety of the platform while using the new form of environmental load chart is normally guaranteed. The environmental parameters of meshing in the process of chart compilation are selected below the design environmental conditions; however, the actual preloading water volume of the platform cannot exceed the design value of the maximum preballast. Therefore, the safety indicators, such as the structural strength of the platform, cannot exceed the value in the design limit state when the chart is used, which has been checked and proven safe during the design stage.
6) The newly formed chart is compiled without considering the influence of air gap changes. This phenomenon is due to the rare height adjustment from the sea surface during the platform operation process; that is, the air gap usually remains constant. However, if the platform air gap is further used as a meshing parameter and the corresponding calculation and analysis are outperformed, then the obtained chart adaptability will be highly extensive.
Acknowledgement: The authors would like to thank Qiang Shi, Tian Tian, Dezhuang Sun, Qinghui Dong, and Jie Zhao from Dalian Shipbuilding Industry Co., Ltd. for their valuable discussions on the jack-up simulation.Competing interest The authors have no competing interests to declare that are relevant to the content of this article. -
Figure 1 Jack-up flow chart before operation
Figure 2 Principle of preloading
Figure 3 Chord section geometry
Figure 4 Cd under different inflow directions α
Figure 5 Flow chart illustration of the environmental load chart
Figure 6 Application of environmental load chart
Figure 7 General layout of analyzed jack-up
Figure 8 Finite element model of the jack-up
Figure 9 Environmental load chart of 300 ft jack-up
Table 1 Upper limit of environmental parameters
Parameters Upper limit Water depth (ft) 300 Wind velocity (kn) 70 Current velocity (kn) 2 Wave height (ft) 35 Variable load (t) 3 500 Table 2 Grid of environmental parameters
Parameters Grid value Water depth (ft) 100, 150, 200, 250, 300 Wind velocity (kn) 5, 15, 25, 35, 45, 55, 70 Current velocity (kn) 1, 2 Weight height (ft) 10, 15, 20, 25, 30, 35 -
Aagesen R, Dean ETR, Lee FH, Li YP (2018) Simplified analysis of chord and brace effects on jack-up leg penetration for preloading in soft clay. Canadian Geotechnical Journal 55: 1900–1907. https://doi.org/10.1139/cgj-2017-0434 ABS (2014) Guidance notes on dynamic analysis procedure for self-elevating units. ABS 124–2014 ABS (2023) Rules for building and classing mobile offshore drilling units-part 3: hull construction and equipment Cao YG, Nie WJ, Hu XY, Zhang SH, Meng ZB, Xin L, Yu JC (2016) Parameter sensitivity study of dynamic response for jack-ups by FEM analysis. Ocean Engineering 124: 125–134. https://doi.org/10.1016/j.oceaneng.2016.07.058 Dean ETR (2018) Assessment method for leaning instability of jackups during preloading in deep soft clay. Proceedings of the Institution of Civil Engineers–Geotechnical Engineering 171(4): 310–323. https://doi.org/10.1680/jgeen.17.00182 DNV (2015) Self-elevating units. DNV-RP-C104: 2015 Feng XX (2018) Study on environmental atlas technology application in self-elevating wind turbine installation platform operation. Ship Engineering 40(9): 92–96. https://doi.org/10.13788/j.cnki.cbgc.2018.12.069 Guo CX, Huang Y, Li HX, Chen YY (2012) Survivability of self-elevating drilling unit DSJ-300 in storm. Journal of Tianjin University 45: 178–183. https://doi.org/10.3969/jissn.0493-2137.2012.02.015 Heo S, Koo W, Park MS (2016) Dynamic response and reliability of six-leg jack-up type wind turbine installation vessel. International Journal of Structural Stability and Dynamics 16(10): 1–18. https://doi.org/10.1142/S0219455417500377 Huang ZY, Tang WY, Wang Yi, Wang WT (2010) Analysis and suppression on the dynamic amplification factor of self-elevating offshore platform. Journal of Shanghai Jiao Tong University 44(6): 816–819. https://doi.org/10.16183/jxnki.jsjtu.2010.06.021 Jalal M, Kimiaei M, Cassidy MJ (2016) Effects of irregular nonlinear ocean waves on the dynamic performance of an example jack-up structure during an extreme event. Marine Structures 49: 148–162. https://doi.org/10.1016/j.marstruc.2016.05.007 Joo SP, Ha YC, Seo JK (2020) A study on load-carrying capacity design criteria of jack-up rigs under environmental loading conditions. Journal of the Korean Society of Marine Environment & Safety 26(1): 103–113. https://doi.org/10.7837/KOSOMES.2020.26.1.103 Korzani MG, Aghakouchak AA (2015) Soil-structure interaction analysis of jack-up platforms subjected to monochrome and irregular waves. China Ocean Engineering 29(1): 65–80. https://doi.org/10.1007/s13344-015-0005-3 Kryzhevich G, Rybalko T (2020) Modeling of soil properties and their influence on nonlinear vibrations of jack-up platform. Transactions of the Krylov State Research Centre 4: 82–88. https://doi.org/10.24937/2542-2324-2020-4-394-82-88 Lin HH, Sun CM (2020) Numerical study on hydrodynamic coefficient of chord with complex rack structure. 2020 ISOPE, Shanghai, 1773–1779 Lin Y, Hu AK, Jiang W, Wang Y (2016) Risk analysis of punch through for a jack-up drilling unit in layered soil. Jounal of Harbin Engineering University 37(6): 754–761. https://doi.org/10.11990/jheu.201503066 Long L, Liu B, Liu Z, Xue ZG, Sun YQ, Zheng QJ, Chen YS (2021) A while-drilling evaluation system for the punch-through risk of jack-up drilling platform during preloading and its application. Coastal Engineering 40(4): 284–290. https://doi.org/10.3969/j.issn.1002-3682.2021.04.005 Morison JR, O'Brien MP, Johnson JW, Schaaf SA (1950) The force exerted by surface waves on piles. Journal of Petroleum Technology 2(5): 149–154. https://doi.org/10.2118/950149-g Ren XG, Bai Y (2013) Comparison study of jack-up drilling unit's dynamic behaviour. Ships & Offshore Structures 8(5): 457–467. https://doi.org/10.1080/17445302.2012.715624 Taylor PH, Jonathan P, Harland LA (1997) Time domain simulation of jack-up dynamics with the extremes of a gaussian process. Journal of Vibration and Acoustics 119(4): 624–628. https://doi.org/10.1115/1.2889772 Wang FJ (2004) Computational fluid dynamics analysis-CFD software principle and Application. Tsinghua University Press, Beijing, 120–125 Wang YY, Luo WZ, Li JH (2022) Study on real-time prediction of punch-through of spudcan foundation. The Ocean Engineering 40(3): 10–21. https://doi.org/10.16483/j.issn.1005-9865.2022.03.002 Xie YC, Huang JT, Li XK, Tian XJ, Liu GJ, Leng DX (2021) Experimental study on hydrodynamic characteristics of three truss-type legs of jack-up offshore platform. Ocean Engineering 234: 109305. https://doi.org/10.1016/j.oceaneng.2021.109305 Yang RQ, Wang HB, Chen CH (2022) Optimal design of the superstructure of an offshore tourism platform by using numerical simulation. Journal of Marine Science and Application 21: 128–137. https://doi.org/10.1007/s11804-022-00297-4 Yu H, Li XY, Yang SG (2012) Dynamic analysis method of offshore jack-up platforms in regular and random waves. Journal of Marine Science and Application 11(1): 111–118. https://doi.org/10.1007/s11804-012-1112-7 Zhao TF, Sun CM (2014) A new spudcan with buoyancy modules for mobile jack-up rigs. Applied Ocean Research 47: 154–161. https://doi.org/10.1016/j.apor.2014.05.003 Zhao YN, Cheng ZS, Sandvik PC, Gao Z, Moan T, Buren EV (2018) Numerical modeling and analysis of the dynamic motion response of an offshore wind turbine blade during installation by a jack-up crane vessel. Ocean Engineering 165: 353–364. https://doi.org/10.1016/j.oceaneng.2018.07.049
