
Structural Design and Parameter Analysis of Ship Inlet Distortion Simulation Boards
https://doi.org/10.1007/s11804-024-00399-1
-
Abstract
Significant aerodynamic engine instability can occur during the operation of marine gas turbines as airflow enters the compressor through a 90° turning and causes inlet distortion. This study adopts the method of simulating board equivalence to provide the target distortion flow field for ship compressors. The characteristics of the flow field behind the simulated board are obtained through experiments and numerical simulations, through which the relationship between the height of the simulated board and the total pressure distortion is elucidated. Subsequently, the study summarizes the prediction formula to achieve a distortion prediction of 0.8%–7.8%. In addition, this work analyzes the effects of drilling methods and diameters on flow nonuniformity by drilling holes into the simulation board. The results indicate that drilling holes on the board can weaken the nonuniformity of the flow field within a certain range and change the distribution pattern of total pressure in the cross-section. Furthermore, the total pressure distortion no longer changes significantly when the number of holes is too large. The proposed double simulation board structure is capable of obtaining the following two types of distorted flow fields: symmetrical dual low-pressure zones and low-pressure zones with high distortion intensity at the compressor inlet. The distortion equivalent simulation method proposed in this work can obtain various types of distortion spectra, thereby meeting the distortion parameter requirements for the antidistortion testing of marine engines.Article Highlights● Measure the aerodynamic parameters of the key section of the engine intake air.● Analysis of flow field and distortion index under different simulation board parameters.● Ω criterion as an auxiliary method for vortex analysis of distorted flow fields. -
1 Introduction
Modern ship performance is significantly influenced by the engine system. Hence, the steady and safe operation of the engine has become a key factor in the design and use process. However, during actual operation, the engine often experiences an uneven inlet flow field resulting from the intake duct and external environment. This can cause changes in the velocity and pressure components at the compressor inlet and potentially alter the blade angle of attack, leading to a high-load blade stall and affecting the compressor's performance (Zhong et al., 2020; Zhang et al., 2022).
Strict ground test runs are required under various intake distortion conditions to evaluate the anti-distortion performance of a developed engine. However, the experimental equipment required for the direct joint testing of the intake system and engine is too complex; therefore, a total pressure distortion simulator is used to generate the required distortion flow for the experiment. At present, the commonly used total pressure distortion generator mainly installs turbulence control devices, such as simulation boards, simulation nets, and insertion boards, in front of the engine, typically using wake mixing to generate total pressure distortion. Related to this, precise and adjustable distortion generation technologies must be developed to accurately obtain the performance parameters of the engine under various intake distortion states. This will require the study of the mechanism and variation rules of distortion generation, ultimately providing important references for improvement in the design of distortion generators.
The design of pressure distortion simulation devices for engine distortion resistance tests has been a topic of interest among foreign scholars for a long time. Initial studies conducted by NASA (Baumbick, 1970; Braithwaite et al., 1970) utilized air jets to generate rapid pressure oscillations for distortion simulation. Later scholars used various structures, such as slat, round rod, variable lip bar, adjustable angle hyperboloid, split wing structure and simulation network (Chen et al., 1992; Chen et al., 1990; Cousins et al., 2003; Hirschmann et al., 2012; Savage et al., 2004; Beale et al., 2002; Walter and Justin, 2013), and then combined these with numerical simulation methods (Castro and Robins, 1977; Sakamoto et al., 1982; Mukhopadhyay et al., 1992; Martinuzzi and Tropea, 1993; Rodi, 1997) to achieve inlet distortion simulation. Beale et al. (2006; 2007) analyzed the advantages and disadvantages of different distortion simulation devices, identified issues in their development and use, and designed an adjustable distortion simulation device. To realize the simulation of specific distortion patterns, Yusoof et al. (2015) combined Beale's distortion simulation device with the wake superposition formula to study the influence of the shape of flat and relative positions between different flats on the subsequent flow parameters.
In contrast, China and Russia commonly use the insert board method alongside engine inlet flow field distortion evaluation to design total pressure distortion simulators (Liu et al., 1994). Scholars (Cang et al., 2000; Jiang et al., 2007; Jiang et al., 2008; Jiang et al., 2009; Zhu et al., 2014; Wang et al., 2015; Zhang et al., 2019; Liu et al., 2022b) conducted experimental and simulation studies on the insert board distortion simulator, analyzing the flow field after the insert board to obtain an approximate linear relationship between the high and low-pressure distribution behind the board and the reduced flow rate. The depth of the insert board affects the range of the low-pressure zone and the circumferential distribution of turbulence; furthermore, compressor-induced stall mechanisms also change due to the insertion method. Meanwhile, various structures, such as variable combinational baffles, lunette-shaped flat baffles, movable flat baffles, and triangle boards, have been proposed for pressure distortion simulation (Li et al., 2009; Zhang et al., 2017; Peng et al., 2018; Ning et al., 2023; Zhou et al., 2023). These were combined with new simulation models, such as unsteady calculations and hybrid RANS/LES methods, to further analyze the effects of inlet Mach number and plate parameters on the flow along the pipeline (Iaccarino et al., 2003; Mankbadi and Georgiadis, 2015; Liu et al., 2021; Liu, 2021; Liu et al., 2022a). In addition, Ye et al. (2001) proposed a semiempirical and semimathematical simulation method using simulation board technology.
To date, compressor inlet distortion research has mainly focused on the aviation industry. This article selects a simulation board as the equivalent simulation method for total pressure distortion and investigates the characteristics of inlet distortion in marine compressors. By combining both numerical simulation and experiments to collect and analyze flow field data under different simulation board parameters. This study also summarizes the relationship between simulation board parameters and total pressure distortion, proposes a design method for simulation boards in compressor ground distortion tests in order to address the required inlet distortion, and provides assistance and support for future related ship distortion tests.
2 Modeling and simulation board parameters
2.1 Distortion equivalent simulation model
This study selected the intake structure of a small surface ship compressor, as described by Shi (2003), as the research object. The selection was made based on the actual structure of the inlet section of a marine compressor. The structural parameters of the compressor inlet cowl and intake channel were extracted, and a simulation model was established at a 1∶2 scale reduction. The computational domain in the simulation includes the intake channel, simulation board, inlet cowl, and compressor inlet section, as shown in Figure 1. The diameter of the intake channel was 365 mm, and the distance between the installation position of the simulation board and the inlet and intake hood was represented by D and 2D, respectively.
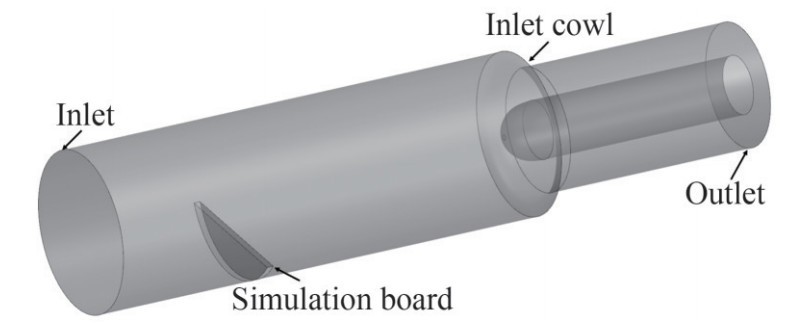 Figure 1 Distortion equivalent simulation model
2.2 Grid and boundary conditions
Using the ICEM CFD tool module, the computational domain was divided into unstructured grids to simulate the flow field accurately. The grid division result is shown in Figure 2. These grids were encrypted in key measurement segments and in smaller parts of the structure. An analysis of the flow state in the computational domain reveals that the mainstream with Re > 1×10⁴ is a fully turbulent state. Moreover, the flow becomes compressible in the area behind the plate, where Ma > 0.3. Using ANSYS Fluent software, the Reynolds averaged Navier-Stokes equations were solved to accurately determine the flow characteristics. A two-equation k − ε turbulence model was employed to meet the necessary accuracy requirements. The density of the boundary layer grid was increased to ensure that its y+ value falls within the range of 30–100 to obtain accurate results. The inlet was given the total pressure and temperature of the incoming flow, and the outlet was given the target flow rate. Using the same grid partitioning scheme to encrypt the grids of each component, a total of five types of grids were employed for grid independence verification. As shown in Figure 3, selecting the grid scheme 3 of 1.1 million grids can meet the accuracy requirements of simulation calculations.
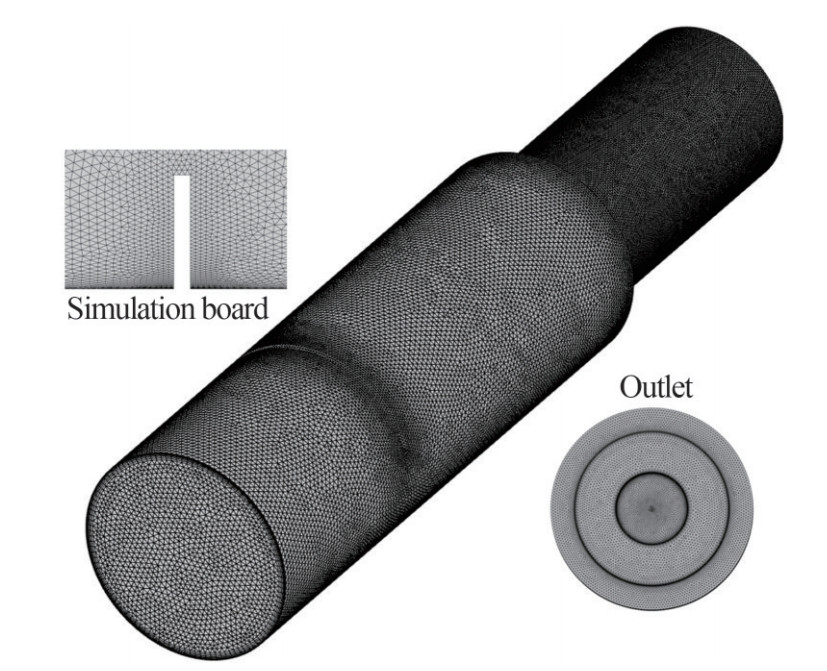 Figure 2 Model grid division
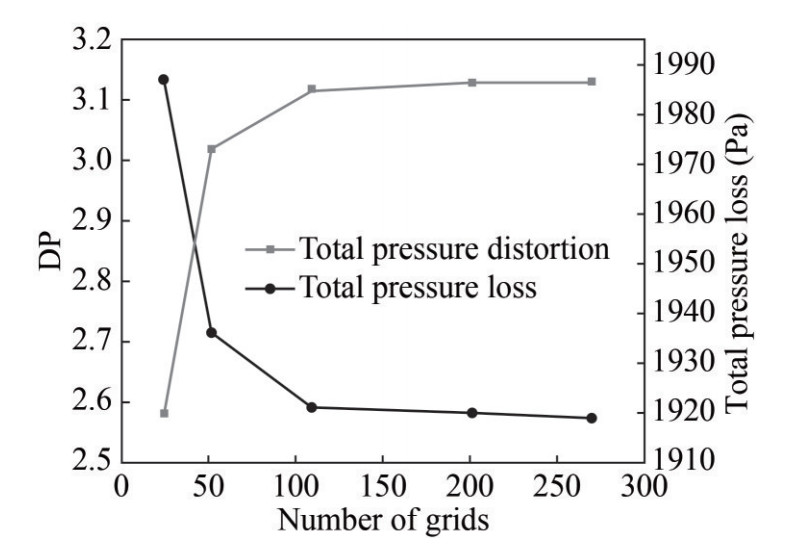 Figure 3 Grid independence verification
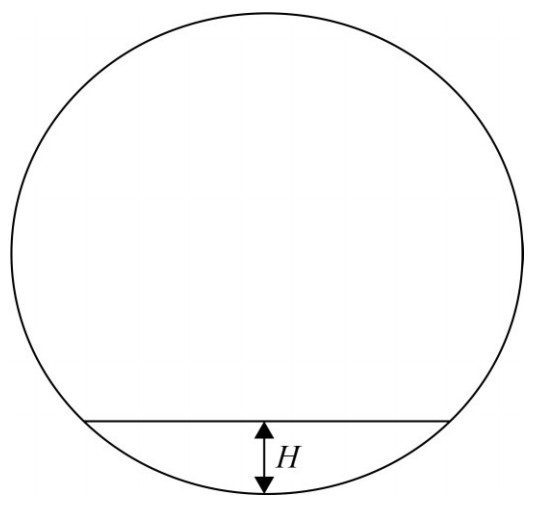 Figure 4 Simulated board height
2.3 Simulation board parameters
In order to obtain sufficient types of distortion patterns, the parameters of the simulation board must be changed and designed in such a way that the impact on the flow field can be analyzed. Parameters such as the height of the simulation board, hole drilling on the board, and double simulated boards are selected to conduct research and summarize the influencing rules of each parameter on the flow field. The maximum distance from the upper edge of the board to the inlet wall is defined as the simulation board height H. Meanwhile, the dimensionless parameter h is obtained by the ratio of the simulation board height H to the inlet diameter D. The influence of this parameter on the compressor inlet distortion is analyzed by changing the number and diameter of holes drilled on the simulation board. The equivalent simulation method of double simulated boards is used to obtain different types of total pressure distortion spectra. Furthermore, the influence of changing the angle between the two boards on the flow field is investigated and compared with a single simulated board to summarize its applicability. Finally, a reasonable and feasible design scheme for the total pressure distortion equivalent simulation board is proposed based on the summarized influence of various parameters on the flow field.
2.4 Research parameters
Two dimensionless parameters, velocity nonuniformity and total pressure distortion, were defined for quantitative analysis, which allowed us to evaluate the distortion degree of the flow field at the inlet of the compressor. The nonuniformity of velocity is defined as the ratio of the speed extreme value difference and the average velocity in the 5% local area with the highest nonuniformity of velocity, and the calculation method is shown in Eq. (1).
$$\delta=\max \left[\frac{V_{i(5 \%) \max }-V_{i(5 \%) \min }}{\bar{V}_{i(5 \%)}}\right] $$ (1) In the formula, Vi(5%) is the weighted average speed of 5% local flow area, and Vi(5%)max is the maximum speed in the 5% local flow section.
In accordance with the actual situation of marine gas turbines, a scheme for the calculation of total pressure distortion is proposed to quantitatively study the nonuniformity of the pressure field. The total pressure distortion is defined as the ratio of the difference between the minimum average pressure in a 60° sector and the average total pressure on the section to the average total pressure on the section. The calculation method is shown in Eq. (2).
$$ \mathrm{DP}=\frac{\bar{P}-\bar{P}_{i(60) \min }}{\bar{P}} $$ (2) The simulation board installed in the flow channel will block the airflow and form a vortex structure. Thus, the Ω vortex identification method proposed by Liu et al. (2021) was adopted to clearly observe the changes in the vortex structure. This method addresses the issue of adjusting the threshold in the second-generation vortex recognition method by decomposing the vorticity into rotating and non rotating parts thereby fixing the threshold. The calculation formula is as follows:
$$ \mathit{\Omega}=\frac{\|B\|_F^2}{\|A\|_F^2+\|B\|_F^2+\varepsilon} $$ (3) To prevent the denominator from being zero, add ε:
$$ \varepsilon=0.002 Q_{\max }=0.01\left(\|B\|_F^2-\|A\|_F^2\right)_{\max } $$ (4) Next, select an empirical value of 0.52 through experiments for vortex identification:
$$ \mathit{\Omega}>0.52 $$ (5) 3 Verification of simulation methods
3.1 Distortion equivalent simulation test bench
A distortion equivalent simulation experiment is performed using a simulated board design to validate the accuracy of the numerical simulation results. In particular, the distortion equivalent simulation test bench is designed using the low-speed wind tunnel of the purification and separation laboratory. The twisted pair flowmeter is used at the inlet of the test bench. This consists of several components, such as a temperature sensor PT100, differential pressure transmitter MG2000, absolute pressure transmitter 3 351, and flow totalizer F2000X. The test flow is calculated by measuring inlet static pressure, atmospheric pressure, and total temperature. The airflow then passes through a stable pressure box with a contraction ratio of 1∶3, generating a uniform and stable flow field that meets the experimental requirements. The experimental section is equipped with a simulation board replacement device, a compressor inlet cowl, and a measurement system. Figures 5 and 6 depict the overall structure of the distortion equivalent simulation test bench, while Figure 7 shows the simulation board replacement devices used in the experiment.
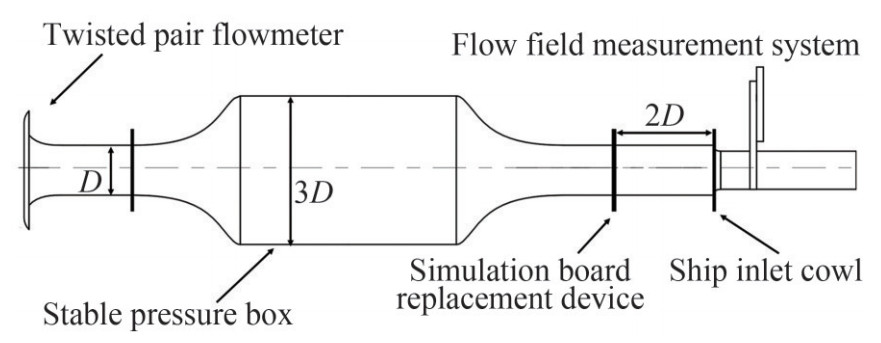 Figure 5 Distortion equivalent simulation test bench (schematic diagram)
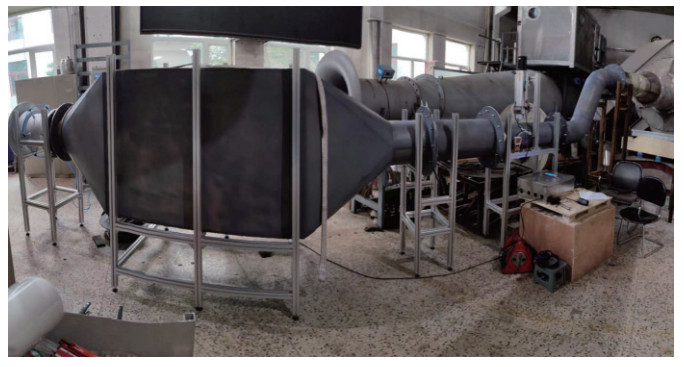 Figure 6 Distortion equivalent simulation test bench (actual diagram)
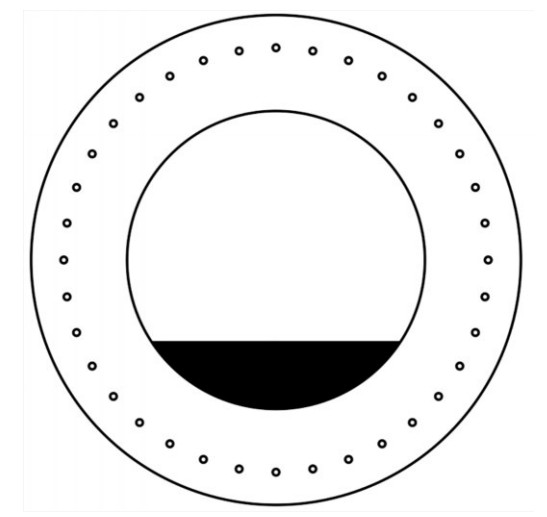 Figure 7 Simulation board replacement device
3.2 Measurement instrumentation and data acquisition
A measurement system was installed in the experimental section to measure the flow field distribution at the inlet of the compressor. This consists of a total pressure probe, a one-dimensional radial displacement mechanism, and a wind speed measuring instrument. The measurement section was positioned 250 mm away from the outlet of the intake fairing, with an outer diameter of Dout=278 mm and an inner diameter of Din=131 mm. The total pressure probe's radial position was altered using a displacement mechanism, after which an anemometer collected and analyzed the flow field parameters at five radial measurement points, resulting in a measurement error of less than 1%. Following the radial measurement, data from 90 measurement points were collected by rotating the simulation board replacement device, enabling the analysis of the total pressure distortion of the compressor inlet flow field.
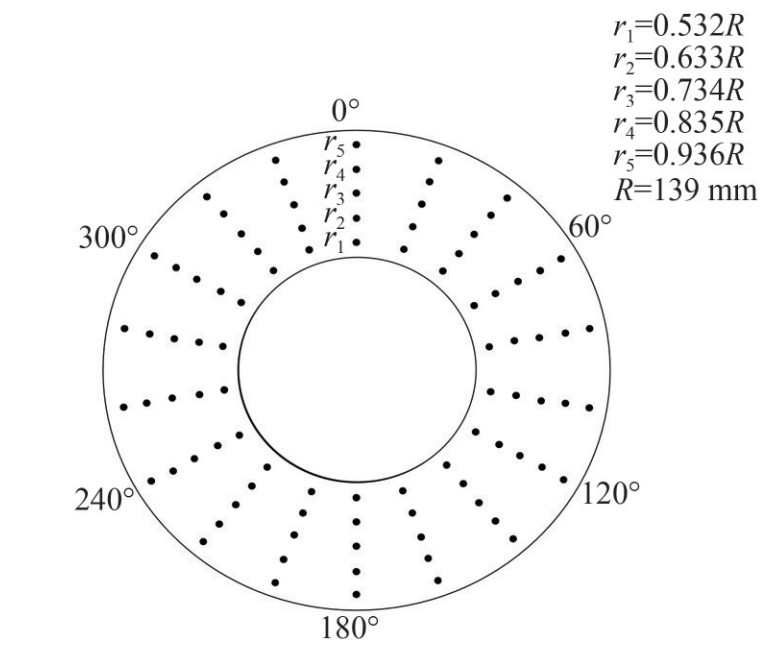 Figure 8 Measurement point distribution
3.3 Result comparison
Eq. (6) is used to process the data of 90 measuring points of the compressor inlet section.
$$ \frac{1}{2} v^2=\frac{k R T}{k-1}\left[1-\left(\frac{P_s}{P_T}\right)^{\frac{k-1}{k}}\right] $$ (6) The calculated velocity nephogram of the compressor inlet surface is shown in Figure 9, which is basically the same as the simulation results. The less than 3% error between the simulated and experimental values of the average velocity and velocity distortion of the cross-section indicates that the numerical simulation scheme is reasonable and feasible. Furthermore, the numerical simulation calculation results are reliable.
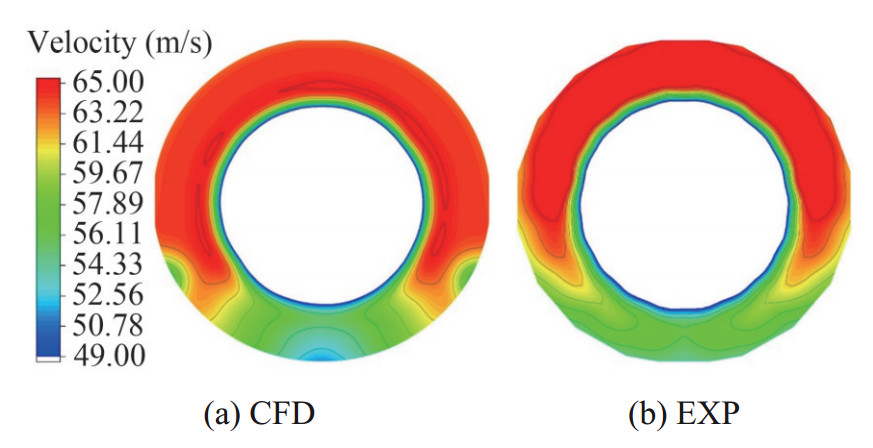 Figure 9 Verification of the simulation resultsTable 1 Test and simulation results
Result VAIP (m/s) δ EXP 61.73 10.10% CFD 60.83 10.38% Error(σ) 1.48% 2.77% 4 Simulation results and analysis of flow field on simulation boards
4.1 Analysis of the simulation board height calculation results
Next, we took the simulation board with a height of h= 0.25 as an example and then analyzed the variation law of the distorted flow field after the board was obstructed. Figure 10 shows the distribution of Ma along different cross-sections of the flow and the three-dimensional (3D) streamline of the airflow. After being obstructed by the simulation board, the uniform upstream flow is observed to decrease in the flow area. Part of the airflow bypasses the simulation board to form a high Mach number zone. In turn, the high Mach number velocity initially increases and then decreases, reaching Ma of 0.4 at the cross-section located 200 mm behind the simulation board. At the same time, the obstruction of the simulation board results in the formation of a strong and large area of low-speed reflux zone behind the board. Although the airflow in this area gradually mixes with the mainstream, there is still reflux, which is present before the inlet cowl. The range of the low-velocity zone decreases following the rectification of the airflow by the inlet cowl, after which the flow nonuniformity zone is mainly observed in the corresponding area of the simulation board.
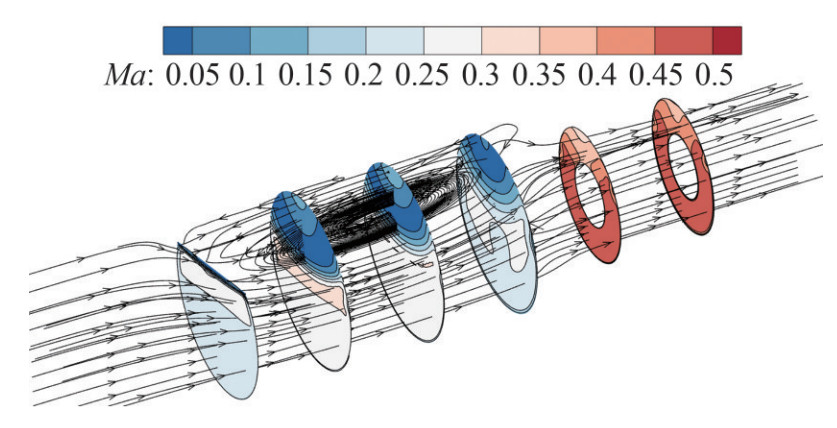 Figure 10 Section Ma distribution and three-dimensional streamlines
Next, an analysis of the total pressure, velocity, and streamline diagram of the symmetrical plane of the inlet is conducted to gain a comprehensive understanding of the mainstream structure after the simulation board. Figures 11 and 12 show the stagnant reflux in front of the simulation board when the mainstream flows through the simulation board; however, its influence area is small and does not affect the downstream flow of the simulation board. The airflow forms generate strong distortion through the simulation board, forming a large area of low-speed vortex behind the board. The flow velocity around the periphery of the vortex is relatively high, while the internal flow velocity of the vortex is only 0.05Ma. During this process, a significant drop in total pressure occurs from 101 to 94 kPa. Total pressure gradually recovers as the airflow continues to flow and develop; however, such pressure remains significantly lower than the inlet pressure. A fraction of the airflow bypasses the simulation board and forms a high-speed flow zone and a transition zone downstream, wherein the total pressure changes less. However, there is a radial velocity when the airflow bypasses the simulation board. The flow area in the high-speed zone behind the board decreases first and then increases, after which the airflow accelerates until it reaches the maximum velocity of 0.4Ma downstream of the simulation board. Viscous effects on the wall, airflow mixing, and momentum transfer lead to the blurring of the boundary between high and low-pressure areas, expansion of the transition zone, and gradual reduction of nonuniform total pressure distribution along the flow cross-section. Furthermore, the inlet cowl has a rectifying effect on the nonuniform upstream flow, effectively reducing the nonuniformity of the flow; however, there remains a distortion zone at the corresponding position of the simulation board. A circumferential total pressure distribution on the inlet surface of the compressor is shown in Figure 13. As can be seen, the average pressure on the inlet surface of the compressor is 99.8 kPa. The low-pressure area is primarily in a fan-shaped region of 120° to 260°, with an average pressure of 96.6 kPa.
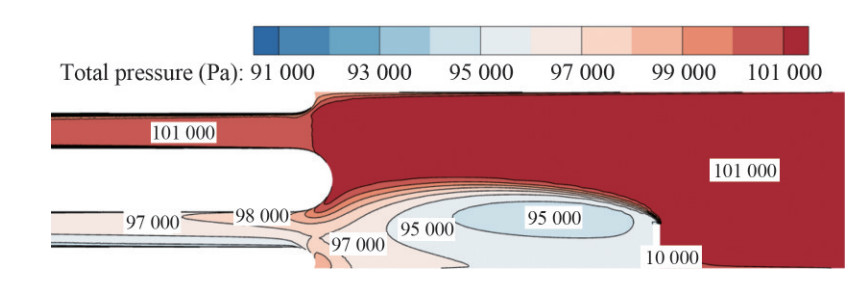 Figure 11 Symmetric plane total pressure diagram
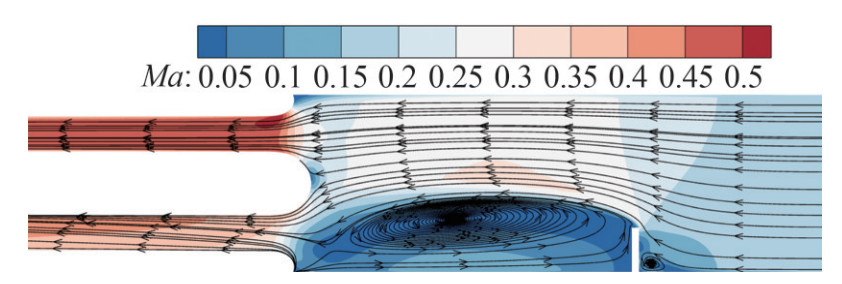 Figure 12 Symmetric plane Ma and streamline diagram
 Figure 13 Circumferential total pressure distribution at the compressor inlet
Figure 14 presents the results of processing the flow field of the simulated board using the Ω criterion. As shown in the figure, the airflow in front of the simulated board produces a stagnation point on its upstream surface. A fraction of the airflow flows toward the pipe wall, creating corner vortices at the intersection with the simulated board, thereby inducing flow losses. As the flow develops, the corner vortices remain separated from other vortex structures and gradually dissipate. The development distance positively relates to the simulated board's height h. As the other portion of the airflow passes through the insertion board, it is impacted by shear forces, thus producing separated vortices. The range and placement of the vortex structure correspond to the low-speed reflux zone behind the board. After passing through the inlet cowl, the vortex structure mainly appears at the corresponding position of the simulation board. At this stage, due to airflow mixing and momentum transfer, the pressure distribution in the intake section becomes more uniform, and the range and intensity of the vortex decline. An analysis indicates that zones with a larger Ω value align with low-speed flow areas. For assessing the flow field's nonuniformity, eddy currents and flow parameters relate to one another as auxiliary parameters.
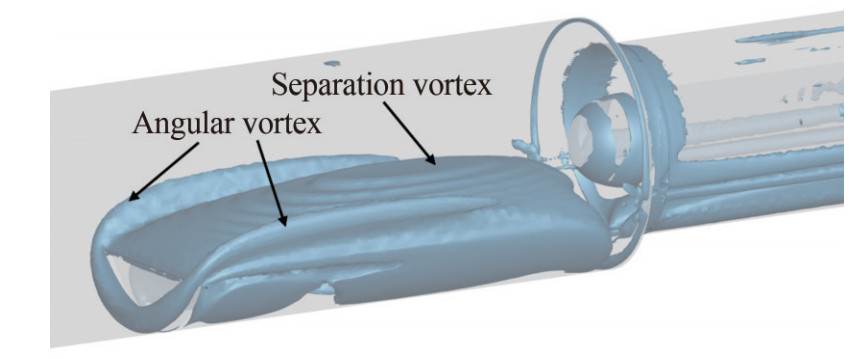 Figure 14 Ω-criterion vortex analysis
Upon analyzing the flow field, results show that a high and low-pressure zone develops behind the simulated board. The range of influence at the junction of the simulation board and the intake section wall increases as the relative depth h of the simulation board increases, resulting in a rapid decrease in the corresponding pressure in the low-pressure zone. Furthermore, the increase in h leads to increased flow blockage, causing an increase in losses. This, in turn, results in an increase in the range of low-pressure areas and a rise in flow nonuniformity. The value of h is positively correlated with the total pressure distortion at the compressor inlet. A relationship between h and DP has been established based on the research findings, and a prediction formula has been obtained (Figure 15). The flow simulation results conducted on simulated boards with h= 0.146 and h=0.196 show a comparison error of DP less than 2%. This result demonstrates the accuracy of the prediction formula in predicting total pressure distortion DP. Consequently, this formula can be used to quickly obtain the simulation board depth that is required for the compressor distortion test before conducting the test.
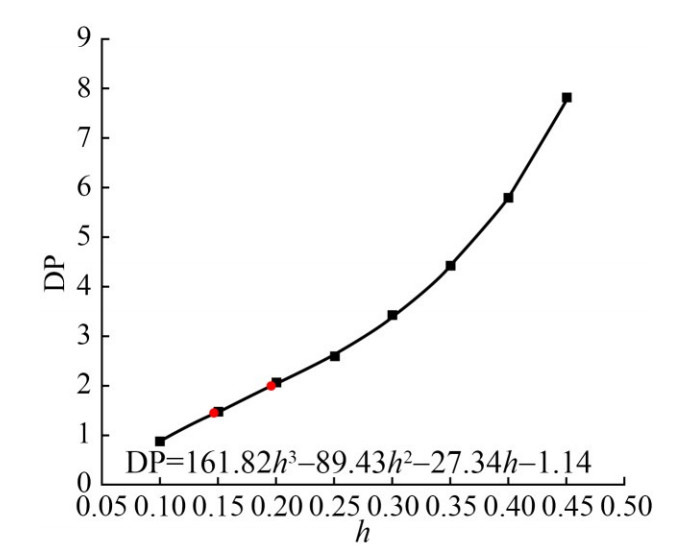 Figure 15 Fitting relationship between h and DP
4.2 Analysis of drilling method calculation results
Multiple types of distortion patterns are required for compressor antidistortion testing, and using a flat panel simulation board cannot meet all design requirements. Based on the target pattern, holes can be opened at appropriate positions on the simulation board after obtaining the distortion pattern of the flat panel simulation board, and this reduces the obstruction effect of the insertion board on the airflow. The drilling parameters studied in this article are porosity and hole diameter, in which porosity is achieved by changing the number of holes drilled. Four drilling methods are designed, including four, six, and eight holes, and one side with four holes. Based on the 8-hole drilling method, five simulations were conducted by changing the hole diameter, ranging from 5 to 25 mm.
Figures 17 and 18 depict the total pressure, Ma, and streamline characteristics of the symmetrical plane of an 8-hole simulation board. The low-pressure reflux zone behind the simulation board is mixed with the stagnant reflux generated by the main flow in front of the simulation board through the hole. The fluid in front of the board forms a high-pressure and high-speed jet through the hole, thus changing the low-speed reflux vortex structure behind the board and forming two independent reflux zones behind the hole. The combination of the high-pressure airstream and low-energy fluid behind the board decreases the low-pressure zone's area, reducing the overall pressure distortion of the flow field located behind the board. At the same time, the stagnant fluid in front of the board continues to flow through the hole, reducing the airflow flow rate that bypasses the simulation board, along with the flow rate in the high-speed zone not affected by the simulation board decreases. This reduces the difference between the high-speed area and the low-velocity zone behind the board and enhances the flow field's uniformity. In this case, increasing the hole's diameter can increase the airflow rate entering the board through the hole, further improving the uniformity of the simulated flow field behind the board.
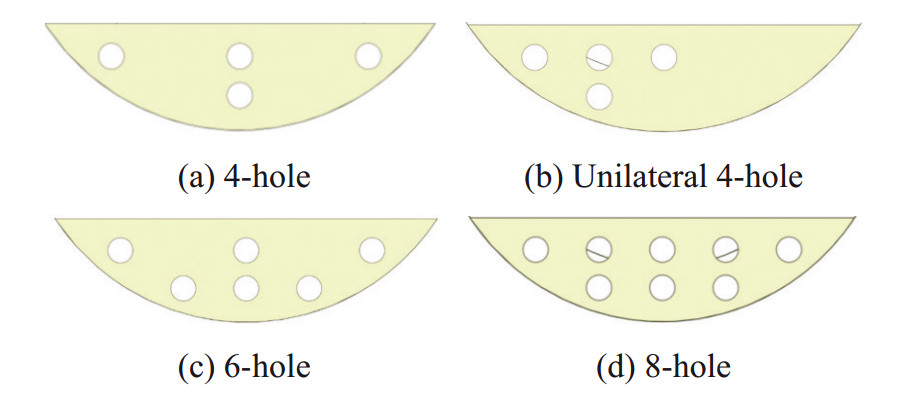 Figure 16 Drilling method
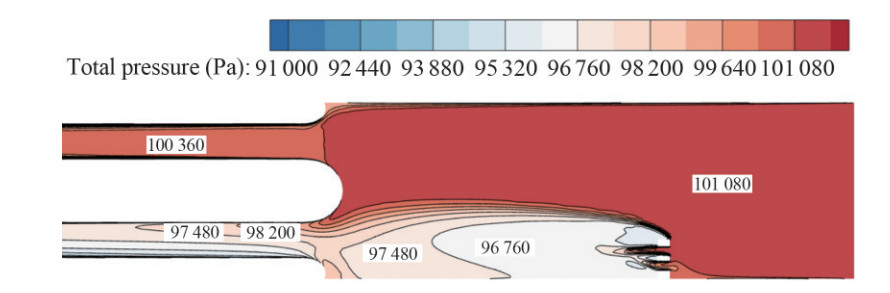 Figure 17 Total pressure diagram of the drilling simulation board symmetry plane
 Figure 18 Drilling simulation board symmetry plane Ma and streamline diagram
Figures 19 and 20, respectively, depict the circumferential distribution of total pressure and total pressure distortion at the compressor inlet, with different drilling methods and drilling diameters. The results suggest that the structure of the low-pressure reflux vortex behind the simulation board changes significantly when the simulation board is drilled. The circumferential high-pressure distribution of the flow remains relatively unchanged as it continues to develop to the inlet of the compressor. The drilling leads to an increase in total pressure in the low-pressure region and a decrease in the amplitude of total pressure fluctuations, resulting in a reduction in compressor inlet total pressure distortion. Specifically, the DP of a drilled simulation board with four holes is 4.6% lower than that of a nondrilled board. As the number of perforations further increases, the amplitude of DP change weakens, and the DP of 6 and 8 holes becomes the same. This result indicates that excessive drilling does not necessarily increase the uniformity of the flow field. Although drilling on one side of the simulation board enhances the uniformity of the flow behind the board, the distribution of total circumferential pressure at the compressor inlet changes, in which case the circumferential pressure on the drilling side becomes significantly lower than that on the other side. When changing the drilling diameter under the same drilling method, the high-speed jet entering the board through the hole increases as the drilling diameter increases; furthermore, the total pressure value in the low-pressure area of the compressor inlet increases. In addition, the flow nonuniformity behind the board weakens, and the total pressure distortion at the compressor inlet decreases. Based on the above analysis, the total pressure distortion at the compressor inlet can be changed within a certain range by altering the drilling method and diameter of the simulation board. Furthermore, the irregular drilling distribution can change the distribution pattern of the total pressure at the compressor inlet.
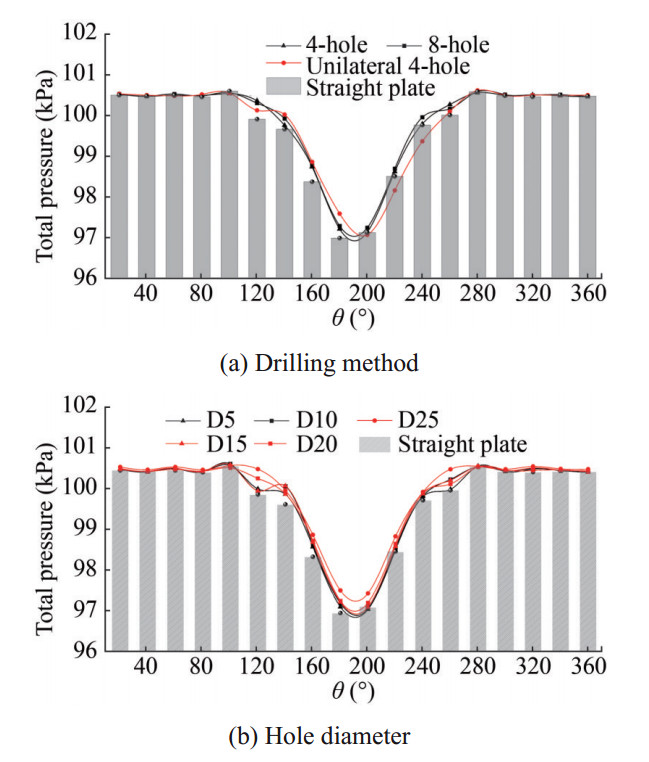 Figure 19 Circumferential total pressure distribution of the drilling simulation board
 Figure 20 DP of different drilling methods
The number of inlet channel interpolation boards is increased following the single board distortion equivalent simulation method, and a structure consisting of adjacent double boards and symmetrical double boards is adopted (Figure 21). As can be seen, the dimensions of the double boards in the channel are identical, and four sets of simulated boards with different angles (θ =90°, 105°, 120°, and 135°) are used as research objects to analyze the impact of different installation positions of the double boards on the flow field.
 Figure 21 Double simulation boards
4.3 Analysis of the simulated board structure calculation results
Ma cloud maps and surface streamline maps of the symmetrical plane of the flow channel are presented in Figure 22 to help us gain a detailed understanding of the flow structure in a channel with different simulation board structures. As shown in the figure, the symmetrical plane of the flow channel is perpendicular to the insertional board in the single board and symmetrical double board structures. The airflow forms a stagnation point on the simulation board, and part of the airflow bypasses the simulation board to enter the downstream and form a high-speed zone and transition zone. Meanwhile, another side of the airflow forms a low-speed vortex behind the board. The obstruction caused by the board leads to the formation of two symmetrical low-velocity zones above and below the flow channel in the symmetrical double board structure, along with a high-speed flow region in the middle of the flow channel. A transition region is also observed with a large velocity gradient between the high-speed region and the low-velocity zone. The existence of radial velocity when the gas bypasses the simulation board causes the area of the high-speed zone behind the board to decrease first and then increase. Meanwhile, the gas flow continues to accelerate after the board, reaching 0.3Ma, which is significantly higher than that of the single simulation board. The symmetrical plane in the adjacent double board structure is the cross-section between the two boards, and the airflow is not obstructed by the simulated board at the section. As the low-speed reflux zone formed by the obstruction of the simulation board in the adjacent circumferential area is continuously mixed with the mainstream of this section, this leads to the formation of reflux vortices from the near-wall area. The strength and range of the initially formed vortices are significantly smaller than those of other simulated board structures. As the flow develops, the vortices formed after the two simulated boards continue to mix and merge at this cross-sectional position to form a stronger vortex structure. Finally, the area of the low-velocity zone in front of the fairing becomes larger than that of other simulation board structures.
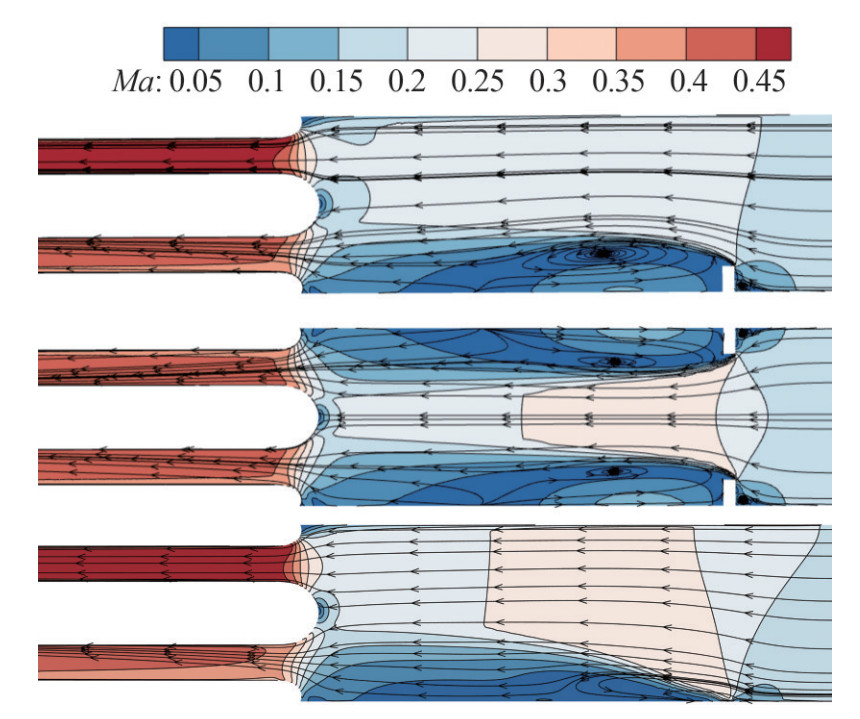 Figure 22 Total pressure diagram of different simulation board structures
Figure 23 illustrates the total pressure cloud diagram at the compressor inlet for various simulated board structures. As shown in the figure, the double board symmetric structure generates two symmetrical low-pressure zones at the top and bottom, respectively. The flow loss escalates due to the increased obstruction effect on the airflow caused by the double boards, thereby leading to a decrease in the total pressure at the compressor's inlet. The distribution pattern of the single low-pressure zone is the same as that of the single board. The low-velocity zone behind the two simulation boards gradually mixes with the development of the flow passage in the adjacent double board structure, eventually forming a low-speed zone with a larger influence range and intensity. This results in the increase of the inlet nonuniformity of the compressor.
 Figure 23 Total pressure diagram of compressor inlet with different simulation board structures
In Figure 24, the total pressure distortion at the compressor inlet for various simulated board structures is demonstrated. The total pressure distortion in this study reflects the difference between the 60° sector with the lowest average total pressure value and the surface average pressure. The distribution pattern of the low-pressure region between the single board and the symmetrical double board is identical. However, the double board yields higher total pressure loss than the single board, resulting in a reduction in the difference between the distorted low-pressure area and the surface average pressure. Furthermore, the DP of the symmetrical double board at the compressor inlet is slightly smaller than that of the single board. Thus, the distortion zone of adjacent double boards at the compressor inlet is formed due to the low-velocity zone behind the two simulation boards gradually mixing with the development of the flow passage, and their total pressure distortion is significantly greater than other structures.
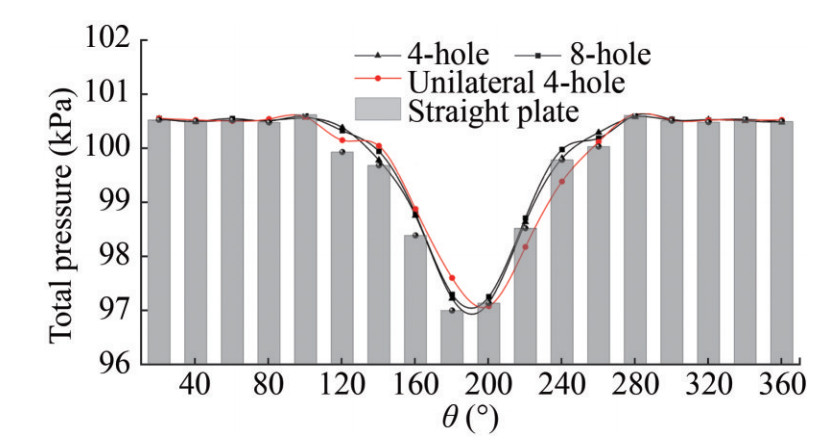 Figure 24 DP of different simulated board structures
5 Conclusions
This article investigates the equivalent method for the inlet distortion of marine gas turbines, presenting a detailed analysis of the effects of various simulated board parameters, such as height, drilling method, and double board structure, on the flow field and total pressure distortion through numerical simulation and experimental research. From the study, the following conclusions can be drawn:
1) The height of the simulation board h is positively correlated with the compressor inlet distortion DP. Based on the simulation results, the relationship between h and DP is summarized. The results indicate that the predicted DP error through this relationship is less than 2%, which can achieve rapid prediction of compressor inlet total pressure distortion.
2) Drilling holes on the simulation board can reduce the total pressure distortion at the compressor inlet; however, this impact weakens as the number of holes increases. Altering the drilling position can change the distribution pattern of circumferential total pressure. Furthermore, increasing the drilling diameter can effectively reduce flow nonuniformity.
3) Compared with a single simulation board, the symmetrical double board structure forms two symmetrical low-pressure regions with the same distribution pattern at the compressor inlet, resulting in slightly lower total pressure distortion. In addition, a low-pressure region with a large influence range and strength is formed due to the complete mixing of the low-pressure area behind adjacent double-board structural boards at the compressor inlet forms. This phenomenon results in significantly greater total pressure distortion than other structures.
4) Based on the target distortion combined with the prediction formula, the equivalent simulation design for ship distortion can obtain the corresponding simulation board height. Furthermore, the flow field can be adjusted by changing the drilling method. Different double board structures can also be used to change the strength and distribution of the low-pressure zone, thus achieving equivalent simulation of different types of distortion patterns.
Competing interest Zhongyi Wang is an editorial board member for the Journal of Marine Science and Application and was not involved in the editorial review, or the decision on publish this article. All authors declare that there are no other competing interests. -
Figure 1 Distortion equivalent simulation model
Figure 2 Model grid division
Figure 3 Grid independence verification
Figure 4 Simulated board height
Figure 5 Distortion equivalent simulation test bench (schematic diagram)
Figure 6 Distortion equivalent simulation test bench (actual diagram)
Figure 7 Simulation board replacement device
Figure 8 Measurement point distribution
Figure 9 Verification of the simulation results
Figure 10 Section Ma distribution and three-dimensional streamlines
Figure 11 Symmetric plane total pressure diagram
Figure 12 Symmetric plane Ma and streamline diagram
Figure 13 Circumferential total pressure distribution at the compressor inlet
Figure 14 Ω-criterion vortex analysis
Figure 15 Fitting relationship between h and DP
Figure 16 Drilling method
Figure 17 Total pressure diagram of the drilling simulation board symmetry plane
Figure 18 Drilling simulation board symmetry plane Ma and streamline diagram
Figure 19 Circumferential total pressure distribution of the drilling simulation board
Figure 20 DP of different drilling methods
Figure 21 Double simulation boards
Figure 22 Total pressure diagram of different simulation board structures
Figure 23 Total pressure diagram of compressor inlet with different simulation board structures
Figure 24 DP of different simulated board structures
Table 1 Test and simulation results
Result VAIP (m/s) δ EXP 61.73 10.10% CFD 60.83 10.38% Error(σ) 1.48% 2.77% -
Baumbrick RJ (1970) Device for producing dynamic distortion patterns at inlets of air-breathing engines. NASA-TM-X-2026 Beale D, Cramer K, King P (2002) Development of improved methods for simulating aircraft inlet distortion in turbine engine ground tests (Invited). 22nd AIAA Aerodynamic Measurement Technology and Ground Testing Conference, AIAA 2022-3045. DOI: 10.2514/6.2002-3045 Beale D, Davis M, Sirbaugh J (2006) Requirements and advances in simulating aircraft inlet total-pressure distortion in turbine engine ground tests. ASME Turbo Expo 2006: Power for Land, Sea and Air 42371: 25-36. DOI: 10.1115/GT2006-90038 Beale D, Wieland S, Reed J, Wilhite L (2007) Demonstration of a transient total-pressure distortion generator for simulating aircraft inlet distortion in turbine engine ground test. ASME Turbo Expo 2007: Power for Land, Sea and Air 4790: 39-50. DOI: 10.1115/GT2007-27222 Braithwaite WM, Dicus JH, Moss JE (1970) Evaluation with a turbofan engine of air jets 362 as a steady-state inlet flow distortion device technical memorandum. NASA TM-X-1955 Cang ZC, Jiang Y, Kong W, Zhang B, Zhang FQ, Li Jun, Zhuang CX (2000) Experimental study on the inlet total pressure distortion of a turbojet engine. Journal of Aerospace Power 15(4): 423-426. DOI: 10.13224/j.cnki.jasp.2000.04.019 (in Chinese) Castro IP, Robins AG (1977) The flow around a surface-mounted cube in uniform and turbulent streams. Journal of Fluid Mechanics 79(2): 307-335. DOI: 10.1017/S0022112077000172 Chen X, Mao J (1990) Technique of varying-lip simulation total pressure distortion flow field. Journal of Aerospace Power 5(1): 57-64. (in Chinese) DOI: 10.13224/j.cnki.jasp.1990.01.014 Chen X, Mao J (1992) Method of the combination of varying-lip and plate simulation total pressure distortion flow field. Acta Aeronautica et Astronautica Sinica 13(8): 418-422 (in Chinese) Cousins WT, Georges MJ, Rezaei H (2003) Inlet distortion testing and analysis of a high-bypass ratio turbofan engine. 16th International Symposium on Air Breathing Engines, ISABE-2003-1110 Hirschmann A, Volkmer S, Schatz M, Finzel C, Casey M, Montgomery M (2012) The influence of the total pressure profile on the performance of axial gas turbine diffusers. Journal of Turbomachinery 134(2): 021017. DOI: 021017. 10.1115/1.4003064 Iaccarino G, Ooi A, Durbin PA, Behnia M (2003) Reynolds averaged simulation of unsteady separated flow. International Journal of Heat & Fluid Flow 24(2): 147-156. DOI: 10.1016/S0142-727X(02)00210-2 Jiang Y, Zhang BL, Kong WD (2008) Statistical analysis of the aero-engine inlet air flow pressure distortion turbulence degree distribution using an inserted-board. Journal of Air Force Engineering University (Natural Science Edition) 9(1): 1-4. (in Chinese) Jiang Y, Zhang BL, Chen SG, Chen G, Mei F (2009) Test-based syntonic analysis of the aero-engine inserted-board inlet dynamic distortion pressure. Journal of Aerospace Power 24(9): 2057-2062. (in Chinese) Jiang Y, Zhang FQ, Zhang BL, Kong WD (2007) The inserted board air inlet flow steady pressure distortion field estimate based on experiment. Journal of Air Force Engineering University (Natural Science Edition) 8(2): 1-3. (in Chinese) Li L, Hu J, Wang ZQ, Tu BF (2009) Experimental study of inlet total-pressure distortion on four kinds of flat baffles. Journal of Aerospace Power 24(4): 925-930. (in Chinese) DOI: 10.1007/978-0-387-74660-9_12 Liu DX, Ye PL (1994) Guidelines for evaluating flow field distortion in russian engine imports. Gas Turbine Experiment and Research (3): 1-10. (in Chinese) Liu Y (2021) Research on the influence of double flat. Master thesis, Nanjing University of Aeronautics and Astronautics, Nanjing, 1-62. (in Chinese) Liu Y, Chen J, Huang GP (2022a) Study on stability and dynamic flow law of baffle in pipe. Machine Building & Automation 51(3): 125-129. (in Chinese) DOI: 10.19344/j.cnki.issn1671-5276.2022.03.031 Liu Z, Zhang S, Yin Y, Wang Z, Luan Y, Zhou S (2021) Research on thrust calibration technology of aeroengine indoor test bench. Journal of Applied Fluid Mechanics 15(1): 109-116. DOI: 10.47176/JAFM.15.01.32826 Liu ZH, Cai CY, He ZQ, Xu GL, Gao Lei, Yang LL (2022b) Inlet pressure distortion test of aeroengine under different plug. Aeroengine 48(3): 101-105. (in Chinese) DOI: 10.13477/j.cnki.aeroengine.2022.03.016 Mankbadi MR, Georgiadis NJ (2015) Examination of parameters affecting large-eddy simulations of flow past a square cylinder. AIAA Journal 53(6): 1706-1712. DOI: 10.2514/6.2014-2089 Martinuzzi R, Tropea C (1993) The flow around surface-mounted, prismatic obstacles placed in a fully developed channel flow. ASME Journal of Fluids Engineering 115(1): 85-92. DOI: 10.1115/1.2910118 Mukhopadhyay A, Biswas G, Sundararajan T (1992) Numerical investigation of confined wakes behind a square cylinder in a channel. International Journal for Numerical Methods in Fluids 14(12): 1473-1484. DOI: 10.1002/fld.1650141208 Ning H, Hou AP, Zhang MM, Ren JQ (2023) Numerical simulation on combinational baffle with adjustable ratio of distortion indexes. Journal of Propulsion Technology 44(2): 49-57. (in Chinese) DOI: 10.13675/j.cnki.tjjs.22010043 Peng SH, Zhong HG, Wu F (2018) Effect of movable flat baffle's plenum volume on pressure distortion flow field of engine. Journal of Aerospace Power 33(9): 2242-2247. (in Chinese) DOI: 10.13224/j.cnki.jasp.2018.09.022 Rodi W (1997) Comparison of LES and RANS calculations of the flow around bluff bodies. Journal of Wind Engineering and Industrial Aerodynamics 69-71(1): 55-75. DOI: 10.1016/S0167-6105(97)00147-5 Sakamoto H, Moriya M, Taniguchi S, Arie M (1982) The form drag of three-dimensional bluff bodies immersed in turbulent boundary layers. ASME Journal of Fluids Engineering 17(3): 358-363. DOI: 10.1303/aez.17.358 Savage K, Flandro G, Majdalani J (2004) Modeling and simulation of dynamic inlet flow distortion generation. 40th AIAA/ASME/SAE/ASEE Joint Propulsion Conference and Exhibit. DOI: 0.2514/6.2004-3933 Shi BL (2003) Inlet flow field study of marine gas turbine. Master thesis, Harbin Engineering University, Harbin, 1-110. (in Chinese) Walter F, Justin B (2013) The influence of duct development distance on screen-generated total pressure distortion profiles. 49th AIAA/ASME/SAE/ASEE Joint Propulsion Conference, 2013-3602. DOI: 10.2514/6.2013-3602 Wang YQ, Zhang J, Ye W (2015) Investigation of correlation laws between simulating board air blowing test results and numerical simulation results. Gas Turbine Experiment and Research 28(5): 24-28. (in Chinese) Ye W, Lu DY, Li D, Lu BF (2001) Design and experimental investigation of simulating plates. Gas Turbine Experiment and Research 14(2): 1-8. (in Chinese) DOI: 10.3969/j.issn.1672-2620.2001.02.001 Yusoof MS, Deshpande MD (2015) Strip distortion generator for simulating inlet flow distortion in gas turbine engine ground test facilities. Propulsion and Power Research 5(4): 287-301. DOI: 10.1007/978-0-387-74660-9_12 Zhang QW, Meng DJ, Chen YH (2022) Effects of pressure distortion on performance of three stage fan. Journal of Propulsion Technology 43(12): 116-125. (in Chinese) DOI: 10.13675/j.cnki.tjjs.210872 Zhang T, Zhao Yi, Zhao W, Chen BY (2017) Design and research of movable total pressure distortion generator. Journal of Propulsion Technology 38(12): 2706-2715. (in Chinese) DOI: 10.13675/j.cnki.tjjs.2017.12.009 Zhang XF, Li J, Song GX, Zhou YT, Xie H (2019) Numerical simulation on flat baffle inlet distortion of axial compressor. Journal of Aerospace Power 34(5): 1153-1165. (in Chinese) DOI: 10.10.13224/j.cnki.jasp.2019.05.022 Zhong YF, Ma HW, Li JY, Guo JD (2020) Technological progress of ground test measurement of aeroengine inlet total pressure distortion. Aeroengine 46(6): 62-77. (in Chinese) DOI: 10.13477/j.cnki.aeroengine.2020.06.011 Zhou W, Liu Y, Chen J (2023) Influence of measurement scheme on steady circum ferential distortion index for double flat generator. Machine Building & Automation 52(1): 75-79. (in Chinese) DOI: 10.19344/j.cnki.issn1671-5276.2023.01.018 Zhu AD (2014) Research on design technology of inlet total pressure distortion simulator. Master thesis, Nanjing University of Aeronautics and Astronautics, Nanjing, 1-58. (in Chinese)
