
Combustion Characteristics of Diesel/Butanol Blends Within a Constant Volume Combustion Chamber
https://doi.org/10.1007/s11804-023-00348-4
-
Abstract
In this paper, the spray and combustion characteristics of diesel/butanol-blended fuels were studied within a high-temperature and high-pressure constant volume chamber equipped with a single-hole injector. Two blends with 80% diesel/20% butanol and 60% diesel/40% butanol mixed by volume were tested in this study. The pure diesel B0 was also tested here as a reference. The spray penetration, flame lift-off length, and soot optical thickness were obtained through high-speed schlieren imaging, OH* chemiluminescence, and diffused back-illumination extinction imaging technique, respectively. The thermogravimetric curves of different fuels were obtained through a thermogravimetric analyzer. The results showed that butanol/diesel blends presented a longer ignition delay (ID) and flame lift-off length compared with pure diesel, and such finding was mainly caused by the lower cetane number and higher latent heat of vaporization of n-butanol. With the increase in the n-butanol ratio, soot production in the combustion process decreased significantly. Given the shorter ID period, the soot distribution of pure diesel reached a steady state earlier than the blends.Article Highlights● The spray and combustion characteristics of two blends with 80% diesel/20% butanol and 60% diesel/40% butanol and pure diesel were studied.● Three optical diagnostic methods were applied to analyze the spray characteristics and soot formation characteristics.● The spray penetration, ignition delay and flame lift-off length of three blended fuels were compared at different ambient temperatures or injection pressures.● The effects of butanol blending ratio on fuel evaporation characteristics and soot formation characteristics were studied. -
1 Introduction
Compressed ignition (CI) engines have been keeping a dominant position in propulsion systems (such as trucks, off-road vehicles, and ships) due to their high-power performance, fuel economy, and thermal efficiency. With the development of renewable energy applications, the CI engine will remain one of the critical power systems in the following decades. Especially for marine power systems, CI is difficult to be replaced with batteries in the short term due to low battery capacity and challenges for recharging. However, CI engines still face the challenges of increasing fuel efficiency and meeting strict emission regulations. Dealing with these challenges requires a thorough understanding of the spray and combustion process in the CI engine. The study of spray mainly includes the macroscopic characteristics of the spray and its emission. The emission of particulate matter (mainly soot) has harmful effects on the atmospheric environment and human health. Understanding the formation and oxidation of soot in spray flame can guide us to optimize the fuel structure and improve combustion conditions. One effective way to reduce soot emissions is to use clean alternative fuels. Bio-alcohols, which are derived from renewable sources, have drawn great attention from engine researchers because of their potential for clean combustion and easy application in CI engines. Butanol is one of the most popular alcohols. On the one hand, butanol can be blended with diesel in a wide range of ratios without layer separation. On the other, its diesel-like fuel properties make its application in CI engines disregard the need for large modifications (Yukio and Yoshihito, 1994; Zannis et al., 2004). However, the direct use of pure butanol in engines is difficult because of its low reactivity (Lü et al., 2004). Therefore, butanol is usually mixed with a cetane reinforcer or high-cetane fuel in engineering applications (Lapuerta et al., 2008).
Yao et al. (2010) studied the performance and emission characteristics of n-butanol diesel blends in a heavy-duty multi-cylinder direct injection diesel engine. The results showed that soot emission decreased significantly with the addition of n-butanol while keeping the NOx emission unchanged. The soot emission decreased further with the increased proportion of n-butanol in the blended fuel. Rakopoulos et al. (2010a, 2010b) studied the performance and exhaust emissions of n-butanol and conventional diesel blends on a four-stroke high-speed diesel engine. They observed that NOx and CO emissions decreased compared with that of pure diesel, and the more significant the proportion of butanol, the greater the reduction. On the contrary, the unburned hydrocarbon (HC) emissions in the exhaust gas increased, and the emissions continually increased as the proportion of butanol increased. Doğan (2011) selected five n-butanol/diesel blends with different n-butanol ratios and tested each fuel on an unmodified single-cylinder four-stroke diesel engine at a speed of 2 600 r/min. The results showed that the opacity of flue gas, NOx, and CO emissions decreased, and HC emissions increased with the increased n-butanol content. In addition, the higher the n-butanol content, the higher the brake-specific fuel consumption and brake thermal efficiency, and the exhaust gas temperature decreased with the increase in n-butanol content in the fuel.
Most studies on the effects of butanol addition on the combustion characteristics of CI engines focus on the engine test rig, but limited information can be found in the fundamental research on diesel sprays and combustion. Consequently, this paper studied the spray and combustion characteristics of two diesel/n-butanol blends and pure diesel in a high-temperature and high-pressure constant volume combustion chamber (CVCC). The spray penetration, ignition delay (ID), OH flame lift-off length, and soot concentration distribution were quantified using multiple diagnostics.
2 Experimental setup and tools
2.1 Fuels and operating conditions
China Ⅵ 0# diesel was used as the basic fuel in the experiment. The blended fuel B20 (20% butanol, 80% diesel by volume) and B40 (40% butanol, 60% diesel by volume) were tested, and the pure diesel B0 (100% diesel) was investigated under the same operating conditions as a reference. Table 1 shows the fuel properties of n-butanol and diesel.
Table 1 Fuel properties of n-butanol and diesel (C. Zhang et al., 2022; Tipanluisa et al., 2021; Z. Zhang et al., 2022; Csemány et al., 2022)Properties Diesel n-Butanol Cetane number 40‒55 12 Density (g/mL) 0.86 0.81 Auto-ignition temperature (℃) 200‒220 385 latent heat of vaporization (kJ/kg) 250 716 Lower heating value (MJ/kg) 42.5 35.1 Flammability limits 1.5‒7.6 1.4‒11.2 Table 2 displays the experimental conditions for this study. Two injection pressure (Pinj) and two ambient temperatures (Ta) were used by injecting the fuel into a 15% oxygen exhaust gas recirculation environment mixed with nitrogen, and the ambient density (ρa) was kept constant at 22.8 kg/m3. For each operating condition, ten injection cycles were recorded to reduce the uncertainties caused by cycle-to-cycle scattering.
Table 2 Experiment conditionsAmbient temperature (K) 800 850 Ambient density (kg/m3) 22.8 Injection pressure (MPa) 50 100 Oxygen concentration (%) 15 Injection duration (ms) 4 2.2 Constant volume combustion chamber
All the experiments were conducted in an optically accessible CVCC, which can simulate the thermodynamic conditions of CI engines at the top dead center position. A heating element was installed at the bottom of the chamber to provide a high-temperature environment of 900 K. An external high-pressure gas storage cylinder provided the internal gas environment of the combustion chamber, and the maximum pressure can reach 6 MPa (Zhong et al., 2019a; Li et al., 2017). A Bosch high-pressure common-rail system, where the injection pressure can reach 170 MPa, was applied to inject the fuel into the CVCC. A single-hole injector (120 μm in diameter) was equipped at the top center of the chamber to allow the spray to penetrate from top to bottom. Four windows with a diameter of 100 mm were arranged around the chamber orthogonality. To avoid high-temperature damage to the glass window and keep a constant nozzle tip temperature, we inserted a cooling system into the chamber around the injector and the optical window by running a continuous flow of ethylene glycol (Xuan et al, 2018; Xuan et al, 2020a).
2.3 Optical techniques and image processing
Three optical diagnostic methods were used in this study: high-speed schlieren imaging, OH* chemiluminescence method, and diffused back-illumination extinction imaging technique. OH* chemiluminescence and high-speed schlieren imaging tests were performed simultaneously. Figures 1(a) and 1(b) show the optical path arrangement of schlieren, OH* chemical luminescence and diffused background-illumination extinction imaging (DBI). Table 3 presents the camera parameters of the three optical diagnostic methods.
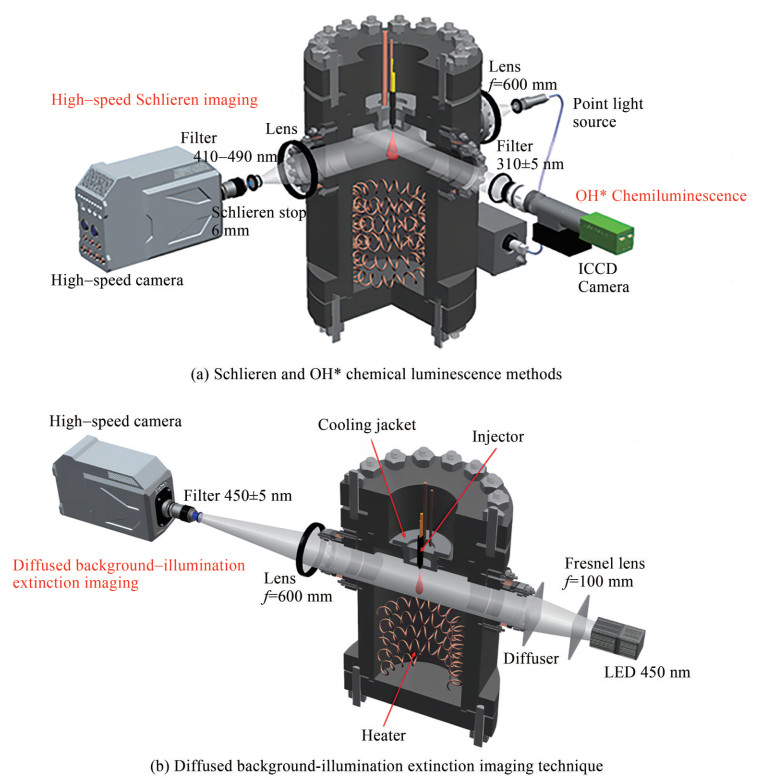 Figure 1 Schematic of the experimental setupTable 3 Camera configuration
Techniques Schlieren OH* Chemiluminescence DBI Camera type Photron SA-Z Nikon Hisence MK Photron SA-Z Sensor CMOS CCD CMOS Frame rate (f/s) 60 000 — 60 000 Resolution (pixel) 896×368 1344×1024 896×368 Pixel (mm) 8.95 10.42 9.15 Exposure time (μs) 3.75 2 000 2.5 The schlieren method is based on the refraction of parallel light after passing through a non-uniform medium due to density fluctuation. Density changes in the spray area are converted into image brightness changes. With this phenomenon and a high-speed camera, the spray area can be easily distinguished from the ambient atmosphere of the combustion chamber. Figure 1(a) shows a schematic of the schlieren optical setup. The optical layout of the schlieren method setup can be divided into light path and acquisition system. In the light path arrangement, the point light source was scattered into parallel light after passing through a spherical lens mounted next to the chamber. The light beam was refracted due to the density change after passing through the spray area. The refracted light was then refocused by another spherical lens placed on the other side of the chamber and cut off by the schlieren stop placed at the Fourier plane. As the soot radiation spectrum is mostly located in the red and infrared regions, a band-pass filter (410–490 nm) was installed in front of the high-speed camera to eliminate the influence of soot radiation and environmental stray light on schlieren effect. Finally, the light was collected by a high-speed camera (Photron SA-Z) running at 60 000 frames per second (f/s). The schlieren images were first corrected by dynamic background subtraction and processed following an intensity-based criterion to quantify the spray tip penetration (Benajes et al., 2013), which was defined as the distance from the furthest position point on the spray contour to the nozzle orifice. Figure 2 shows an example of the processed schlieren image.
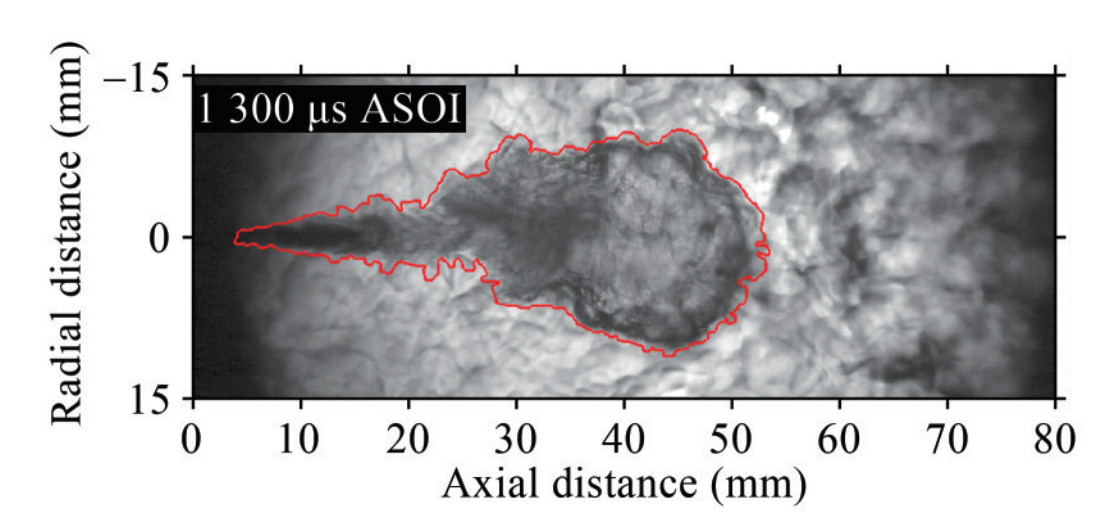 Figure 2 Schematic of processed schlieren image
Figure 3 shows the definition of flame lift-off length from OH* chemiluminescence images. The flame lift-off length (LOL) is defined as the distance from the injector tip to the initial high-temperature reaction location, and it was measured by the OH* chemiluminescence method. The OH* chemiluminescence signal can represent the high-temperature combustion zone on the stoichiometric surface, where OH* jumped from the high-energy state to the low-energy state and emitted radiation with a wavelength of approximately 310 nm. The acquisition part of this method adopted an intensifier charge-coupled camera (ICCD) with an ultraviolet lens. When the spray flame is stable, the initial position of the high-temperature reaction location reaches a steady state. In the experiment, a band-pass filter (307±5 nm) was installed in front of the ICCD camera to avoid the interference of soot radiation. According to the processing method proposed by Siebers and Higgins (2001), the original image was divided into top and bottom parts along the spray axis. The position where the unilateral radiation light reached 50% of the first radiation intensity peak was defined as the unilateral LOL, and the average of the top and bottom sides was the final LOL value of this individual cycle. The final presented LOL results were averages of over ten repetitions under each operating point.
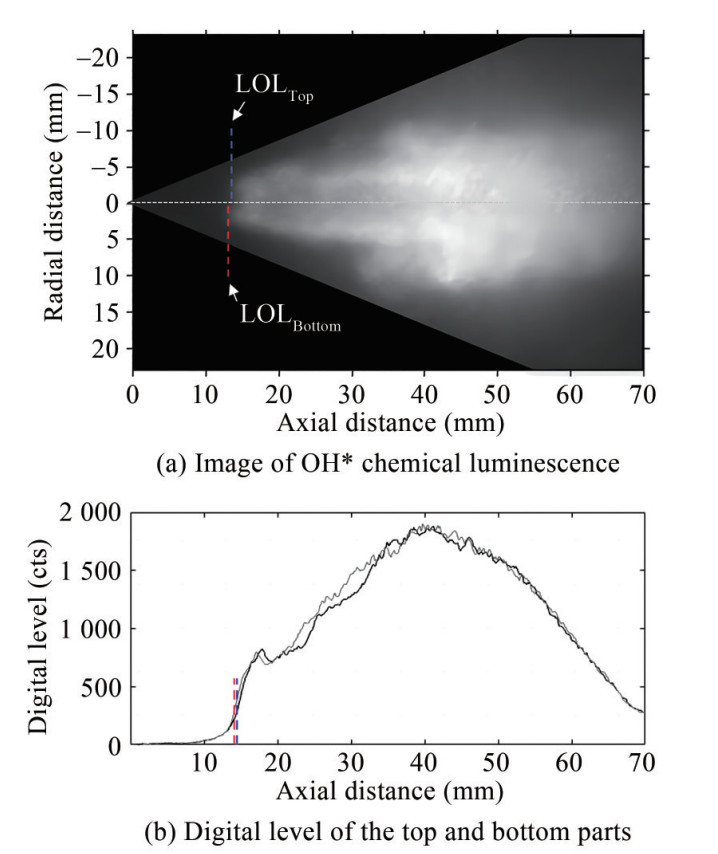 Figure 3 Definition of flame lift-off length from OH* chemiluminescence images
Figure 1(b) displays the DBI (Payri et al, 2015; Pastor et al, 2020) setup. A high-frequency pulse light emitting diode (LED) (peak wavelength of 450 nm) and a Fresnel lens (d = 102 mm, f = 70 mm) were used to provide the parallel beam. The parallel beam then passed through an engineering diffuser (100 mm×100 mm) to form a uniform diffusion background light. A spherical lens (f = 600 mm) was placed on the other side of the chamber to collect the beam into a high-speed camera.
The camera was used to trigger the LED light source in the experiment. The frequency of the LED was set to be half of the camera frequency. Consequently, a sequence of images alternating with background light and without background light was obtained. Figure 4 shows the signal synchronization timing. When the LED is on, the light intensity (I) detected by the camera equals the transmitted LED light intensity (It) plus the flame intensity (If). As the camera shooting speed is very high, If can be calculated by interpolating two consecutive LED-off images with the flame intensity only. According to the Beer–Lambert principle, the relationship between the transmittance of the soot cloud and the optical thickness (KL) value of the soot volume fraction is as follows:
$$ \frac{I_t}{I_0}=\frac{I-I_f}{I_0}=\exp (-K L) $$ (1) 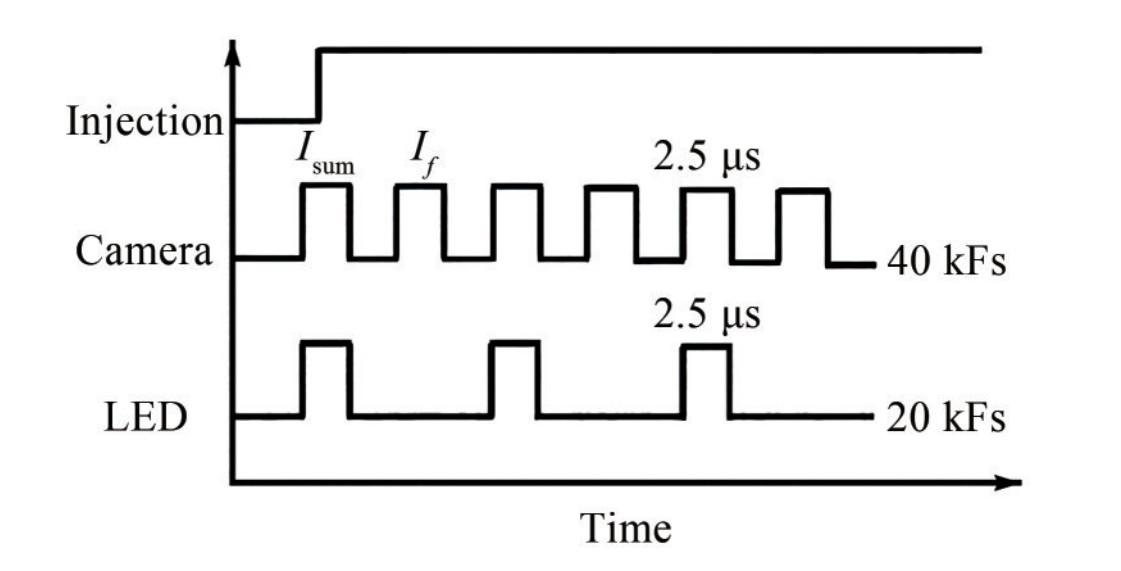 Figure 4 Schematic diagram of the pulse LED synchronization
where I0 is the initial light intensity of the LED background, L is the optical path length of the background light passing through the soot cloud, and K is the average extinction coefficient on the path.
The KL value of soot can be obtained by Eq. (1). After removing the liquid phase using soot radiation images as masks, the final soot KL image can be obtained (Figure 5). The soot mass (msoot) per pixel was finally obtained by line-of-sight integration as follows (Desantes et al., 2019):
$$ m_{\text {soot }}=\rho_{\text {soot }} \mathrm{KL} \frac{\lambda}{k_e} \times \text { pixel area } $$ (2) 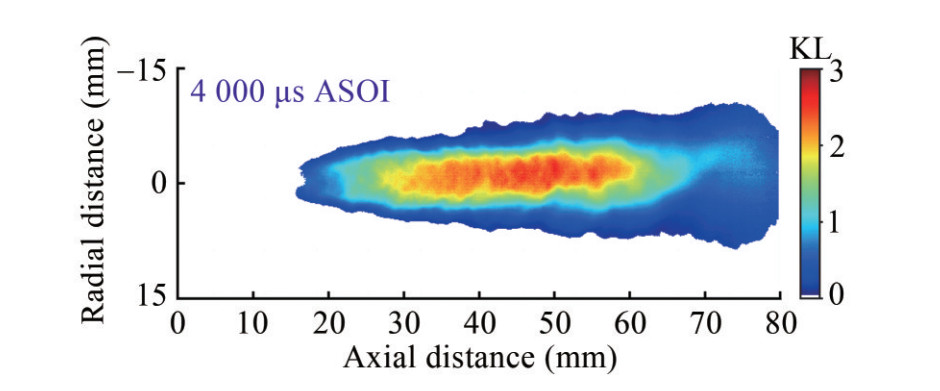 Figure 5 Example of soot KL image
where ρsoot is assumed the soot density of 1.8 g/m3 referenced from Manin and Pickett (2013). λ is the wavelength of the extinction method, and ke = 7.61 is the dimensionless extinction coefficient calculated according to the Rayleigh–Debye – Gans (RDG) principle (Köylü and Faeth, 1994). The parameters used for RDG approximation were referenced from (Manin et al. 2013) (fractal prefactor: kf = 8.36; fractal dimension: Df = 1.77; refractive index: m = 1.75 − 1.03i (Williams et al. 2007); aggregate size: Np = 150; particle diameter: dp = 16 nm; wavelength: λ= 450 nm).
3 Results and discussion
3.1 Fuel volatilization characteristics
Figure 6 presents the evaporation characteristic curves of the three fuels tested in this study. The thermogravimetry (TG) and derivative TG (DTG) curves were divided into three sections based on the weight loss rate. In the first stage, the weight loss was mainly caused by the evaporation of low boiling point components in the fuel. Consequently, B20 and B40 presented faster action on the weight loss due to the low boiling point of butanol, and DTG value increased with a higher portion of butanol. The weight loss rate slowed down when the weight loss ratio reached the butanol ratio of its blend oil. The second stage was the fuel pyrolysis stage. In the early period of this stage, the weight loss rates of the three fuels were almost the same, and the residues of the three fuels were mainly high-boiling-point substances. The remaining masses of the three fuels were 95% (B0), 76% (B20), and 57% (B40) of the initial mass. Given that the proportion of high-boiling-point components in the initial blended oil was B0 > B20 > B40, as the temperature continually rose, the high-boiling-point component lost weight, which resulted in the fastest evaporation rate of B0, followed by B20 and B40. The third stage was the carbonization stage, and the three kinds of fuels disappeared with the increase in temperature. Thus, the apparent difference in fuel evaporation behavior strongly influenced the spray mixing and later ignition and combustion process.
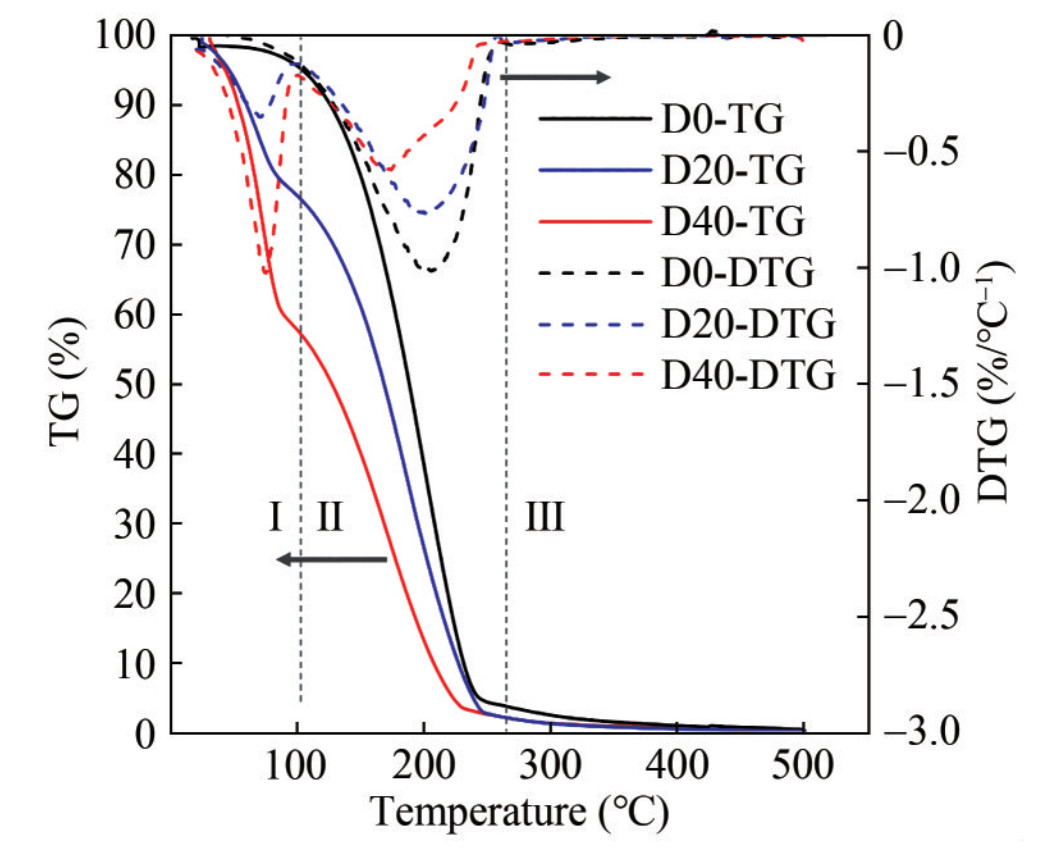 Figure 6 Volatilization curves of all tested fuels
3.2 Spray penetration
Figure 7 presents the spray tip penetration with time after the start of injection (ASOI) under all operating points, where solid curves represent the penetration of 100 MPa cases, and the dashed curves represent those of 50 MPa cases. Each case's corresponding ID was also presented as a vertical line. The penetration curves become flat after 68 mm because of the optical limit from the windows. The higher injection pressure resulted in a higher vapor penetration due to the momentum flux. The fuel properties did not significantly influence the tip penetration before ignition for the B0 and B20 fuels. The divergence can only be observed after ignition. The difference in ID resulted in different timings for the spray acceleration caused by low density within the flame. However, the B40 fuel presented a slightly lower vapor penetration for Pinj = 100 MPa cases even before the ignition. This finding could have been caused by the difference in internal flow, where the difference in cavitation and discharge coefficient can affect vapor penetration. More detailed CFD analysis still needs to be carried out.
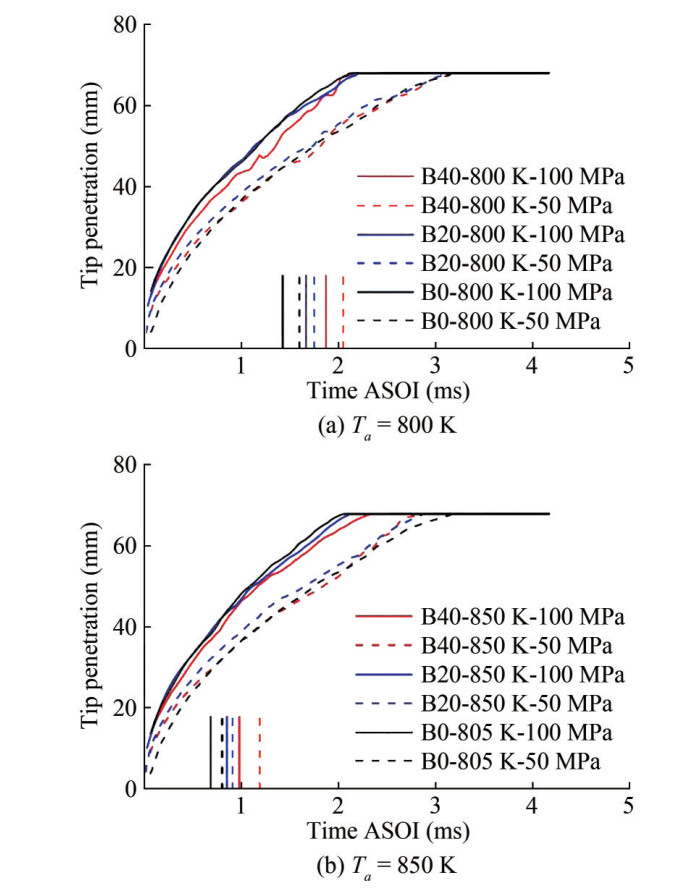 Figure 7 Tip penetration and corresponding ID under reaction conditions
3.3 ID and flame LOL
The ID period is defined as the time interval from the start of injection to the occurrence of high-temperature combustion. Figure 8 presents the temporal evolution of schlieren images during the ignition processes of the three fuels under operating conditions of Ta = 850 K and Pinj = 100 MPa. The images on the left, middle, and right columns correspond to fuels B0, B20, and B40, respectively. At 350 μs ASOI, the sprays of all fuels still behaved as non-reacting ones with a cone shape, and the tip penetrations were similar at approximately 27 mm. At 500 μs ASOI, the spray head of pure diesel (B0) became slightly transparent, which indicated its entry to the cool flame combustion stage. Subsequently, at 750 μs ASOI, the spray head of the B0 fuel turned dark again and started expanding radially, which represented the occurrence of high-temperature combustion. At this point, the spray penetration of B0 did not present a significant increase compared with the other two fuels due to the momentum conservation of the spray; this stage was defined as the stabilization phase (Desantes et al. 2017). The cool flame stages of B20 and B40 occurred at 750 and 900 µs after injection, respectively. At this timing position, capturing the "real" spray head against the background was difficult because the slight heat release from the cool flame caused the density gradient of the spray to become similar to that of the ambient gas. As a result, some of the spray contours were lost during image processing. At 900 and 1 100 µs ASOI, the high-temperature combustion stage occurred for the B20 and B40 fuels, respectively. With the increase in the butanol ratio, the fuel activities of B0, B20, and B40 gradually decreased, which eventually led to the delay of the two-stage ignition.
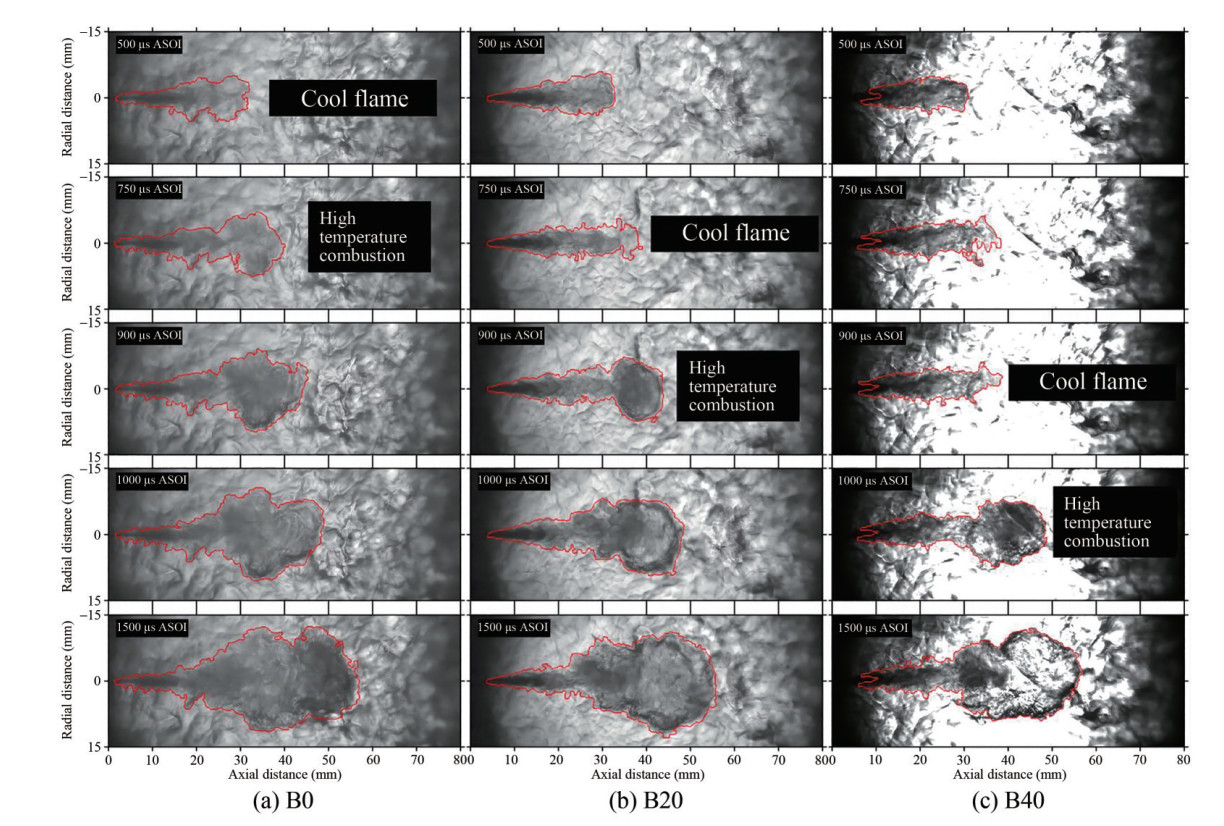 Figure 8 Time sequences of Schlieren images at Ta = 850 K and Pinj = 100 MPa
Figures 9(a) and 9(b) respectively present the ID and flame LOL of the three fuel operating conditions: Ta = 800, 850 K and Pinj = 100 MPa. The ID and flame LOL of the three fuels increased with a lower ambient temperature, which is consistent with that of previous research (Xuan et al., 2020b; Zhong et al., 2019b). With the decrease in temperature, the IDs of B0, B20, and B40 increased by 0.53, 0.45, and 0.59 ms, respectively. In addition, the LOL of B0, B20, and B40 increased by 15.13, 14.97, and 18.83 mm, respectively. The addition of more n-butanol to the blends led to a longer ID and LOL. For example, at 850 K operating conditions, the ID and LOL of the three fuels were as follows: B0: 0.69 ms and 7.20 mm, B20: 0.89 ms and 13.56 mm, and B40: 0.98 ms and 17.06 mm. The findings can be explained as follows: On the one hand, the lower cetane number of n-butanol led to a lower reactivity of the blends. On the other hand, the high-vaporization latent heat of n-butanol contributed to a longer fuel evaporation and chemical reaction preparation, which eventually led to longer ID and LOL. Therefore, the ID and LOL of B0, B20, and B40 increased with the increase in the butanol ratio.
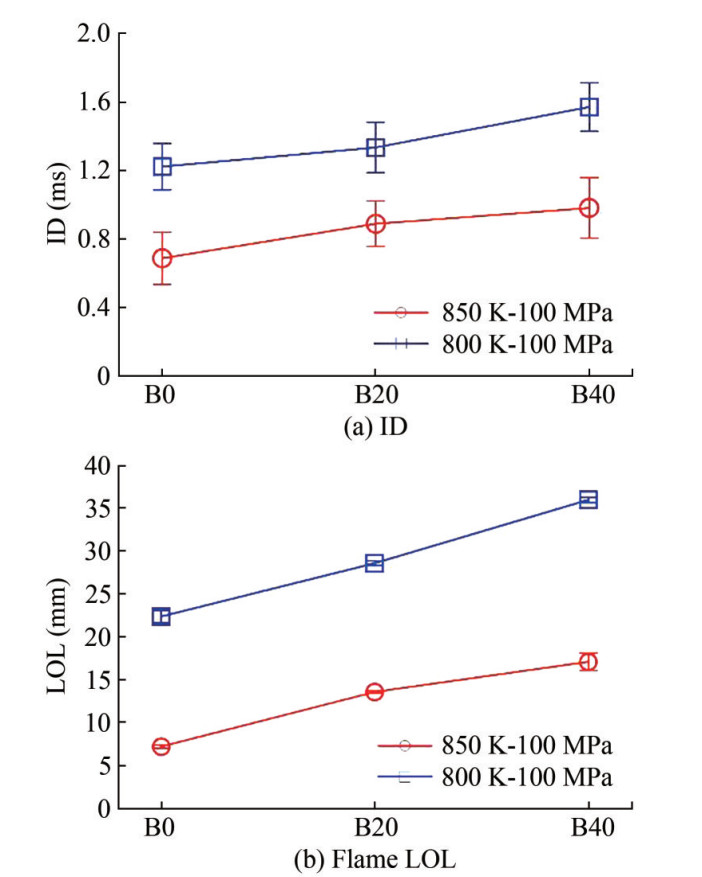 Figure 9 ID and flame LOL
3.4 In-flame soot formation
As B40 produced an extremely minute amount of soot, only B0 and B20 were analyzed for soot formation in flames. Figure 10 shows the temporal evolution of the soot KL value along the spray axis of B0 and B20 fuels at Pinj = 100 MPa and Ta = 850 K. Five timing positions from 450 µs to 4 500 µs are given here. Figure 11 displays the corresponding two-dimensional image of the soot KL values of the two fuels at the same timing position under the same operating conditions. The spray contours are also presented in Figure 11 in red color. The soot onset of B0 (450 µs ASOI) occurred earlier than that of B20 (900 µs ASOI). This trend was consistent with the ID (Figure 9(a)). The sooting flames of both fuels stabilized after 2 000 µs ASOI, where the soot peak KL value of B0 was kept at around 1.7 on average, and that one of B20 was kept at around 1. During the stable stage, the high sooting area of B0 was concentrated downstream of 30 – 45 mm from the nozzle, and that of B20 was mainly located at 35–45 mm from the nozzle, a little further away from the nozzle because of the longer LOL. At 4 500 µs ASOI, the upstream of the soot cloud was oxidized rapidly owing to the "entrainment wave" after the end of fuel injection. The in-flame soot amount did not present a big difference at this timing position.
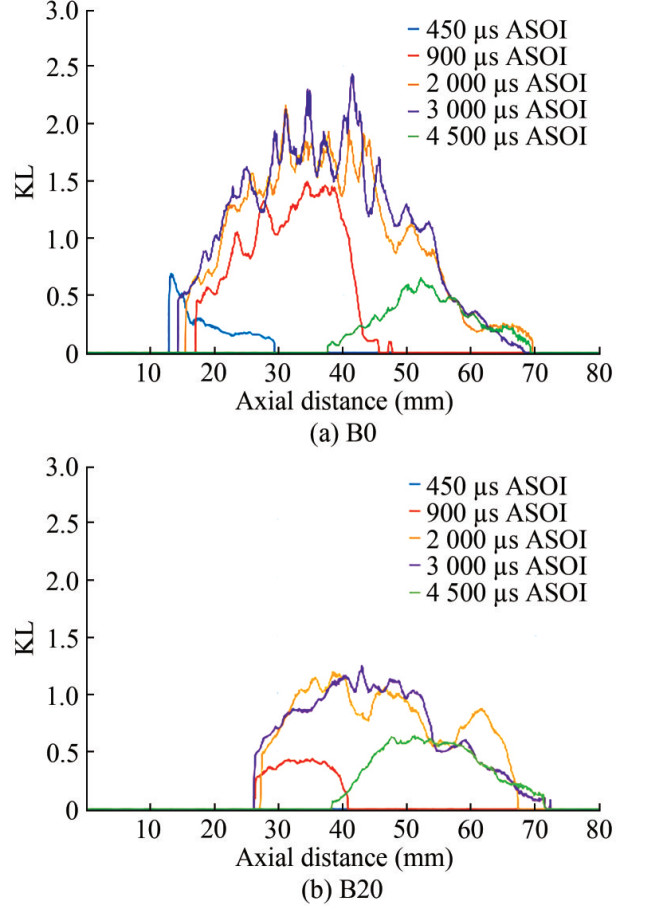 Figure 10 KL development process of different fuels on the spray axis
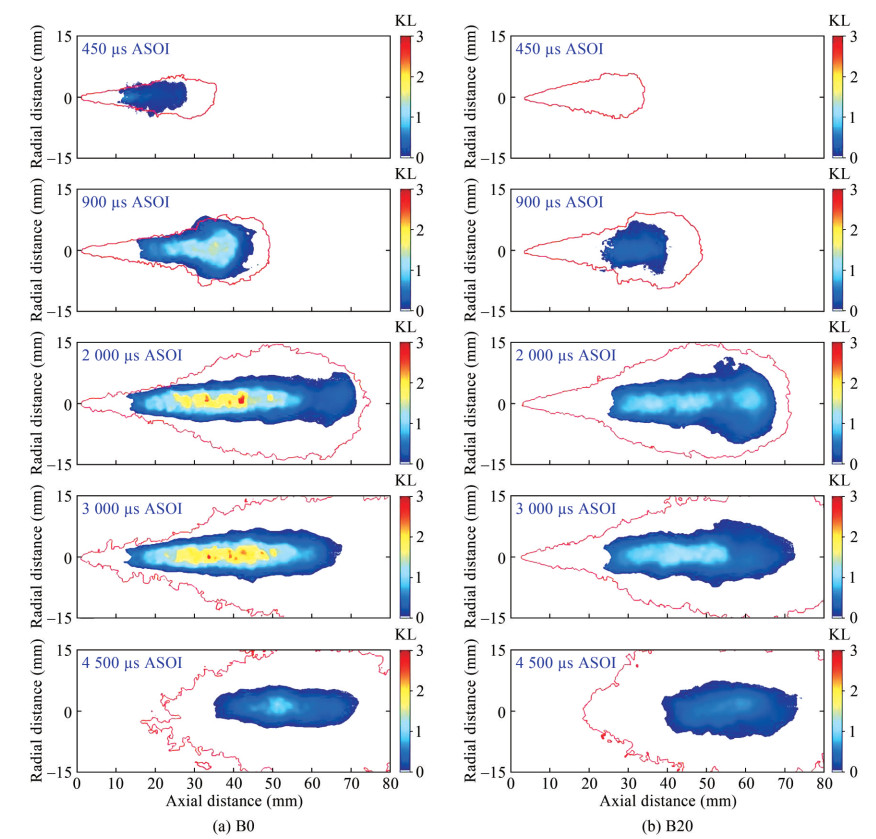 Figure 11 Image of soot KL value
A probability density map of soot formation over the entire spray area was derived by overlapping the soot maps at all times (Figure 12). The radial widths of two probability maps (> 50% and > 35%) are also presented at the bottom of the figure. The initial soot formation area of B0 fuel was located at the spray axis of 15 mm, and that of B20 fuel was located at the spray axis of 25 mm. The main reason was the shorter LOL of B0, which resulted in a considerably higher equivalence ratio at the initial location of the flame. The high soot density region was located at the flame center, and the flame margin presented notably less soot probability. In general, the low probability density area of B20 had a larger area ratio compared with B0, which meant the larger soot flame fluctuation of B20. As a consequence, the sooting flame length in the axial direction of the > 50% probability map was narrower (Figure 12(c)). However, this finding did not present a significant difference in the radial direction. The radials of the sooting flame (> 50% probability) of both fuels were around 10 between 40–50 mm axial distance. On the other hand, the lower soot probability maps (> 35% probability) did not show the same trend, where the sooting flame of B20 presented a larger area downstream in the axial and radial directions. This result could have been caused by the thicker OH flame distribution owing to the contained oxygen within butanol.
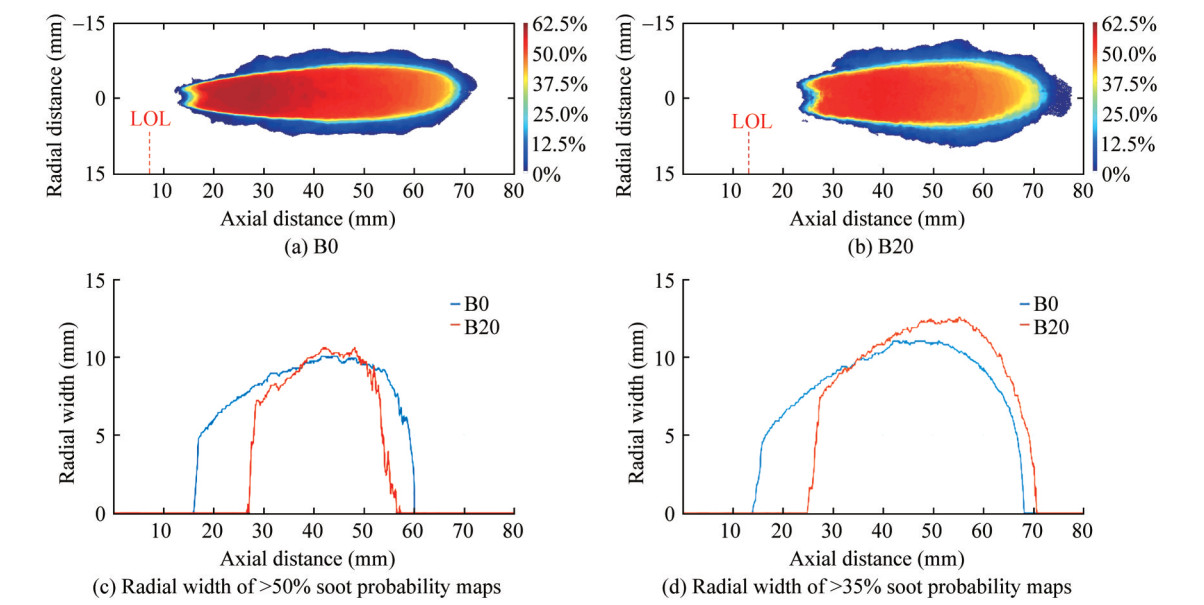 Figure 12 Probability maps of soot distribution
Figures 13(a) and 13(b) present the total soot mass evolution during the whole injection process with 50 and 100 MPa injection pressure under Ta= 850 K, respectively. The in-flame soot amount for Ta= 800 K cases was small, especially for the blended fuel; thus, the results are not shown here. Soot production decreased significantly with higher injection pressure for all the fuels, which is consistent with that of previous research (Xuan et al., 2021). This result was mainly caused by the longer flame LOL and shorter residence time within the high-temperature fuel-rich area. Moreover, the addition of more n-butanol resulted in less in-flame soot production, which was consistent with the engine exhaust emission tests (Zhu et al., 2023; Li et al., 2022; Bai et al., 2022). The soot mass during the quasi-steady phase was approximately 50% (40 µg to 20 µg to 10 µg) with every 20% butanol addition for the Pinj = 100 MPa cases. This finding can be explained by two main reasons. The longer flame LOL (Figure 9) caused the initial position of the flame to start with a leaner mixture, which produced fewer soot precursors and less soot production. Moreover, butanol contains a large content of oxygen, which favored the increase in the soot oxidation rate. Consequently, the in-flame soot of B0, B20, and B40 reduced gradually.
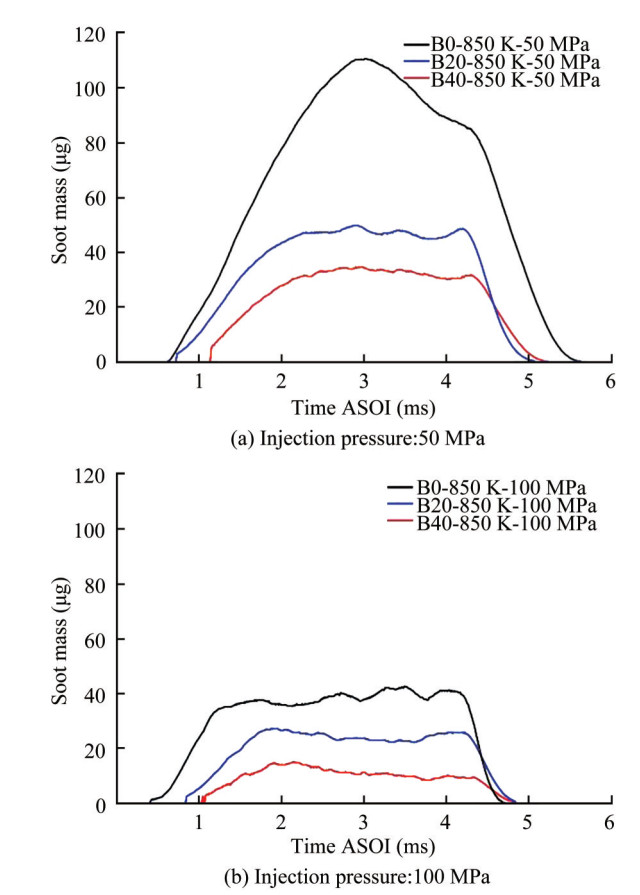 Figure 13 Temporal evolution of the total soot mass (Ta=850 K, ρa=22.8 kg/m3)
4 Conclusions
In this paper, the spray penetration, ID period, flame LOL, and total soot mass of B0, B20, and B40 fuels were studied by the schlieren method, diffused back-illumination extinction imaging technique, and OH* chemiluminescence method in a high-temperature and high-pressure CVCC. The transient soot productions of different fuels at various spray moments were compared. The main findings are as follows:
1) Under combustion conditions, the spray penetration trends of the three fuels at 800 and 850 K were the same. Meanwhile, the spray penetration rate of B0 was the fastest after ignition, followed by those of B20 and B40, mainly due to the high evaporation latent heat of butanol.
2) The ID and flame LOL of the blended fuel increased due to the decrease in the cetane number and the increase in the vaporization latent heat of the fuel caused by mixing butanol.
3) Soot formation in the flame decreased as the proportion of butanol in the blended fuels increased. First, given the addition of butanol, the LOL and ID were reduced, which resulted in a later soot onset and stabilization times. The flame appeared in a thinner fuel-air mixture. Furthermore, the addition of butanol increased the oxygen content of the blended fuels, which can accelerate the oxidation rate of soot. Finally, the soot formation of butanol/diesel blended fuels was significantly reduced.
Competing interest The authors have no competing interests to declare that are relevant to the content of this article. -
Figure 1 Schematic of the experimental setup
Figure 2 Schematic of processed schlieren image
Figure 3 Definition of flame lift-off length from OH* chemiluminescence images
Figure 4 Schematic diagram of the pulse LED synchronization
Figure 5 Example of soot KL image
Figure 6 Volatilization curves of all tested fuels
Figure 7 Tip penetration and corresponding ID under reaction conditions
Figure 8 Time sequences of Schlieren images at Ta = 850 K and Pinj = 100 MPa
Figure 9 ID and flame LOL
Figure 10 KL development process of different fuels on the spray axis
Figure 11 Image of soot KL value
Figure 12 Probability maps of soot distribution
Figure 13 Temporal evolution of the total soot mass (Ta=850 K, ρa=22.8 kg/m3)
Table 1 Fuel properties of n-butanol and diesel (C. Zhang et al., 2022; Tipanluisa et al., 2021; Z. Zhang et al., 2022; Csemány et al., 2022)
Properties Diesel n-Butanol Cetane number 40‒55 12 Density (g/mL) 0.86 0.81 Auto-ignition temperature (℃) 200‒220 385 latent heat of vaporization (kJ/kg) 250 716 Lower heating value (MJ/kg) 42.5 35.1 Flammability limits 1.5‒7.6 1.4‒11.2 Table 2 Experiment conditions
Ambient temperature (K) 800 850 Ambient density (kg/m3) 22.8 Injection pressure (MPa) 50 100 Oxygen concentration (%) 15 Injection duration (ms) 4 Table 3 Camera configuration
Techniques Schlieren OH* Chemiluminescence DBI Camera type Photron SA-Z Nikon Hisence MK Photron SA-Z Sensor CMOS CCD CMOS Frame rate (f/s) 60 000 — 60 000 Resolution (pixel) 896×368 1344×1024 896×368 Pixel (mm) 8.95 10.42 9.15 Exposure time (μs) 3.75 2 000 2.5 -
Bai Y, Wang Y, Hao L (2022) Experimental study on the effects of injection timing and n-butanol energy ratio on combustion and emissions of n-butanol/diesel DFDI engine. Fuel 324: 124654. https://doi.org/10.1016/j.fuel.2022.124654 Benajes J, Payri R, Bardi M, Martí-Aldaraví P (2013). Experimental characterization of diesel ignition and lift-off length using a single-hole ECN injector. Applied Thermal Engineering 58(1-2): 554-563 https://doi.org/10.1016/j.applthermaleng.2013.04.044 Csemány D, DarAli O, Rizvi SAH, Józsa V (2022) Comparison of volatility characteristics and temperature-dependent density, surface tension, and kinematic viscosity of n-butanol-diesel and ABE-diesel fuel blends. Fuel 312: 122909. https://doi.org/10.1016/j.fuel.2021.122909 Desantes JM, García-Oliver JM, García A, Xuan T (2019) Optical study on characteristics of non-reacting and reacting diesel spray with different strategies of split injection. International Journal of Engine Research 20(6): 606-623. https://doi.org/10.1177/1468087418773012 Desantes JM, García-Oliver JM, Xuan T, Vera-Tudela W (2017) A study on tip penetration velocity and radial expansion of reacting diesel sprays with different fuels. Fuel 207: 323-335. https://doi.org/10.1016/j.fuel.2017.06.108 Doğan O (2011) The influence of n-butanol/diesel fuel blends utilization on a small diesel engine performance and emissions. Fuel 90(7): 2467-2472. https://doi.org/10.1016/j.fuel.2011.02.033 Köylü ÜÖ, Faeth GM (1994) Optical properties of overfire soot in buoyant turbulent diffusion flames at long residence times. Journal of Heat Transfer 116(1): 152-159. https://doi.org/10.1115/1.2910849 Lapuerta M, Armas O, Herreros JM (2008) Emissions from a diesel–bioethanol blend in an automotive diesel engine. Fuel 87(1): 25-31. https://doi.org/10.1016/j.fuel.2007.04.007 Li D, He Z, Xuan T, Zhong W, Cao J, Wang Q, Wang P (2017) Simultaneous capture of liquid length of spray and flame lift-off length for second-generation biodiesel/diesel blended fuel in a constant volume combustion chamber. Fuel 189: 260-269. https://doi.org/10.1016/j.fuel.2016.10.058 Li J, Zhang Z, Ye Y, Li W, Yuan T, Wang H, Li Y, Tan D, Zhang C (2022) Effects of different injection timing on the performance, combustion and emission characteristics of diesel/ethanol/n-butanol blended diesel engine based on multi-objective optimization theory. Energy 260: 125056. https://doi.org/10.1016/j.energy.2022.125056 Lü X, Yang J, Zhang W, Huang Z (2004) Effect of cetane number improver on heat release rate and emissions of high speed diesel engine fueled with ethanol – diesel blend fuel. Fuel 83(14-15): 2013-2020. https://doi.org/10.1016/j.fuel.2004.05.003 Manin JL, Pickett LM (2013) Extinction-based Imaging of Soot Processes over a Range of Diesel Operating Conditions (No. SAND2013-2181C). Sandia National Lab. (SNL-CA), Livermore, United States Manin J, Pickett LM, Skeen SA (2013) Two-color diffused back-illumination imaging as a diagnostic for time-resolved soot measurements in reacting sprays. SAE International Journal of Engines 6(4): 1908-1921. http://www.jstor.org/stable/26272319 https://doi.org/10.4271/2013-01-2548 Pastor JV, García A, Micó C, García-Carrero AA (2020) Experimental study of influence of liquefied petroleum gas addition in hydrotreated vegetable oil fuel on ignition delay, flame lift off length and soot emission under diesel-like conditions. Fuel 260: 116377. https://doi.org/10.1016/j.fuel.2019.116377 Payri R, García-Oliver JM, Xuan T, Bardi M (2015) A study on diesel spray tip penetration and radial expansion under reacting conditions. Applied Thermal Engineering 90: 619-629. https://doi.org/10.1016/j.applthermaleng.2015.07.042 Rakopoulos DC, Rakopoulos CD, Giakoumis EG, Dimaratos AM, Kyritsis DC (2010a) Effects of butanol–diesel fuel blends on the performance and emissions of a high-speed DI diesel engine. Energy Conversion and Management 51(10): 1989-1997. https://doi.org/10.1016/j.enconman.2010.02.032 Rakopoulos DC, Rakopoulos CD, Hountalas DT, Kakaras EC, Giakoumis EG, Papagiannakis RG (2010b) Investigation of the performance and emissions of bus engine operating on butanol/diesel fuel blends. Fuel 89(10): 2781-2790. https://doi.org/10.1016/j.fuel.2010.03.047 Siebers D, Higgins B (2001) Flame lift-off on direct-injection diesel sprays under quiescent conditions. SAE Transactions 110: 400-421. http://www.jstor.org/stable/44724317 http://www.jstor.org/stable/44724317 Tipanluisa L, Fonseca N, Casanova J, López JM (2021) Effect of n-butanol/diesel blends on performance and emissions of a heavy-duty diesel engine tested under the world harmonised steady-state cycle. Fuel 302: 121204. https://doi.org/10.1016/j.fuel.2021.121204 Williams TC, Shaddix CR, Jensen KA, Suo-Anttila JM (2007) Measurement of the dimensionless extinction coefficient of soot within laminar diffusion flames. International Journal of Heat and Mass Transfer 50(7-8): 1616-1630. https://doi.org/10.1016/j.ijheatmasstransfer.2006.08.024 Xuan T, Sun Z, EL-Seesy AI, Mi Y, Zhong W, He Z, Wang Q, Sun J, El-Zoheiry RM (2020a) An optical study on spray and combustion characteristics of ternary hydrogenated catalytic biodiesel/methanol/n-octanol blends; part Ⅰ : Spray morphology, ignition delay, and flame lift-off length. Fuel 289: 119762. https://doi.org/10.1016/j.fuel.2020.119762 Xuan T, Sun Z, EL-Seesy AI, Mi Y, Zhong W, He Z, Wang Q, Sun Z, El-Batsh HM, Cao J (2021) An optical study on spray and combustion characteristics of ternary hydrogenated catalytic biodiesel/methanol/n-octanol blends; part П: Liquid length and in-flame soot. Energy, 227, 120543. https://doi.org/10.1016/j.energy.2021.120543 Xuan T, Cao J, He Z, Wang Q, Zhong W, Leng X, Li D, Shang W (2018) A study of soot quantification in diesel flame with hydrogenated catalytic biodiesel in a constant volume combustion chamber. Energy, 145, 691-699. https://doi.org/10.1016/j.energy.2017.12.106 Xuan T, EL-Seesy A I, Mi Y, Lu P, Zhong W, He Z, Wang Q (2020b) Effects of an injector cooling jacket on combustion characteristics of compressed-ignition sprays with a gasoline-hydrogenated catalytic biodiesel blend. Fuel 276: 117947. https://doi.org/10.1016/j.fuel.2020.117947 Yao M, Wang H, Zheng Z, Yue Y (2010) Experimental study of n-butanol additive and multi-injection on HD diesel engine performance and emissions. Fuel 89(9): 2191-2201. https://doi.org/10.1016/j.fuel.2010.04.008 Yukio A, Yoshihito S (1994) Effects of oxygenated fuel and cetane improver on exhaust emission from heavy-duty DI diesel engines. SAE Technical Paper 942023. https://doi.org/10.4271/942023 Zannis TC, Hountalas DT, Kouremenos DA (2004) Experimental investigation to specify the effect of oxygenated additive content and type on DI diesel engine performance and emissions. SAE Transactions 113:166-179. http://www.jstor.org/stable/44740747 http://www.jstor.org/stable/44740747 Zhang Z, Li J, Tian J, Dong R, Zou Z, Gao S, Tan D (2022) Performance, combustion and emission characteristics investigations on a diesel engine fueled with diesel/ethanol/n-butanol blends. Energy 249: 123733. https://doi.org/10.1016/j.energy.2022.123733 Zhang C, Yang K, Li G, Dai J, Lee TH (2022) Spray evaporation characteristics of isopropanol-butanol-ethanol (IBE)/diesel blends in a constant volume chamber. Fuel 330: 125659. https://doi.org/10.1016/j.fuel.2022.125659 Zhong W, Li B, He Z, Xuan T, Lu P, Wang Q (2019a) Experimental study on spray and combustion of gasoline/hydrogenated catalytic biodiesel blends in a constant volume combustion chamber aimed for GCI engines. Fuel 253: 129-138. https://doi.org/10.1016/j.fuel.2019.04.114 Zhong W, Pachiannan T, He Z, Xuan T, Wang Q (2019b) Experimental study of ignition, lift-off length and emission characteristics of diesel/hydrogenated catalytic biodiesel blends. Applied Energy 235: 641-652. https://doi.org/10.1016/j.apenergy.2018.10.115 Zhu Q, Zong Y, Tan YR, Lyu J, Yu W, Yang W, Kraft M (2023) Evaluating the effect of n-butanol additive on particulate matter emission in diesel engine. Fuel 332: 126003. https://doi.org/10.1016/j.fuel.2022.126003
