
Design and Optimization of an Integrated Power System of Solid Oxide Fuel Cell and Marine Low-Speed Dual-Fuel Engine
https://doi.org/10.1007/s11804-023-00377-z
-
Abstract
A combined system including a solid oxide fuel cell (SOFC) and an internal combustion engine (ICE) is proposed in this paper. First, a 0-D model of SOFC and a 1-D model of ICE are built as agent models. Second, parameter analysis of the system is conducted based on SOFC and ICE models. Results show that the number of cells, current density, and fuel utilization can influence SOFC and ICE. Moreover, a deep neural network is applied as a data-driven model to conduct optimized calculations efficiently, as achieved by the particle swarm optimization algorithm in this paper. The results demonstrate that the optimal system efficiency of 51.8% can be achieved from a 22.4%/77.6% SOFC-ICE power split at 6 000 kW power output. Furthermore, promising improvements in efficiency of 5.1% are achieved compared to the original engine. Finally, a simple economic analysis model, which shows that the payback period of the optimal system is 8.41 years, is proposed in this paper.Article Highlights• An integration of SOFC and ICE is designed;• Optimization is conducted to achieve a system efficiency of 51.8%;• The highest efficiency can be obtained as a 22.4%/77.6% SOFC-ICE power split;• The payback period of the optimal system is 8.41 years. -
1 Introduction
Economic globalization is inevitable. Maritime transport has become an indispensable force in world trade due to its low costs. However, a large number of ships on the market are still propelled by burning heavy oil, which inevitably leads to carbon and other emissions. The problem of other emissions has been addressed by some technologies(Wang et al., 2020, Zhu et al., 2022). In recent years, the issue of carbon emissions has received increasing attention due to the worsening of the greenhouse effect. Carbon neutrality has been proposed in many countries through legislation, policies, and recommendations (Tan et al., 2022a). Shipping accounts for 2.89% of global carbon emissions, which is significant in reducing carbon emissions from the marine environment (Netgel and Stepinski, 2019). Therefore, the 72nd MEPC meeting was convened in 2018 by the International Maritime Organization (IMO), where the greenhouse gas reduction strategy was proposed. This strategy aims to lower greenhouse gas emissions by 50% by 2050 compared to those in 2008 (Joung et al., 2020). In 2020, at the 75th Meeting of the MEPC of the IMO, the Ⅵ amendment to the Annex to the New MARPOL Convention was formally approved by the conference, which proposed that the pre-initiation of Energy Efficiency Design Index Phase Ⅲ on New Year’s Day 2025 be moved up to April 2022 in response to new requirements on greenhouse gas emissions (Prehn and Jensen, 2021).
Alternative fuels have been improved (Shi et al., 2023), which will be an effective way to reduce the carbon emissions of ships. As a low-carbon fuel, natural gas has promising potential in the early stages of the carbon neutrality period (Wang et al., 2022a). Natural gas is mostly methane and has high purity, producing almost no sulfides (Gray et al., 2021). Natural gas emits approximately 25% less CO2 when burned than diesel (Hall et al., 2021).
Fuel cells, a device that can directly convert chemical energy into electric energy without combustion (Wu and Bucknall, 2020), are also available to solve the problems of carbon emissions in ships due to their high efficiency as well as their clean and quiet operation (Kistner et al., 2021; Biert et al., 2016; Wu and Bucknall, 2020). Solid oxide fuel cells (SOFCs) have the highest thermal efficiency and operate at remarkably high temperatures, enabling combined heat and power in some scenarios, which can be fed by numerous kinds of fuels (Xu et al., 2022). Thus, SOFCs are highly suitable for shipping (Yuan et al., 2020; Pan et al., 2021; Rivarolo et al., 2021). Micoli et al. (Luca et al., 2021) reported a 20 MW-class SOFC for a cruise ship. The results showed that the SOFC consumes less natural gas and has cleaner exhaust gas than a dual-fuel engine for the same power. Although employing an SOFC does not affect the ship’s flotation or stability, the large size and weight of the SOFC reduce the number of hotels on the cruise ship.
Several advantages of fuel cell ships have been reported. However, numerous disadvantages and technical difficulties hinder the use of SOFC ships, including lower power density, larger size and weight, and higher cost compared to engines (Biert et al., 2016). In addition, SOFCs demonstrate poor transient performance (Sapra et al., 2021). Chin et al. (2022) reported that a full fuel cell system is still only viable for small to medium vessels, while a hybrid system is practical for large ships. Furthermore, Xing et al. (2021) reported that reliability and durability will be achieved by integrating SOFC with batteries, photovoltaics, turbines, and engines, which can also maximize efficiency.
Numerous studies on SOFC applied by a combined system such as SOFC-GT or SOFC-ST (Chan et al., 2002; Park and Kim, 2006; Biert et al., 2018) are already available. The design concept of the SOFC-GT/ST combined system is the same as waste heat recovery. The SOFC-GT/ST combined system can improve efficiency. However, off-design conditions have remarkably low efficiency and poor dynamic response characteristics (Chuahy and Kokjohn, 2019).
On the contrary, ICE has excellent dynamic response characteristics and can achieve high thermal efficiency in any working condition (Chuahy and Kokjohn, 2019; Xia et al., 2023). Wu et al. (2020) reported superior dynamic performance based on a specific control strategy. Moreover, the highly efficient SOFC could replace the part power of ICE, which could increase the total efficiency of the combined system (Feng et al., 2023). In addition, cylinder combustion could be improved by SOFC anode off-gas, including H2. Several studies about combining forced combustion technology by SOFC anode off-gas with novel combustion technologies have been conducted.
Koo et al. (2021) established and jointly operated a 5 kW SOFC-ICE test system. The exhaust gas from SOFC is rich in CO and H2 and is used as fuel for a homogeneous charge compression ignition (HCCI) engine, resulting in the ICE accounting for only 13% ‒ 15% of the combined system power. The cycle configuration of this scheme is the same as that of SOFC-GT/ST.
Kim et al. (2020) studied a 5 kW class SFOC-ICE combined system and employed a spark-assisted ignition (SAI) engine. The engine was then analyzed by experiment, while the SOFC subsystem was calculated by simulation. The SAI technology could stabilize and control the combustion of the anode off-gas. Their results showed that an indicated efficiency of approximately 61.6% was achieved because the engine can generate approximately 14.2% of system power.
Chuahy et al. (Chuahy and Kokjohn, 2019) studied the SOFC-ICE combined cycle based on the diesel model. Calculation and simulation verification showed that the 1 000 kW-level combined system can achieve a thermal efficiency of 70%. The power of the reactivity-controlled compression ignition (RCCI) engine accounted for 15% of the combined system. In addition, the authors indicated that spark ignition can stabilize the combustion of ICE.
Sapra et al. (2021) proposed a new integrated SOFC – ICE combined cycle using natural gas and applied an HCCI engine. The 750 kW-level SOFC-ICE system power split of 67‒33 showed the highest efficiency improvement of approximately 8%, while UHC and NOx emissions were reduced by approximately 43% and 60%, respectively, compared to a conventional marine natural gas engine. The authors also indicated that the good dynamic performance of the integrated system appeared in the system.
Previous works proposed an SOFC-ICE system fueled with methanol (Qu et al., 2023) and ammonia (Qu et al., 2023), showing high efficiencies of 55.6% and 70.53%, respectively.
The novel combustion technologies, including SAI, HCCI, and RCCI on natural gas or diesel engines, were employed to improve the combustion stability of ICE in the combined SOFC-ICE systems in the aforementioned studies. However, natural gas engines encounter some other problems. Natural gas engines have two technologies: high- and low-pressure injecting engines. The high-pressure injecting engines belong to MAN Diesel & Turbo’s ME-GI engines, which have high NOx and low CO2 emissions (Lars et al., 2011; Yu et al., 2022a). These engines also belong to the diesel cycle, leading to high efficiency (Yu et al., 2022b). Naturally, the Tier Ⅲ standard cannot be achieved without any extra technology on MAN Diesel & Turbo’s ME-GI engines (Cong et al., 2022). The low-pressure injecting engines belong to DF engines of Winterthur Gas & Diesel, which have low NOx, CO, and CO2 emissions. The NOx emissions of DF engines of Winterthur Gas & Diesel can meet Tier Ⅲ standards. However, natural gas has a low flame propagation in the cylinder on the DF engine of Winterthur Gas & Diesel, leading to knock (Liu et al., 2022). Therefore, the compressor ratio of the DF engines of Winterthur Gas & Diesel should be low, which would cause low efficiency. This condition limits improvements in thermal efficiency. Therefore, Winterthur Gas & Diesel proposed the Intelligent Control by Exhaust Recycling (iCER) system (WinGD, 2020), which replaces part of the air with CO2. As the high specific heat capacity molecule, the CO2 in recycling gas can decrease the temperature in the cylinder to inhibit the auto-ignition of natural gas at the end-gas area to hinder knock, which could appropriately improve the compressor ratio. In addition, the exhaust gas of the engine contains harmful substances such as SOx and PM due to lube and diesel as pilot fuel, respectively, which can damage the cylinder during exhaust gas recirculation. Therefore, scrubbers are required (Wang et al., 2022b, Xia et al., 2023). SOFC anode off-gas, which includes CO2 as the most important substance in recycling gas, is clean. Furthermore, H2 exists in SOFC anode off-gas, which could improve combustion, increase efficiency, and enhance flame propagation (Qu et al., 2022; Nguyen et al., 2019). Therefore, the combined SOFC-ICE system was proposed in this paper to replace the complex iCER system of low-pressure injecting natural gas diesel dual-fuel engines, which could uninstall scrubbers. Therefore, engines with a high compression ratio could be employed. A 0-D model of SOFC and a 1-D model of ICE were built. In addition, deep learning successfully conducted system optimization, which belongs to the data-driven model (Yang et al., 2018). Thus, a data-driven model of the SOFC-ICE system was built to achieve optimized calculation. The deep neural network (DNN) model was employed. Furthermore, particle swarm optimization (PSO) was applied to complete system optimization (Dong and Zhang, 2022). Finally, a simple economic analysis model was proposed to evaluate the economy of the system.
The main body of this paper is organized as follows. Section 2 describes the combined SOFC-ICE system and presents the assumption. Section 3 introduces the SOFC, ICE, DNN, and PSO models. Section 4 presents the results of the parameter analysis. This section also describes the optimization results using the PSO model and performs the economic analysis. Section 5 summarizes the study and presents the perspective.
2 System description and assumptions
An SOFC-ICE combined system is proposed in this paper, as shown in Figure 1. The part of natural gas is bypassed before entering ICE to the SOFC subsystem. The bypassed natural gas is then converted into H2 and CO in the reformer before entering SOFC. The heat necessary to heat natural gas before reforming is derived from SOFC anode exhaust gas, which can also cool the anode exhaust gas. In addition, SOFC anode exhaust gas preheats the water going into the reformer. The intake gas temperature of ICE should be low. Therefore, the anode exhaust gas is cooled thoroughly to eliminate the water and then enters the ICE. CO2 can reduce the combustion temperature to prevent knock. Meanwhile, H2 can promote combustion and increase flame propagation, which can also inhibit knock. The high compression ratio of the engine can then be applied. Similarly, the cathode exhaust gas preheats the air at the SOFC cathode. The 5RT-flex50DF low-speed two-stroke dual-fuel engine, which is manufactured by Yuchai Marine Power Co., Ltd., was investigated in this paper, and its data are shown in Table 1.
 Figure 1 System layoutTable 1 5RT-flex50DF engine parameters
Parameters Value Engine type 5-cylinder dual-fuel engine Rated power (kW) 5 850 Rated speed (r/s) 102 Compression ratio 12 Emission standard IMO Tier Ⅲ The methane was applied to replace the natural gas for a simple calculation. In addition, methane can be nearly completely converted into steam reforming at temperatures above 700 ℃ (Chen et al., 2020). Therefore, methane is assumed to be completely converted to H2 and CO in the reformer, which has a volume ratio of 3∶1. The ionic equation at the SOFC anode and the water-gas shift reaction exist in the SOFC anode, as shown in the following equations.
$$\mathrm{O}^{2-}+\mathrm{H}_2 \rightarrow \mathrm{H}_2 \mathrm{O}+2 e^{-},$$ (1) $$\mathrm{CO}+\mathrm{H}_2 \mathrm{O} \Leftrightarrow \mathrm{CO}_2+\mathrm{H}_2 .$$ (2) A natural gas mass flow rate of the system of 0.23 kg/s is set. Power split was achieved by controlling the natural gas bypass valve.
3 Research approach
The study in this paper was conducted by simulation, which was verified by tests. The 0-D model of SOFC and the 1-D model of ICE were regarded as agent models, while the DNN model was regarded as the data-driven model. The agent and data-driven models were employed, as shown in Figure 2.
 Figure 2 Research methodology
3.1 SOFC model
A 0-D model of SOFC was established, and the methods are derived from the literature (Aguiar et al., 2004), as shown in Table 2. This model facilitates the calculation of the voltage, current density, power, efficiency, and various polarization losses. The polarization loss includes ohmic, concentration, and activation polarizations. Ohmic polarization comprises the resistance of ions to flow through the electrolyte and that of electrons to flow through the electrode. Concentration polarization comprises the limit of mass transfer of gas-phase materials through the electrode. Active polarization involves the charge transfer resistance of the electrochemical reaction between cathodes and anodes. The electrode is a good electric conductor; thus, the electric potential on the electrode surface is the same. Therefore, each control body is equivalent to a parallel relationship; that is, the output voltage of each control body is the same, which is equal to the output voltage of the fuel cell.
Table 2 SOFC modelSOFC model Open-circuit voltage $ U_{\mathrm{OCP}}=-\frac{\Delta G}{2 F}$ Actual voltage $ \begin{aligned} U= & U_{\mathrm{OCP}}-\left(\eta_{\mathrm{Ohm}}+\eta_{\text{conc,an}}+\eta_{\text{conc,ca}}\right. \\ & \left.+\eta_{\text{act,an}}+\eta_{\text{act,ca}}\right) \end{aligned}$ Ohm polarization $ \eta_{\mathrm{Ohm}}=j\left(\frac{\tau_{\mathrm{an}}}{\sigma_{\mathrm{an}}}+\frac{\tau_{\mathrm{el}}}{\sigma_{\mathrm{el}}}+\frac{\tau_{\mathrm{ca}}}{\sigma_{\mathrm{ca}}}\right)$ Concentration polarization $ \begin{aligned} \eta_{\text {conc }} & =\frac{R T_{\mathrm{PEN}}}{2 F} \ln \left(\frac{p_{\mathrm{H}_2 \mathrm{O}, \mathrm{TPB}}}{p_{\mathrm{H}_2 \mathrm{O}}} \cdot \frac{p_{\mathrm{H}_2}}{p_{\mathrm{H}_2, \mathrm{TPB}}}\right) \\ & +\frac{R T_{\mathrm{PEN}}}{2 F} \ln \left(\frac{p_{\mathrm{O}_2}}{p_{\mathrm{O}_2, \mathrm{TPB}}}\right) \end{aligned}$ Activation polarization $ \begin{aligned} j=j_{0, \mathrm{ca}} & {\left[\exp \left(\frac{F}{R T_{\mathrm{PEN}}} \eta_{\text {act, ca }}\right)\right.} \\ & \left.-\exp \left(-\frac{F}{R T_{\mathrm{PEN}}} \eta_{\text {act, ca }}\right)\right] \end{aligned}$ SOFC power $ P_{\mathrm{FC}}=\bar{j} U_f W_{\mathrm{FC}} L_{\mathrm{FC}}$ SOFC efficiency $ \eta_{\mathrm{FC}}=\frac{\bar{j} U_f L_{\mathrm{FC}} W_{\mathrm{FC}}}{L H V_{\mathrm{in}} \dot{N}_{\mathrm{in}, \mathrm{an}}}$ The accuracy of the model is verified by applying the results of the test conducted by Zhao et al. (Zhao and Virkar, 2005). The boundary condition is shown in Table 3, and the result is presented in Figure 3. The figure reveals that the polarization loss would increase due to a rise in current density. The activation polarization loss can be observed at low current density, the ohmic polarization loss can be observed at medium current density, and the concentration polarization can be observed at high current density. Moreover, the maximum errors emerge at low current density, which was caused by numerical calculation. The model of activation polarization is a set of two-dimensional transcendental equations rather than a simple formula. Therefore, numerical calculations reveal a large error. The results show that the simulation curve fits well with the experimental results, whose average error is 5.87%, meeting the accuracy requirement of thermodynamic analysis. In addition, other studies have been applied to compare the models in this paper in the presence of good results.
Table 3 Boundary conditionParameters Value Operating temperature (K) 973 Anode thickness (μm) 1 000 Cathode thickness (μm) 20 Electrolyte thickness (μm) 8 Panel length (m) 0.4 Panel width (m) 0.1 Fuel 97%H2/3%H2O  Figure 3 Verification result (Wang, 2020)
3.2 ICE model
A 1-D model of ICE is established employing GT power, as shown in Figure 4. The following five modules comprise the model, including a turbocharger, intake/exhaust system, cylinder, crankcase, and intercooler. The test conducted by Yuchai Marine Power Co., Ltd. (Yuchai Marine Power Co., 2016) verified the model, and its results are shown in Figure 5 and Table 4. Table 5 shows the test environment. The test cylinder pressure curve fits well with the simulation cylinder pressure curve, whose maximum error is 3.53% at the highest pressure. Moreover, the maximum error is 3.85% at the parameter scavenging pressure at 25% load in other data. The errors in power and break-specific gas consumption (BSFC) are fewer. Therefore, the model meets the requirement of calculation accuracy.
 Figure 4 ICE model
 Figure 5 Comparison between the simulated and the experimental in-cylinder pressuresTable 4 Comparison between the simulated and the experimental data
Load (%) Parameters Power (kW) Maximum pressure (bar) BSFC (g/kW·h) Scavenging pressure (MPa) Test 5 877 161.5 157.4 0.415 100 Simulation 5 886 155.8 156.9 0.430 Error 0.15% 3.53% 0.32% 3.61% Test 4 388 122.4 154.2 0.305 75 Simulation 4 448 123.3 156.4 0.316 Error 1.36% 0.81% 1.43% 3.61% Test 2 930 76.3 160.3 0.205 50 Simulation 2 986 77.5 163.7 0.210 Error 1.91% 1.57% 2.12% 2.44% Test 1 459 42.8 175.8 0.13 25 Simulation 1 424 42.3 172.0 0.125 Error 2.40% 1.17% 2.16% 3.85% Table 5 Test environmentParameters Values Load (%) 100 75 50 25 Atmospheric pressure (kPa) 101.01 101.06 101.07 101.08 Intake air temperature (℃) 34.3 33.3 32.3 32.2 Intake air humidity (g/kg) 22.05 22.50 22.52 21.55 Atmospheric relative humidity (%) 71.5 77.2 78.6 76.2 3.3 DNN model
The aforementioned model of SOFC includes three free variables, which are the number of cells, fuel utilization, and current density, which influence SOFC and ICE. If the combined model is employed to conduct optimization, then this model will increase the time cost. Therefore, the data-driven model by DNN is established to simulate the SOFC-ICE system, as shown in Figure 6. The 0-D model of SOFC and the 1-D model of ICE are applied as agent models to provide a dataset for DNN. The input parameters comprise the number of cells, fuel utilization, and current density, and the output parameters comprise the power of SOFC and ICE. The mean absolute error is used in DNN as the loss function (Karunasingha, 2022), and the Adamax function is utilized as the optimizer (Kingma and Jimmy, 2014). Table 6 shows other information.
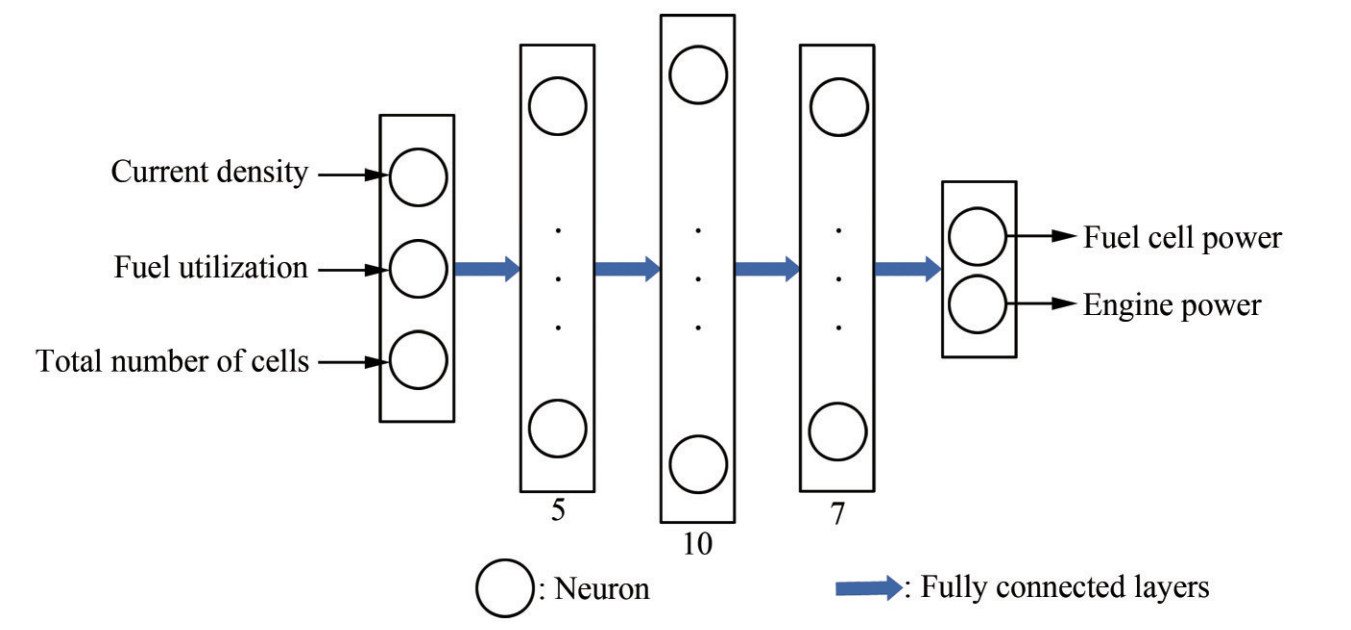 Figure 6 DNN layoutTable 6 Information of DNN
Parameters Value Loss function L1 loss function: L (Y, f (x)) = |Y − f(x)| Optimizer Adamax function: ut = max (βut−1, |gt|) Learning rate 0.001 Training dataset proportion 80% Test dataset proportion 20% The range of input parameters is shown in Table 7 for establishing the dataset, whose number is 1 780. The Z-score normalization method is employed to normalize data, as shown in the following equation:
$$x_{\text {new }}=\frac{x-\mu}{\sigma} .$$ (3) Table 7 Input parametersParameters Value Number of cells/ intervals: 1 000 4 000‒10 000 Current density/ intervals: 0.05 0.1‒1 Fuel utilization/ intervals: 0.05 0.3‒0.85 The error analysis is conducted to verify the generalization capability of DNN, as shown in Figure 7. The errors of the training and test sets can decrease and converge effectively, respectively, during model training. The average relative error of the model after 600 times of training is less than 0.2%, which meets the requirement of calculation accuracy.
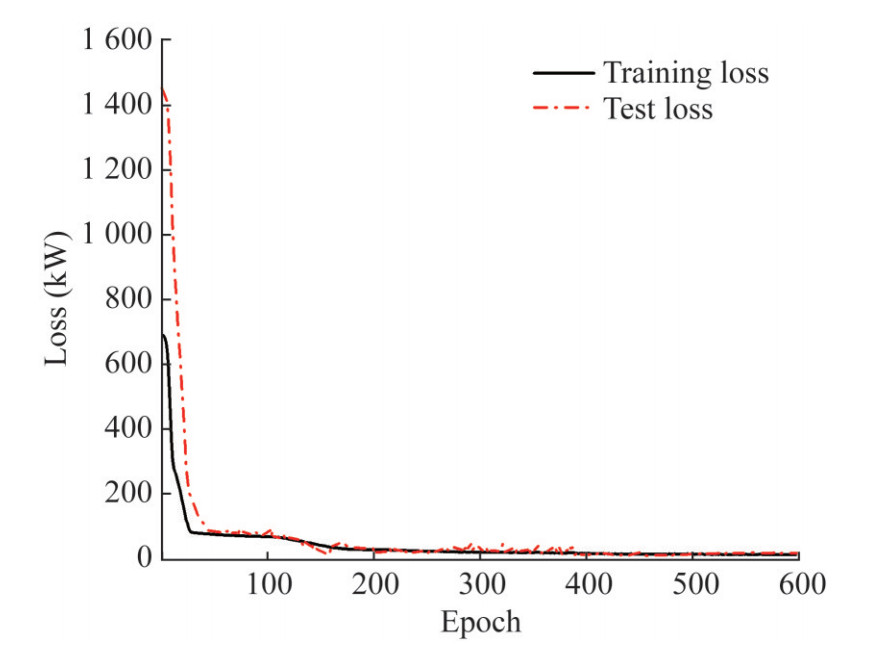 Figure 7 Training and test of DNN
3.4 PSO model
Table 8 presents the PSO model.
Table 8 PSO modelPSO algorithm Main formula $ \begin{gathered} v_i^d=w v_i^{d-1}+c_1 r_1\left(p \text{best}_i^d-x_i^d\right)+c_2 r_2\left(\text{gbest}^d-x_i^d\right) \\ x_i^{d+1}=x_i^d+v_i^d \end{gathered}$ Learning factor $ v_i^d=w v_i^{d-1}+c_1 r_1\left(p \operatorname{best}_i^d-x_i^d\right)+c_2 r_2\left(\operatorname{best}^d-x_i^d\right)$ Inertia weight $ v_i^d=\boldsymbol{w} v_i^{d-1}+c_1 r_1\left(p \text{best}_i^d-x_i^d\right)+c_2 r_2\left(\text{gbest}^d-x_i^d\right)$ 3.5 Evaluation parameters
The total efficiency of the SOFC-ICE combined system can be calculated using the following equation:
$$\eta_{\text{SOFC - ICE}}=\frac{P_{\text{SOFC - ICE}}}{\mathrm{LHV}_{\text{in_sys}} \dot{N}_{{\text{in}}\_{sys} }}, $$ (4) where ηSOFC - ICE is SOFC-ICE system efficiency, PSOFC - ICE is SOFC-ICE system power, LHVin_sys is the low heat value of natural gas, and $ \dot{N}_{{\text{in}}\_{sys} }$ is moles of natural gas entering the system. The system is bound to encounter the overweight problem due to the low gravimetric-specific energy of fuel cells. Therefore, the economic analysis includes the mass of SOFC. The saving of gas from the proposed system is calculated to evaluate its economy. Moreover, excess weight from the system is offset by a decrease in goods. The gains in gas savings per year can be calculated using the following equation:
$$\begin{aligned} & \text{Gain}_{\text{sys}}=\text{Cost}_{\text{gas}}\sum\nolimits_i \Delta m_{\text{saving},i} \text{time}_i- \\ & \quad\left(P_{\text{SOFC}}\div G_{\text{SOFC}}+P_{\text{ICE}} \div G_{\text{ICE}}\right) \text{price}_{\text{goods}}, \end{aligned}$$ (5) where Gainsys is the gain of a single shipment, Costgas is natural gas price, msaving,i is saving of gas at load i, PSOFC is SOFC power, GSOFC is SOFC mass, PICE is ICE power, GICE is ICE mass, and pricegoods is the price of a single shipment. In addition, this paper employs a general technoeconomic analysis method to calculate the payment period. That is, the payment period is derived from investments in SOFC, considering the inflation rate divided by gains, as shown below:
$$\mathrm{PP}=\frac{\text { price }_{\text {SOFC }} \mathrm{P}_{\mathrm{SOFC}}(1+\gamma)^{\mathrm{PP}} \text { time }}{\text { Gain }_{\text {sys }} \times 24 \times 365},$$ (6) where PP is the payment period, priceSOFC is SOFC price, and time is the total operating time of the ship.
4 Results
4.1 Parameter analysis
Figure 8 shows the influence of current density on SOFC and ICE. As current density increases, SOFC power increases, but SOFC efficiency decreases. This phenomenon may be attributed to the increase in current density, which can raise the power and fuel consumption of SOFC. The increase in fuel consumption is higher than that in power. In addition, the increase in current density can reduce ICE power because such an increase can reduce the fuel supply of the ICE. Thus, the current density has a negative effect on ICE power.
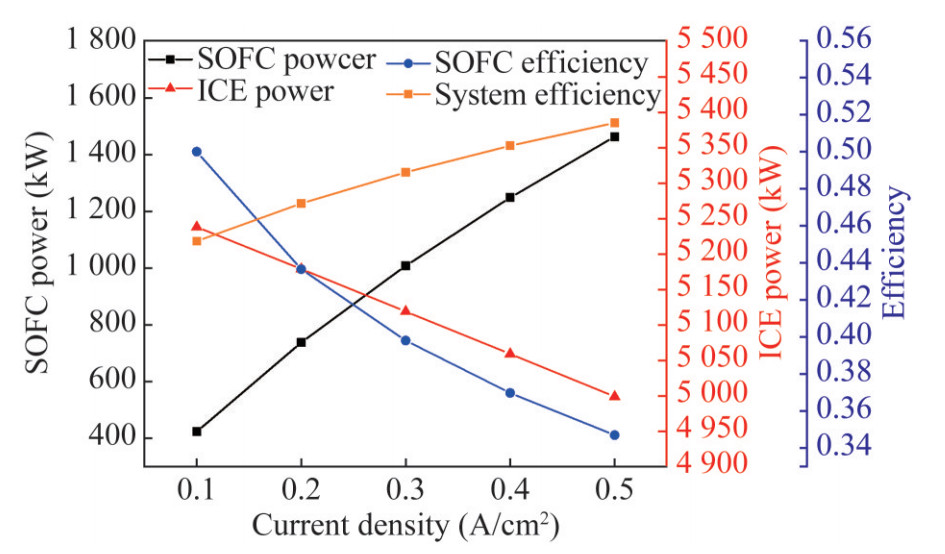 Figure 8 Influence of current density
Figure 9 shows the impact of fuel utilization. The calculation of the open-circuit voltage of a fuel cell is mainly affected by the Gibbs free energy of hydrogen and the partial pressure of hydrogen and oxygen under a unit-mole electrochemical reaction. The former is the main factor affecting the open-circuit voltage, while the hydrogen and oxygen partial pressures have minimal effect on the open-circuit voltage. Fuel utilization can affect the partial pressure of hydrogen and oxygen. However, the influence of fuel utilization is ignored in the electrochemical calculation of fuel cells in this paper. Therefore, in the calculation results of the 0-D model, the change in fuel utilization does not influence SOFC power. Moreover, the improvement of fuel utilization will enhance the thermal efficiency of fuel cells. This phenomenon is mainly due to the increase in the amount of hydrogen participating in electrochemical reactions when fuel utilization rises and the fuel consumption reduction in fuel cells under the same power generation, leading to an increase in thermal efficiency. The decrease in fuel consumption of SOFC will lead to an increase in the fuel supply of ICE. However, the increase in fuel utilization will lead to a reduction in hydrogen in the exhaust gas of the anode.
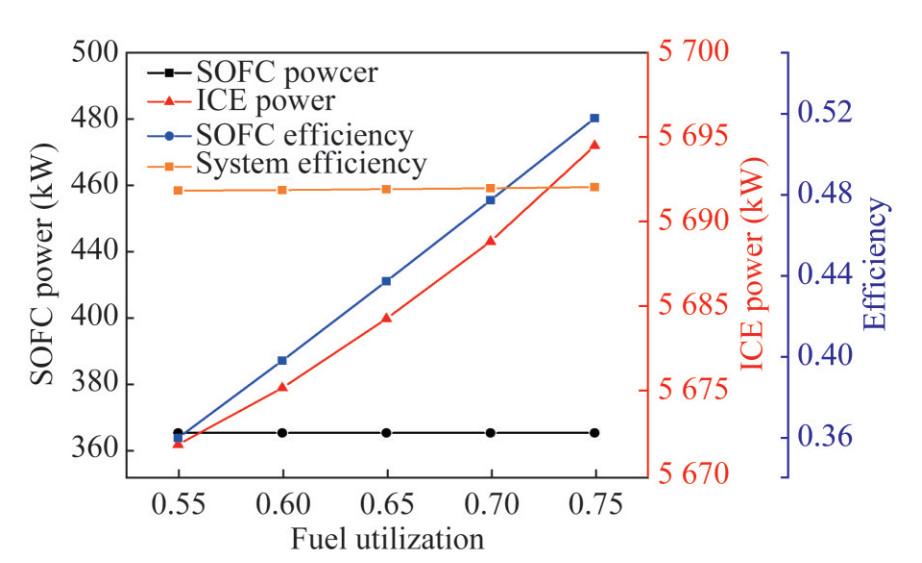 Figure 9 Influence of fuel utilization
Figure 10 shows the influence of the number of fuel cells. A resistance at the junction is observed when single cells are connected into a stack. However, this resistance can be ignored in the thermodynamic calculation. Therefore, the number of fuel cells does not affect the thermal efficiency of SOFC but only promotes power. On the contrary, the increase in SOFC power will inevitably lead to a decrease in ICE power.
 Figure 10 Influence of the number of cells
4.2 Optimization
Different power splits for the system will demonstrate different system performances. In addition, the parameter study shows that fuel utilization, current density, and the number of cells can affect the power split of the system. Therefore, PSO is used in this paper to realize the optimized calculation of the system.
The current density, fuel utilization, and number of cells are selected as optimized parameters, and the thermal efficiency of the system is chosen as the optimized objective. The range of optimized parameters is shown in Table 9. Figure 11 shows the optimized process. PSO found the optimal solution after 30 iterations, at which point the thermal efficiency of the combined system was 51.8%. The original engine has a thermal efficiency of 46.7%, which is a 5.1% improvement over the original engine. The system parameters after the optimized calculation are shown in Table 10. The results show that the current density is 0.65, the fuel utilization is 0.46, and the number of cells is 9063. Interestingly, the power split under the optimal solution was 22.4%/77.6%, with the engine operating within the maximum efficiency range. These results also meet the expected conjecture.
Table 9 Optimized parametersParameters Value Current density 0.1–0.7 Fuel utilization 0.4–0.8 Number of cells 4 000–10 000  Figure 11 Optimized processTable 10 Optimal results
Parameters Value Current density 0.65 Fuel utilization 0.46 Number of cells 9 063 CO2 mass flow rate/(kg/s) 0.16 CO2 concentration ratio 38.9% NOx emission of ICE/(g/kWh) 1.55 Power split of SOFC/ICE 22.4%/77.6% The CO2 concentration ratio of engine inlet gas versus engine outlet gas is 38.9% due to the 0.16 kg/s mass flow rate of CO2, which achieves a low NOx emission of 1.5 g/kWh. However, the forced combustion by H2 has improved combustion, which will prevent the extra-low NOx emission. Moreover, a high compression ratio can be employed, as shown in Figure 12. The indicated efficiency of ICE will be improved with the increase in compression ratio. The compression ratio can also affect cylindrical pressure, as shown in Figure 13. The high compression ratio can cause a high peak pressure and pressure raising ratio, which can contribute to high power output and high indicated efficiency, respectively.
 Figure 12 Influence of compression ratio
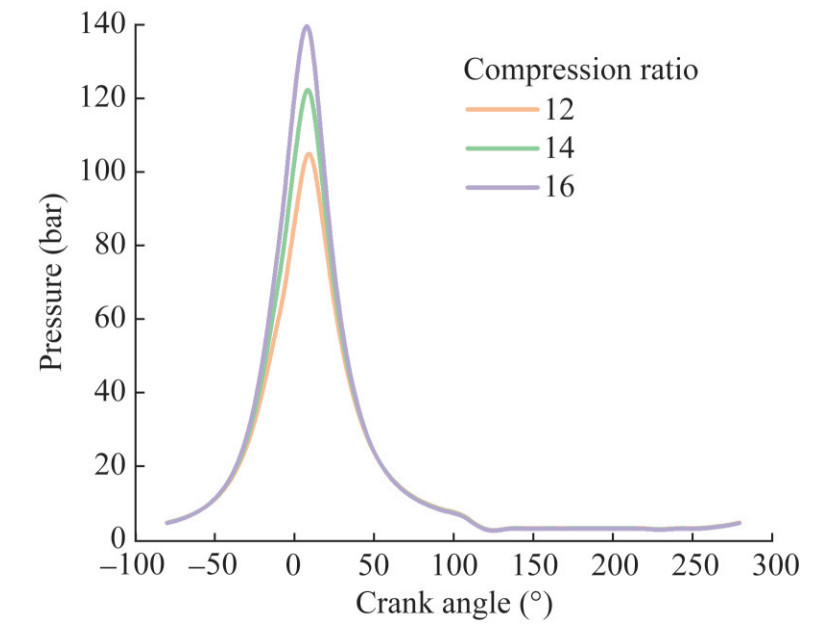 Figure 13 Cylindric pressure of different compression ratios
Furthermore, an increase in compression ratio can change NOx emissions. Figure 14 shows that NOx yields increase with the compression ratio. Specifically, the NOx concentration rapidly rises as the compression ratio is increased from 14 to 16. This finding contributes to the different variations of specific NOx emissions. Figure 15 shows that the specific NOx emissions increase first and then decrease. This trend is due to the rising ratio of power, which cannot follow the increasing ratio of NOx concentration.
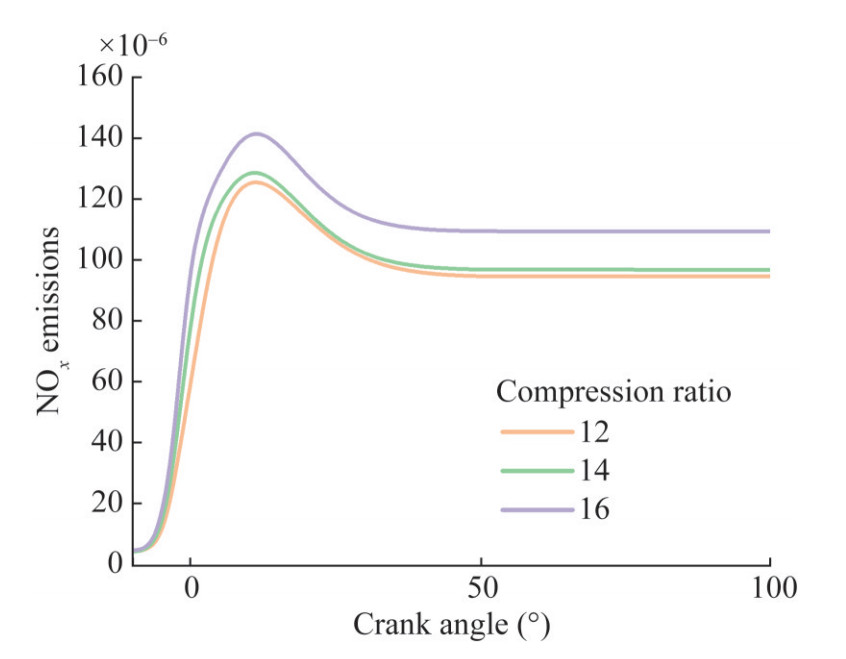 Figure 14 NOx concentrations at different compression ratios
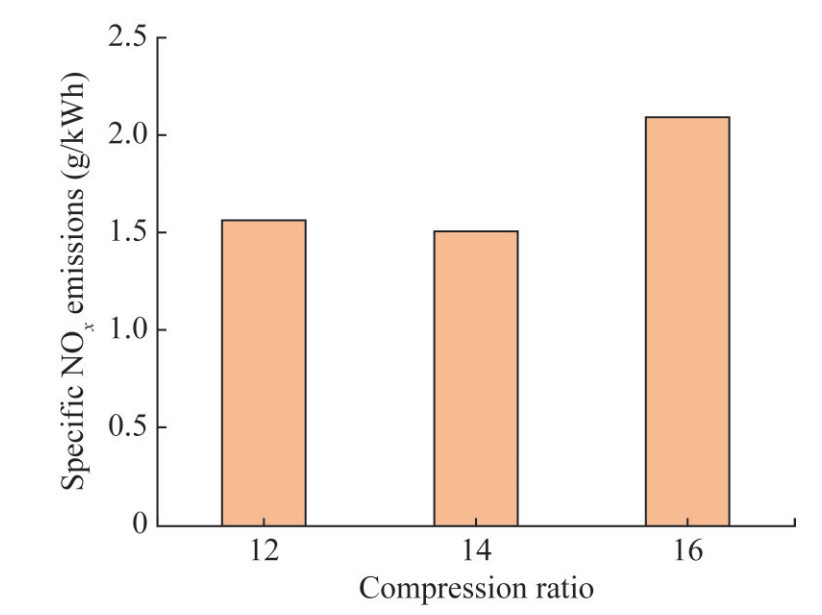 Figure 15 Specific NOx emissions at different compression ratios
4.3 Economic analysis
The economy of the optimal system is calculated according to Equations (5) and (6). The bulk carrier from Fuzhou, China, to Taiwan, China, is proposed as an example. The parameters are shown in Table 12. The power density developed by Bloom Energy is 300 kW, whose gravimetric-specific energy is 18.99 kW/t (Bloomenergy, 2022). In addition, Wartsila reported that the weight of ICE is 200 t; therefore, the gravimetric-specific energy is 29.25 kW/t (Yuchai Marine Power Co., Ltd., 2016). The transportation time from Fuzhou, China, to Taiwan, China, is assumed to be 100 h, and the 4.54 $/ton price of goods is proposed. In addition, the SOFC price was set at 1 500 $/kW (Thijssen, 2007). In addition, the operating hours of the ship’s power system are shown in Table 11. The table also reveals the savings in gas at different loads employing the proposed system. The results reveal that the application of this system can save $3.963 for short-distance logistics, and the investment of an SOFC system can make a return in 8.41 years if the ship continuously operates. Moreover, long-distance logistics will provide a short payback period. Furthermore, the low price of transporting goods will have a short payback period.
Table 11 Characteristics of power system operating hours and saving of gasLoad (%) Percentage of operating hours (%) Operating hours (h) Saving gas (kg/h) 100 7 7 21.59 75 40 40 10.27 50 35 35 11.06 25 18 18 34.16 Table 12 Boundary condition of economic analysisParameters Value Price of natural gas ($/t) 807 Time of transporting goods (h) 100 Gravimetric-specific energy of SOFC (kW/t) 18.99 Gravimetric-specific energy of ICE (kW/t) 29.25 Price of transporting goods ($/t) 4.54 SOFC price ($/kW) 1 500 Gainsys ($/time) 3 963 Inflation rate 0.035 payback period (year) 8.41 5 Discussion
A combined system including SOFC and ICE that can be applied to marine environments in the future is proposed in this paper. The load characteristics of the low-speed engine demonstrate that when the power increases, the thermal efficiency first increases and then decreases, and the power range with the highest thermal efficiency is called the economic load range. Therefore, a high-efficiency SOFC is proposed to replace a part of the ICE load and ensure its highly efficient working range. Simulation and optimized calculation reveal that the results are consistent with expectations, and the thermal efficiency of the optimized system is increased by 5.1% compared with the original ICE. In addition, the use of the proposed system could usually save natural gas consumption and money on a bulk carrier. The results show that the payback period through the short-haul cargo transport system is 8.41 years, while that for long-haul cargo transport will be even shorter. This finding demonstrates the good economy of the proposed system. Enhanced combustion exists in ICE, which can also improve efficiency. Only a steady performance analysis is conducted in this paper. However, the SOFC-ICE system must also conduct a dynamic performance analysis. Moreover, only one load is studied in this paper; therefore, the other load should be investigated in the future. Furthermore, only system weight was considered in the simple economic analysis model proposed in this paper. However, other influential factors that can affect the economy also exist. Therefore, a comprehensive and detailed economic analysis model should be studied for SOFC systems.
The economic analysis in this paper considers the saving of gas on a voyage based on operating load characteristics. The shaft generator (Chin et al., 2022) can be used because the excess power could replace a diesel or dual-fuel generator at full load operating SOFC and ICE, which will save additional money.
This generator can realize a CO2 concentration ratio of 38.9%. Therefore, a low NOx emission has been observed, while a high compression ratio could be employed. Interestingly, high compression ratios will also introduce engines with high efficiency in diesel mode. However, a simple calculation of the compression ratio was conducted in this paper. Therefore, the optimization of compression ratio considering knock must be performed in future studies of low-pressure injecting diesel-natural gas engines in the SOFC-ICE system.
In addition, the popularity of ammonia and methanol as non-carbon and carbon-neutral fuels, respectively, increases in the next stage toward carbon neutrality. The proposed system also has a guiding significance in the future, with the development of SOFC and ICE fed by ammonia, methanol, and other non-carbon or carbon-neutral fuels. The proposed system in this paper can provide references for follow-up research, such as enhanced combustion technology (Liu et al., 2021; Wu et al., 2022) and fuel adaptability of SOFCs (Wan et al., 2021).
6 Conclusion
An SOFC-ICE combined system was proposed in this paper. The 0-D model of SOFC and the 1-D model of ICE were built as agent models based on the previous test to produce the dataset. Moreover, DNN was used to simulate the SOFC-ICE system. PSO was then applied to achieve optimized calculations. Finally, an economic analysis was conducted. The main conclusions are presented as follows.
First, the current density can directly and indirectly affect the power of SOFC and ICE, respectively, by influencing the anode exhaust gas component. In addition, the current density can promote power but inhibit the thermal efficiency of SOFC. Second, after ignoring the slight effect of fuel utilization on the open-circuit voltage, fuel utilization only affects the thermal efficiency of SOFC and the power of ICE. Finally, the number of cells can only influence the power distribution between SOFC and ICE when the resistance at the cell connection is ignored.
The SOFC-ICE system enables high thermal efficiency. The thermal efficiency of the SOFC-ICE combined system can reach 51.8% after optimization, which is 5.1% higher than the original engine. In addition, the power split between SOFC-ICE in the system is 22.4%/77.6% at the highest efficiency, which is the highly efficient working range of ICE.
Such an integration can improve the compression ratio with the avoidance of knock. The results show that high efficiency, power output, and NOx yields can be obtained. However, the lowest specific NOx emissions occur at a compression ratio of 14, in which the efficiency is 47.5% and the NOx emissions are 1.499 g/kWh.
Taking Fuzhou, China, to Taiwan, China, as an example, calculations reveal that the proposed system can save $3.963 in one shipment. In addition, the system has a payback period of 8.41 years. If ships take long routes or transport low-priced goods, then the savings will be high, and the payback period will be short.
Future studies should develop the engine model with the knock model to optimize the compression ratio precisely with an acceptable knock range.
Competing interest The authors have no competing interests to declare that are relevant to the content of this article.Open Access This article is licensed under a Creative Commons Attribution 4.0 International License, which permits use, sharing, adaptation, distribution and reproduction in any medium or format, as long as you give appropriate credit to the original author (s) and the source, provide a link to the Creative Commons licence, and indicate if changes were made. The images or other third party material in this article are included in the article's Creative Commons licence, unless indicated otherwise in a credit line to the material. If material is not included in the article's Creative Commons licence and your intended use is not permitted by statutory regulation or exceeds the permitted use, you will need to obtain permission directly from the copyright holder. To view a copy of this licence, visit http://creativecommons.org/licenses/by/4.0/. -
Figure 1 System layout
Figure 2 Research methodology
Figure 3 Verification result (Wang, 2020)
Figure 4 ICE model
Figure 5 Comparison between the simulated and the experimental in-cylinder pressures
Figure 6 DNN layout
Figure 7 Training and test of DNN
Figure 8 Influence of current density
Figure 9 Influence of fuel utilization
Figure 10 Influence of the number of cells
Figure 11 Optimized process
Figure 12 Influence of compression ratio
Figure 13 Cylindric pressure of different compression ratios
Figure 14 NOx concentrations at different compression ratios
Figure 15 Specific NOx emissions at different compression ratios
Table 1 5RT-flex50DF engine parameters
Parameters Value Engine type 5-cylinder dual-fuel engine Rated power (kW) 5 850 Rated speed (r/s) 102 Compression ratio 12 Emission standard IMO Tier Ⅲ Table 2 SOFC model
SOFC model Open-circuit voltage $ U_{\mathrm{OCP}}=-\frac{\Delta G}{2 F}$ Actual voltage $ \begin{aligned} U= & U_{\mathrm{OCP}}-\left(\eta_{\mathrm{Ohm}}+\eta_{\text{conc,an}}+\eta_{\text{conc,ca}}\right. \\ & \left.+\eta_{\text{act,an}}+\eta_{\text{act,ca}}\right) \end{aligned}$ Ohm polarization $ \eta_{\mathrm{Ohm}}=j\left(\frac{\tau_{\mathrm{an}}}{\sigma_{\mathrm{an}}}+\frac{\tau_{\mathrm{el}}}{\sigma_{\mathrm{el}}}+\frac{\tau_{\mathrm{ca}}}{\sigma_{\mathrm{ca}}}\right)$ Concentration polarization $ \begin{aligned} \eta_{\text {conc }} & =\frac{R T_{\mathrm{PEN}}}{2 F} \ln \left(\frac{p_{\mathrm{H}_2 \mathrm{O}, \mathrm{TPB}}}{p_{\mathrm{H}_2 \mathrm{O}}} \cdot \frac{p_{\mathrm{H}_2}}{p_{\mathrm{H}_2, \mathrm{TPB}}}\right) \\ & +\frac{R T_{\mathrm{PEN}}}{2 F} \ln \left(\frac{p_{\mathrm{O}_2}}{p_{\mathrm{O}_2, \mathrm{TPB}}}\right) \end{aligned}$ Activation polarization $ \begin{aligned} j=j_{0, \mathrm{ca}} & {\left[\exp \left(\frac{F}{R T_{\mathrm{PEN}}} \eta_{\text {act, ca }}\right)\right.} \\ & \left.-\exp \left(-\frac{F}{R T_{\mathrm{PEN}}} \eta_{\text {act, ca }}\right)\right] \end{aligned}$ SOFC power $ P_{\mathrm{FC}}=\bar{j} U_f W_{\mathrm{FC}} L_{\mathrm{FC}}$ SOFC efficiency $ \eta_{\mathrm{FC}}=\frac{\bar{j} U_f L_{\mathrm{FC}} W_{\mathrm{FC}}}{L H V_{\mathrm{in}} \dot{N}_{\mathrm{in}, \mathrm{an}}}$ Table 3 Boundary condition
Parameters Value Operating temperature (K) 973 Anode thickness (μm) 1 000 Cathode thickness (μm) 20 Electrolyte thickness (μm) 8 Panel length (m) 0.4 Panel width (m) 0.1 Fuel 97%H2/3%H2O Table 4 Comparison between the simulated and the experimental data
Load (%) Parameters Power (kW) Maximum pressure (bar) BSFC (g/kW·h) Scavenging pressure (MPa) Test 5 877 161.5 157.4 0.415 100 Simulation 5 886 155.8 156.9 0.430 Error 0.15% 3.53% 0.32% 3.61% Test 4 388 122.4 154.2 0.305 75 Simulation 4 448 123.3 156.4 0.316 Error 1.36% 0.81% 1.43% 3.61% Test 2 930 76.3 160.3 0.205 50 Simulation 2 986 77.5 163.7 0.210 Error 1.91% 1.57% 2.12% 2.44% Test 1 459 42.8 175.8 0.13 25 Simulation 1 424 42.3 172.0 0.125 Error 2.40% 1.17% 2.16% 3.85% Table 5 Test environment
Parameters Values Load (%) 100 75 50 25 Atmospheric pressure (kPa) 101.01 101.06 101.07 101.08 Intake air temperature (℃) 34.3 33.3 32.3 32.2 Intake air humidity (g/kg) 22.05 22.50 22.52 21.55 Atmospheric relative humidity (%) 71.5 77.2 78.6 76.2 Table 6 Information of DNN
Parameters Value Loss function L1 loss function: L (Y, f (x)) = |Y − f(x)| Optimizer Adamax function: ut = max (βut−1, |gt|) Learning rate 0.001 Training dataset proportion 80% Test dataset proportion 20% Table 7 Input parameters
Parameters Value Number of cells/ intervals: 1 000 4 000‒10 000 Current density/ intervals: 0.05 0.1‒1 Fuel utilization/ intervals: 0.05 0.3‒0.85 Table 8 PSO model
PSO algorithm Main formula $ \begin{gathered} v_i^d=w v_i^{d-1}+c_1 r_1\left(p \text{best}_i^d-x_i^d\right)+c_2 r_2\left(\text{gbest}^d-x_i^d\right) \\ x_i^{d+1}=x_i^d+v_i^d \end{gathered}$ Learning factor $ v_i^d=w v_i^{d-1}+c_1 r_1\left(p \operatorname{best}_i^d-x_i^d\right)+c_2 r_2\left(\operatorname{best}^d-x_i^d\right)$ Inertia weight $ v_i^d=\boldsymbol{w} v_i^{d-1}+c_1 r_1\left(p \text{best}_i^d-x_i^d\right)+c_2 r_2\left(\text{gbest}^d-x_i^d\right)$ Table 9 Optimized parameters
Parameters Value Current density 0.1–0.7 Fuel utilization 0.4–0.8 Number of cells 4 000–10 000 Table 10 Optimal results
Parameters Value Current density 0.65 Fuel utilization 0.46 Number of cells 9 063 CO2 mass flow rate/(kg/s) 0.16 CO2 concentration ratio 38.9% NOx emission of ICE/(g/kWh) 1.55 Power split of SOFC/ICE 22.4%/77.6% Table 11 Characteristics of power system operating hours and saving of gas
Load (%) Percentage of operating hours (%) Operating hours (h) Saving gas (kg/h) 100 7 7 21.59 75 40 40 10.27 50 35 35 11.06 25 18 18 34.16 Table 12 Boundary condition of economic analysis
Parameters Value Price of natural gas ($/t) 807 Time of transporting goods (h) 100 Gravimetric-specific energy of SOFC (kW/t) 18.99 Gravimetric-specific energy of ICE (kW/t) 29.25 Price of transporting goods ($/t) 4.54 SOFC price ($/kW) 1 500 Gainsys ($/time) 3 963 Inflation rate 0.035 payback period (year) 8.41 -
Aguiar P, Adjiman CS, Brandon NP (2004) Anode-supported intermediate temperature direct internal reforming solid oxide fuel cell. Ⅰ: model-based steady-state performance. Journal of Power Sources, 138(1-2): 120-136. https://doi.org/10.1016/j.jpowsour.2004.06.040 Biert LV, Woudstra T, Godjevac M, Visser K, Aravind PV. (2018) A thermodynamic comparison of solid oxide fuel cell-combined cycles. Journal of Power Sources, 397: 382-396. https://doi.org/10.1016/j.jpowsour.2018.07.035 Biert LV, Godjevac M, Visser K, Aravind PV (2016) A review of fuel cell systems for maritime applications. Journal of Power Sources, 327: 345-364. https://doi.org/10.1016/j.jpowsour.2016.07.007 Bloomenergy (2022) The Bloom Energy Server 5. Available: https://www.bloomenergy.com/resource/bloom-energy-server-es5-300kw/ Chan SH, Ho HK, Tian Y (2002) Modelling of simple hybrid solid oxide fuel cell and gas turbine power plant. Journal of Power Sources, 109(1): 111-120. https://doi.org/10.1016/S0378-7753(02)00051-4 Chen K, Zhao Y, Zhang W, Feng D, Sun S (2020) The intrinsic kinetics of methane steam reforming over a nickel-based catalyst in a micro fluidized bed reaction system. International Journal of Hydrogen Energy, 45(3): 1615-1628. https://doi.org/10.1016/j.ijhydene.2019.11.080 Chin CS, Tan YJ, Kumar MV (2022) Study of Hybrid Propulsion Systems for Lower Emissions and Fuel Saving on Merchant Ship during Voyage. Journal of Marine Science and Engineering. 10: 393. https://doi.org/10.3390/jmse10030393 Chuahy F D, Kokjohn S L (2019) Solid oxide fuel cell and advanced combustion engine combined cycle: A pathway to 70% electrical efficiency. Applied Energy, 235: 391-408. https://doi.org/10.1016/j.apenergy.2018.10.132 Cong Y, Gan H, Wang H (2022) Parameter investigation of the pilot fuel post-injection strategy on performance and emissions characteristics of a large marine two-stroke natural gas-diesel dual-fuel engine. Fuel. 323: 124404. https://doi.org/10.1016/j.fuel.2022.124404 Dong WY, Zhang RR (2022) Stochastic stability analysis of composite dynamic system for particle swarm optimization. Information Sciences, 592: 227-243. https://doi.org/10.1016/j.ins.2021.12.095 Feng Y, Qu J, Zhu Y, Wu B, Wu Y, Xiao Z, Liu J (2023) Progress and prospect of the novel integrated SOFC-ICE hybrid power system: System design, mass and heat integration, system optimization and techno-economic analysis. Energy Conversion and Management: X. 18: 100350. https://doi.org/10.1016/j.ecmx.2023.100350 Gray N, McDonagh S, O'Shea R, Smyth B, Murphy JD (2021) Decarbonising Ships, Planes and Trucks: An Analysis of Suitable Low-Carbon Fuels for the Maritime, Aviation and Haulage Sectors. Advances in Applied Energy, 1: 100008. https://doi.org/10.1016/j.adapen.2021.100008 Hall C, Kassa M (2021) Advances in combustion control for natural gas–diesel dual fuel compression ignition engines in automotive applications: A review. Renewable and Sustainable Energy Reviews, 148. https://doi.org/10.1016/j.rser.2021.111291 Joung TH, Kang SG, Lee JK, Ahn J (2020) The IMO initial strategy for reducing Greenhouse Gas(GHG) emissions, and its follow-up actions towards 2050. Cellular Logistics, 4(1): 1-7. https://doi.org/10.1080/25725084.2019.1707938 Karunasingha DSK (2022) Root mean square error or mean absolute error? Use their ratio as well. Information Sciences, 585: 609-629. https://doi.org/10.1016/j.ins.2021.11.036. Kim J, Kim Y, Choi W, Ahn KY, Song HH (2020) Analysis on the operating performance of 5-kW class solid oxide fuel cell-internal combustion engine hybrid system using spark-assisted ignition. Applied Energy. 260: 114231. https://doi.org/10.1016/j.apenergy.2019.114231 Kingma DP, Jimmy B (2014) Adam: A method for stochastic optimization. arXiv preprint arXiv: 1412.6980. https://doi.org/10.48550/arXiv.1412.6980. Kistner L, Schubert FL, Minke C, Bensmann A, Rauschenbach RH (2021) Techno-economic and Environmental Comparison of Internal Combustion Engines and Solid Oxide Fuel Cells for Ship Applications. Journal of Power Sources. 508: 230328. https://doi.org/10.1016/j.jpowsour.2021.230328 Koo T, Kim YS, Lee YD, Yu S, Lee DK, Ahn KY (2021) Exergetic evaluation of operation results of 5-kW-class SOFC-HCCI engine hybrid power generation system. Applied Energy, 295: 117037. https://doi.org/10.1016/j.apenergy.2021.117037 Lars RJ, Michael JK, Anders A (2011) MAN B & W ME-GI ENGINES. RECENT RESEARCH AND RESULTS. Proceedings of the International Symposium on Marine Engineering. Available: https://www.researchgate.net/publication/260001820 Liu L, Wu Y, Wang Y (2021) Numerical investigation on the combustion and emission characteristics of ammonia in a low-speed two-stroke marine engine. Fuel. 314: 122727. https://doi.org/10.1016/j.fuel.2021.122727 Liu L, Wu Y, Wang Y (2022) Numerical investigation on knock characteristics and mechanism of large-bore natural gas dual-fuel marine engine. Fuel. 310: 122298. https://doi.org/10.1016/j.fuel.2021.122298 Luca M, Tommaso C, Maria T (2021) A Case Study of a Solid Oxide Fuel Cell Plant on Board a Cruise Ship. Journal of Marine Science and Application. 20: 524-533. https://doi.org/10.1007/s11804-021-00217-y Netzel P, Stepinski T (2019) Climate Similarity Search: GeoWeb Tool for Exploring Climate Variability. Chemosphere. 99(3): 475-477. https://doi.org/10.1175/BAMS-D-16-0334.1 Nguyen DK, Sileghem L, Verhelst S (2019) Exploring the potential of reformed-exhaust gas recirculation (R-EGR) for increased efficiency of methanol fueled SI engines. Fuel. 236: 778-791. https://doi.org/10.1016/j.fuel.2018.09.073 Pan P, Sun Y, Yuan C, Yan X, Tang X (2021) Research progress on ship power systems integrated with new energy sources: A review. Renewable and Sustainable Energy Reviews, 144. https://doi.org/10.1016/j.rser.2021.111048 Park SK, Kim TS (2006) Comparison between pressurized design and ambient pressure design of hybrid solid oxide fuel cell–gas turbine systems. Journal of Power Sources, 163(1): 490-499. https://doi.org/10.1016/j.jpowsour.2006.09.036 Prehn M, Jensen F (2021) Hard Liners vs. Laggards, Understanding IMO’s Role in Accelerating or Hindering the Climate Transition. The Annual Conference of the International Association of Maritime Economists. IAME 2021: Accelerating Transitions. Available: https://iame2021.org/ Qu J, Feng Y, Xu G, Zhang M, Zhu Y, Zhou S (2022) Design and thermodynamics analysis of marine dual fuel low speed engine with methane reforming integrated high pressure exhaust gas recirculation system. Fuel, 319: 123747. https://doi.org/10.1016/j.fuel.2022.123747 Qu J, Feng Y, Zhu Y, Wu B, Wu Y, Liu J, Jing H, Gao Y (2023) Thermodynamic analysis and comprehensive system optimization of the near zero emission hybrid power based on SOFC-ICE integrated system fueled with ammonia. Energy Conversion and Management. 294: 117553. https://doi.org/10.1016/j.enconman.2023.117553. Qu J, Feng Y, Zhu Y, Wu B, Wu Y, Xiao Z, Zheng S (2023) Assessment of a methanol-fueled integrated hybrid power system of solid oxide fuel cell and low-speed two-stroke engine for maritime application, Applied Thermal Engineering. 230: 120735. DOI: https://doi.org/10.1016/j.applthermaleng.2023.120735 Rivarolo M, Rattazzi D, Magistri L, Massardo AF (2021) Multi-criteria comparison of power generation and fuel storage solutions for maritime application. Energy Conversion and Management, 244: 114506. https://doi.org/10.1016/j.enconman.2021.114506 Sapra H, Stam J, Reurings J, Biert LV, Sluijs WV, Vos PD, Visser K, Vellayani AP, Hopman H (2021) Integration of solid oxide fuel cell and internal combustion engine for maritime applications. Applied Energy, 281: 115854. https://doi.org/10.1016/j.apenergy.2020.115854 Shi J, Zhu Y, Feng Y, Yang J, Xia C (2023) A prompt decarbonization pathway for shipping: green hydrogen, ammonia, and methanol production and utilization in marine engines. Atmosphere, 14, 584. https://doi.org/10.3390/atmos14030584 Tan XC, Kong LS, Gu BH, Zeng A, Niu MM (2022) Research on the carbon neutrality governance under a polycentric approach. Advances in Climate Change Research, 13(2): 159-168. https://doi.org/10.1016/j.accre.2022.01.005 Thijssen J (2007) The Impact of Scale-up and Production Volume on SOFC Manufacturing Cost. US Department of Energy, National Energy Technology Laboratory. Available: https://corpora.tika.apache.org/base/docs/govdocs1/719/719667.pdf Wan Z, Tao Y, Shao J, Zhang Y, You H (2021) Ammonia as an effective hydrogen carrier and a clean fuel for solid oxide fuel cells. Energy Conversion and Management, 228: 113729. https://doi.org/10.1016/j.enconman.2020.113729 Wang XJ (2020) Thermal Performance Analysis of Fuel Cell Internal Combustion Engine Hybrid System. Harbin Institute of Technology. https://doi.org/10.27061/d.cnki.ghgdu.2020.000600 Wang Z, Kong Y, Li W (2022a) Review on the development of China’s natural gas industry in the background of “carbon neutrality”. Natural Gas Industry B, 9(2): 132-140. https://doi.org/10.1016/j.ngib.2021.08.021 Wang Z, Zhang X, Guo J, Hao C, Feng Y (2022b) Particle emissions from a marine diesel engine burning two kinds of sulphur diesel oils with an EGR & scrubber system: Size, number & mass. Process Safety and Environmental Protection. 163: 94-104. https://doi.org/10.1016/j.psep.2022.04.012 Wang Z, Zhou S, Feng Y, Zhu Y (2020) EGR modeling and fuzzy evaluation of Low-Speed Two-Stroke marine diesel engines. Science of the Total Environment, 706: 135444. https://doi.org/10.1016/j.scitotenv.2019.135444 WinGD (2020) Launching X-DF2.0 with iCER technology. Available: https://www.wingd.com/en/documents/technical-information-notes/wingd_tin018_launching-x-df2-0-with-icer/ Wu P, Bucknall R. (2020) Hybrid fuel cell and battery propulsion system modelling and multi-objective optimisation for a coastal ferry. International Journal of Hydrogen Energy, 45(4): 3193-3208. https://doi.org/10.1016/j.ijhydene.2019.11.152 Wu X, Feng Y, Xu G, Zhu Y, Ming P, Da L (2022) Numerical investigations on charge motion and combustion of natural gas-enhanced ammonia in marine pre-chamber lean-burn engine with dual-fuel combustion system. International Journal of Hydrogen Energy. https://doi.org/10.1016/j.ijhydene.2022.04.283 Wu Z, Zhu P, Yao J, Tan P, Xu H, Chen B, Yang F, Zhang Z, Porpatham E, Ni M (2020) Dynamic modeling and operation strategy of natural gas fueled SOFC-Engine hybrid power system with hydrogen addition by metal hydride for vehicle applications. eTransportation. 5: 100074. https://doi.org/10.1016/j.etran.2020.100074 Xia C, Zhu Y, Liu D, Zhou S, Feng Y, Shi J, Jun Y (2023) Newly developed detailed urea decomposition mechanism by marine engine urea-SCR system crystallization test and DFT calculations. Chemical Engineering Journal. 470: 144176. https://doi.org/10.1016/j.cej.2023.144176 Xia C, Zhu Y, Zhou S, Peng H, Feng Y, Zhou W, Shi J, Zhang J (2023) Simulation study on transient performance of a marine engine matched with high-pressure SCR system. International Journal of Engine Research. 24(4): 1327-1345. https://doi.org/10.1177/14680874221084052 Xing H, Stuart C, Spence S, Chen H (2021) Fuel Cell Power Systems for Maritime Applications: Progress and Perspectives. Sustainability. 13: 1213. https://doi.org/10.3390/ Xu QD, Guo ZJ, Xia LC, He QJ, Li Z, Bello IT, Zheng KQ, Ni M (2022) A comprehensive review of solid oxide fuel cells operating on various promising alternative fuels. Energy Conversion and Management, 253: 115175. https://doi.org/10.1016/j.enconman.2021.115175 Yang F, Cho H, Zhang H, Zhang J, Wu Y (2018) Artificial neural network (ANN) based prediction and optimization of an organic Rankine cycle (ORC) for diesel engine waste heat recovery. Energy Conversion and Management, 164: 15-26. https://doi.org/10.1016/j.enconman.2018.02.062 Yu H, Chen J, Duan S, Sun P, Wang W, Tian H (2022a) Effect of natural gas injection timing on performance and emission characteristics of marine low speed two-stroke natural gas/diesel dual-fuel engine at high load conditions. Fuel. 314: 123127. https://doi.org/10.1016/j.fuel.2021.123127 Yu H, Wang W, Sheng D, Li H, Duan S (2022b) Performance of combustion process on marine low speed two-stroke dual fuel engine at different fuel conditions: Full diesel/diesel ignited natural gas. Fuel. 310: 122370. https://doi.org/10.1016/j.fuel.2021.122370 Yuan Y, Wang J, Yan X, Shen B, Long T (2020) A review of multi-energy hybrid power system for ships. Renewable and Sustainable Energy Reviews, 132: 110081. https://doi.org/10.1016/j.rser.2020.110081 Yuchai Marine Power Co., Ltd (2016) W550005 NOx Emission Certificate Data Zhao F, Virkar AV (2005) Dependence of polarization in anode-supported solid oxide fuel cells on various cell parameters. Journal of Power Sources, 141(1): 79-95. https://doi.org/10.1016/j.jpowsour.2004.08.057 Zhu Y, Zhou W, Xia C, Hou Q (2022) Application and development of selective catalytic reduction technology for marine low-speed diesel engine: trade-off among high sulfur fuel, high thermal efficiency, and low pollution emission. Atmosphere, 13(5): 731. https://doi.org/10.3390/atmos13050731
