
Techno-Economic Comparison of Dual-fuel Marine Engine Waste Energy Recovery Systems
https://doi.org/10.1007/s11804-023-00368-0
-
Abstract
Nowadays alternative and innovative energy recovery solutions are adopted on board ships to reduce fuel consumption and harmful emissions. According to this, the present work compares the engine exhaust gas waste heat recovery and hybrid turbocharger technologies, which are used to improve the efficiency of a dual-fuel four-stroke (DF) marine engine. Both solutions aim to satisfy partly or entirely the ship’s electrical and/or thermal loads. For the engine exhaust gas waste heat recovery, two steam plant schemes are considered: the single steam pressure and the variable layout (single or dual steam pressure plant). In both cases, a heat recovery steam generator is used for the electric power energy generation through a steam turbine. The hybrid turbocharger is used to provide a part of the ship’s electric loads as well. The thermodynamic mathematical models of DF engines, integrated with the energy recovery systems, are developed in a Matlab-Simulink environment, allowing the comparison in terms of performance at different engine loads and fuels, which are Natural Gas (NG) and High Fuel Oil (HFO). The use of NG always involves better efficiency of the system for all the engine working conditions. It results that the highest efficiency value achievable is 56% at 50% maximum continuous rating (MCR) engine load.Article Highlights• Three different energy recovery systems are considered for the application to a DF four-stroke marine engine (MAN 4-stroke DF 516018V) and two different fueling: natural gas and heavy fuel oil;• The solutions can be applied in the maritime sector of hybrid turbocharge (HTC);• Comparative analysis shows that the use of NG involves better energy efficiency of the system for all the engine working conditions;• The simultaneous use of the waste heat recovery (WHR) and WHR-variable layout plants with the HTC one produces a significant increase in ship management cost savings. -
1 Introduction
Regulators and stakeholders in the maritime sector are intensifying their efforts to reduce greenhouse gas (GHG) emissions from shipping. As consequence, nowadays, the ship propulsion systems design has to fulfil the international regulations regarding pollutant emissions and the optimizations of the ship management costs.
According to the fourth International Maritime Organization (IMO) study (IMO 2020), the GHG emissions mainly carbon dioxide (CO2), but also methane (CH4) and nitrous oxide (N2O)), expressed in CO2eq of total shipping (international, domestic, and fishing), have increased from 977 million tonnes in 2012 to 1 076 million tonnes in 2018 (+9.6% increase). The share of shipping emissions in global anthropogenic emissions has increased from 2.76% in 2012 to 2.89% in 2018. On a global scale, the IMO’s goal is to reduce GHG emissions by 40% by 2030 and by another 50% by 2050 (compared to the 2008 level). To achieve these goals, several actions have been and will be undertaken. For instance, the energy efficiency existing ship index (EEXI) was introduced in 2021 and is valid for all vessels over 400 GT under MARPOL Annex Ⅵ from 2023 onwards. The index is defined as a function of the ship type, capacity, and propulsion plant and it aims to improve vessels’ energy efficiency as well as to favour the introduction of innovative and green technologies and low or zero-carbon fuels (DNV 2022). Further action was the introduction of the Carbon Intensity Indicator (CII), which is a mandatory measure under MARPOL Annex Ⅵ applied to all cargo, RoPax, and cruise ships above 5 000 GT, measures the efficiency of a ship transporting goods or passengers. Over the years, the IMO introduced ever more stringent regulations for the Sulphur and Nitrogen Oxides (SOx, NOx) emitted by marine engines in Emission Control Areas (ECA) (IMO 2003; IMO 2008; IMO 2020).
The use of both alternative energy sources and innovative technologies to increase the energy efficiency of the ships could allow the cutting emissions and improve the ship’s performance (hull resistance and propeller efficiency) (Altosole et al., 2020a; Barreiro 2022). The reduction of emissions can be achieved also by recovering part of the waste energy from the ship’s propulsion engine exhaust gas. For instance, it can be used a Waste Heat Recovery (WHR) steam plant for electric energy production through a steam turbine to satisfy the electric and heat loads of a vessel (Ioannidis 1984; Ito and Akagi 1986; MAN 2005, 2010). An interesting methodology of assessing a cogeneration system on a ship is proposed and an experiment is conducted to validate the proposed model by Tien et al. 2007; results show how the net output of the cogeneration system is larger for a larger mass flow rate and a smaller exit temperature of the exhaust. Dzida (2009) presented a concept of a ship combining a high-power recovery system with the main engine, which included a gas power turbine and steam turbine subsystems. Akiliu and Gilani (2010) developed a mathematical model with Matlab to simulate a single-shaft gas turbine-based cogeneration plant with a variable geometry compressor; the effect of several parameters such as temperature, pressure, variable vanes opening, efficiency, and steam generated was studied considering the dynamic thermofluidic behaviour of the components, including the heat exchangers, evaporators, compressors, etc. Dimopoulos and Kakalis (2010) examined the benefits and drawbacks of analysing waste heat and cooling streams by mean value first principal models. In the works of Benvenuto et al. (2014), Choi and Kim (2013), and Grimmelius et al. (2010), different configurations of waste heat recovery systems are described, analysed, and compared, in order to find the optimal plant layout. Altosole et al. (2014) and Benvenuto et al. (2015) verified that this technology could be also adopted for retrofitting.
The CO2 engine emission reduction can be obtained using low-carbon fuels, such as Natural Gas (NG) in the Dual-Fuel (DF) marine engines. The NG also reduces the emissions of other pollutant, which are common in liquid fuels-fed diesel engines (Altosole et al., 2017), by more than 25% for CO2 and CO, 85% for NOx, and more than 95% for SOx (up to 100%) and PM. Additionally, marine DF engine emissions can be further reduced by combining DF with WHR steam plants (Altosole et al., 2019, 2020b; Livanos et al., 2014), thus allowing some NG savings. The efficiency benefits of DFs in comparison with Heavy Fuel Oil (HFO) are shown in the literature(Altosole et al., 2018a, b).
As a novelty, the present work considers a Hybrid Turbo Charger (HTC) to be integrated with the WHR of DF marine engines. It aims to further increase the overall efficiency by producing electric energy through an electric generator connected to the turbocharger shaft (Altosole et al. 2018b, 2021), the additional electric power produced will be used to fulfil part of the vessel electric loads. The investigation conducted aims to evaluate the engine’s overall efficiency in the case of the combination of these engine energy recovery systems, specifically with a common WHR and with a variable layout (WHR-VL), with or without HTC. The paper is structured as follows: Section 2 describes the methodology used and the different energy recovery systems, Section 3 the case study, Section 4 the results including an economic analysis and Section 5 sets out the main conclusions.
2 Methodology
2.1 WHR steam plant
Generally, two basic schemes are used for marine engine WHR steam plants: single or dual steam pressure levels. Basically, the second allows a better energy recovery (Benvenuto et al., 2015). According to the WHR systems manufacturer (Ioannidis 1984) the temperature of 160 ℃ is the lowest limit for the exhaust gas coming from the Heat Recovery Steam Generator (HRSG), due to the sulphur content in the marine liquid fuels This limit reduces the HRSG’s efficiency, mainly in the WHR dual pressure steam plants, that potentially can achieve bigger energy recovery efficiency than the single pressure ones. Since the sulphur content in NG is almost zero, this exhaust gas stack temperature limit cannot be applied thus allowing a potential increase of the HRSG’s efficiency, and then a better NG engines-WHR combined plants (NG–WHR) energy conversion efficiency, compared to the Diesel engine-WHR ones. In the DF marine engine WHR, the same plant is used for both the fuels (liquid fuel for Diesel cycle and NG for Otto cycle), which returns in different exhaust gas mass flows and temperatures at the same engine load and speed. A typical WHR steam plant is essentially composed of an HRSG, with an economizer (E) and an evaporator (EV), which feeds a Steam Turbine (ST) to electric production by an Electric Generator (EG). The turbine exhaust steam is condensed in a condenser (SCO), from which the saturated water is extracted by a Steam Condensing Pump (SCP) and preheated by the Jacket Water (JW) before being sent to the Heat Water Tank (HWT). By the Main Feed Pump (MFP), after being warmed from the turbocharger compressor outlet hot air in the SCavenger (SC), the water is sent to the HRSG economizer (E). The WHR plant layout presented in Figure 1 for single-pressure saturated steam production has been designed and optimized according to(Altosole et al., 2018a, 2022; Benvenuto et al., 2014).
 Figure 1 Marine engine WHR saturated steam plant scheme
Starting with the engine exhaust gas temperature and mass flow rate (1g in Figure 1), the main dimensions, the weight and the performance of the overall WHR plant components have been determined by a computer code developed in MATLAB® environment. The design procedure considers the main equations of the WHR steam plant at the steady-state continuity and energy equation (1) and equation (2):
$$\sum\left(M_i-M_o\right) =0$$ (1) $$\sum\left(M_i h_i-M_o h_o\right) =Q^{\prime}-P$$ (2) and the HRSG finned pipes wall overall heat exchange coefficient (ke) equation (3):
$$\frac{1}{k_e}=\frac{1}{h_e}+R_e+\frac{s}{k} \frac{A_e}{A_{m l}}+R_i \frac{A_e}{A_i}+\frac{1}{h_i} \frac{A_e}{A_i}$$ (3) The heat exchange area (A), required for the HRSG heat exchangers pipes length evaluation is determined using the gas-wall heat exchange balance equation (4) and wall-steam heat exchange equation (5):
$$Q_g^{\prime}=k_g A_e \Delta T_{g-w}$$ (4) $$Q_s^{\prime}=k_s A_i \Delta T_{w-s}$$ (5) In both equations, the temperature differences (ΔTg-w and ΔTw-s) are logarithmic mean temperature differences between gas-wall and wall-steam (Benvenuto et al., 2014). A similar procedure is used to design the other steam plant heat exchangers: the condenser, jacket water, and scavenger. The steam turbine is modelled by the typical steady-state non-dimensional mass flow map (Cohen et al., 1987) while the HRSG steam drum and the heat water tank are modelled as simple fluids mixing tanks.
2.2 WHR Variable Layout (WHR-VL) steam plant
A lower saturated steam pressure plant has been added (Figure 2a blue lines) to the WHR single pressure saturated steam plant scheme of Figure 1, which constitutes the HP Economizer and Evaporator of the new (superheater) steam plant (Figure 2a black solid lines). This new WHR plant part is composed of a Low-Pressure Economizer (E LP), an Evaporator at Low Pressure (EV LP), and a Steam Drum at Low Pressure (SD LP). In addition to the WHR-VL high-pressure steam plant (black solid lines in Figure 2a), when the engine runs with NG, the low-pressure plant section (blue lines) is activated by opening the three valves (V1/V2/V3), taking cold water, after the Steam Condensing Pump (SCP), or saturated steam to the Low-Pressure Steam Drum (SD-LP). This solution allows a greater cooling of the exhaust gas in the HRSG low-pressure evaporator and economizer (EV-LP/E-LP). In these HRSG working conditions, the flue Gas Diverter (GD) is positioned so that the High-Pressure Economizer (E-HP) outflowing gases pass through the Low-Pressure Evaporator and Economizer (EV-LP and E-LP).
 Figure 2 WHR-VL steam plant schemes
When the engine is fuelled by diesel oil fuel (Figure 2b), only the WHR high-pressure steam plant (black lines) is activated. The High-Pressure Economizer (E-HP), the last heat exchanger before the stack, is fed with preheated water by the Jacket Water (JW) and SC respectively, while E-LP and EV- LP (dashed green lines in Figure 2b) are not active with the valves closed. In these conditions, the flue gas diverter is positioned to bypass the E-LP and EV-LP, as consequence, the exhaust gas stack temperature (T4g) remains over the minimum value of 160 ℃.
2.3 WHR and WHR-VL steam plants optimization procedure
The VHR-VL plant works normally with the engine powered by NG and only occasionally with diesel oil, therefore, the plant cycle and its components are designed and optimized referring to the engine operating with NG. Specifically, plants’ components (such as HRSG, steam turbine, and condenser) and Rankine cycles parameters (such as pressures, temperatures, and water/steam mass flow rates) are thermodynamically optimized to maximize the combined plant efficiency (ηCP), defined by Altosole et al. (2018b):
$$\eta_{\mathrm{CP}}=\frac{\sum\limits_i P_{\mathrm{DE}}+P_{\mathrm{ST}}-P_{\mathrm{MFP}}-P_{\mathrm{SCP}}}{\sum\limits_i\left(M_f \mathrm{LHV}_f\right)}$$ (6) where: i is the number of propulsion and diesel generator engines, PDE is the NG and diesel engine power; PMFP is the power of the main feed pump; PSCP is the power of the steam condensing pump; PST is the steam turbine power; LHVf is the fuel lower heating value, and Mf is the fuel mass flow rate.
As reported in (Altosole et al., 2018a; Benvenuto et al., 2014) for both steam plants, the optimization procedure employs a series of constant and variable parameters. As shown in Table 1, in the single-pressure Rankine cycle (WHR plant) the constant variables are the engine exhaust gas temperature and mass flow rate (considered working at 75% MCR load and using NG fuel), condenser pressure, and HP/LP Ship Steam Services (SSS) steam mass flow rates and pressure. The variable parameters (Table 2) are the HRSG SD pressure and pinch point temperature difference (ΔTpp). In addition, in the dual pressure steam plant (WHR-VL) to the above reported fixed parameters are added (Table 1) the new values of the HP SSS steam mass flow rate, the LP SSS steam mass flow rate, and HRSG LP SD pressure (Benvenuto et al. 2014). For the WHR-VL plant, the variable parameters are the same as the WHR ones with the addition (Table 2) of the low-pressure pinch point temperature difference (ΔTppLP). The maximum ηCC value is obtained by varying the variable parameters according to Table 2 (Altosole et al. 2018a; Benvenuto et al. 2014).
Table 1 WHR and WHR-VL systems Rankine cycle and components design fixed parameters (at 75% MCR load and fuelled by NG)WHR plant fixed parameters WHR-VL plant added fixed parameters Engine exhaust gas mass flow rate (kg/s) Engine exhaust gas temperature (℃) Condenser pressure (bar) HP SSS steam mass flow rate (kg/s) HP SSS steam pressure (bar) HP/LP SSS steam mass flow rate (kg/s) HRSG LP steam drum pressure (bar) 26 352 0.065 0.8 7 0/0.35 3 Table 2 WHR and WHR-VL systems HRSG steam plants optimization parameters variation range and stepWHR plant optimization parameters Variation range Variation step WHR-VL plant optimization parameters Variation range Variation step HRSG steam drum pressure (bar) 8–30 0.5 Low press. pinch point temperature differences, ΔTppLP (℃) 5–20 1 Pinch point temperature differences, ΔTpp (℃) 5–20 1 It must be noted that an important WHR plant optimization procedure constraint regards the already mentioned gas stack temperature minimum value, limited to 160 ℃ when the engine is fuelled by liquid fuels; with NG this limit is not considered, due to the sulphur absence (Ioannidis, 1984).
By a second numerical code, the engine–WHR (or WHR-VL) combined plant performances in off-design load conditions are determined by starting from the new values of temperature and mass flow rate of the exhaust gases coming from the engine, and the plant components’ geometrical design data (i. e., heat exchange surface, pipe section, and wall thickness). An off-design code determines the steady-state plant performance by evaluating the thermal exchanges that occur in each HRSG component.
2.4 Hybrid turbocharger
In the last years, the increase of the marine engine turbochargers’ efficiency resulted in a turbine torque excess, compared to the compressor one, in the medium and high-power engine working conditions. For this reason, a common practice is to bypass part of the cylinder exhaust manifold gas mass flow rate (about 10–15% in Normal Continuous Rating) to the turbocharger turbine, to reduce the turbine torque (Shiraishi et al., 2010). Recently, an alternative solution is proposed by Mitsubishi Heavy Industries (Ono et al., 2012; Rusman 2018; Shiraishi et al., 2007, 2015) and by the authors Altosole et al. (2018c, 2021). In this solution, called Hybrid Turbocharger (HTC), a high-speed electric motor-generator is integrated with the conventional marine engine turbocharger shaft. The additional electric energy produced could be used to partially fulfil the vessel’s electric load, by controlling electric voltage and frequency through an inverter (Altosole et al., 2018c) thus reducing the diesel generators’ electric power with a consequent reduction in fuel consumption and emissions.
2.5 Engine and TC/HTC simulator
The data necessary for the HTC simulation, mainly regarding the turbine, compressor torque, and speed, in design, and off-design engine operating conditions are not available from the technical datasheet of the engine (MAN 2015). Therefore, a fully thermodynamic mathematical model of DF engines integrated with an HTC system has been developed in a Matlab-Simulink environment (Altosole et al., 2018c; 2021). An overall scheme of the simulator is reported in Figure 3. Specifically, this allows to simulate the DF engine equipped with a conventional TC or with an HTC (“Electric Motor-Generator” block in Figure 3) using NG or liquid fuels (HFO). Each block simulates the pertinent engine component characteristics and performances according to applicable algebraic and differential equations, and/or steady-state performance maps, using a filling and emptying simulation approach. Being the engine equipped with variable valve timing opening and closing for both intake and exhaust valves (Altosole et al., 2018c; Benvenuto et al., 2017) the model can operate in the Miller cycle mode and the intake valve setting varies with engine load and fuel type. The TC is modelled by a typical steady-state performance map of the compressor and turbine while the TC shaft is governed by a typical dynamic equation (Benvenuto et al., 2017). The Electric Motor-Generator (EMG) module has as inputs the required electric power from the Engine Governor (EMG_cs) and the turbocharger speed value (N_TC) from the TC shaft dynamics; while the outputs are the electric motor-generator torque (Q’_EM/G) and the delivered electric power (P_el).
 Figure 3 Simulink scheme for simulating a marine engine DF integrated with an HTC system
The engine model has been fully validated on reference data supplied by the engine manufacturer for several steady-state working conditions (from 25% to 100% engine MCR load conditions of the DF chosen as a case study, see Section 3 (Altosole et al., 2018c; Benvenuto et al., 2017). The comparison shows a good agreement: with the engine operating both in NG and liquid fuel mode, indeed, the gap between simulated and reference data (provided by the engine manufacturer MAN 51/60 DF Product Guide (2015) generally remains less than 2% at high engine loads (85–100% MCR), and than 4% at medium-low engine loads.
2.6 Economic analysis
Economic analysis has been carried out by evaluating CAPEX and OPEX annual costs (CAPital EXpenditure and OPerational Expenditure) for all the considered systems (Dotto et al., 2021). CAPEX represents the initial Investment Costs (IC), settled to 25 years, which have been estimated for any system configuration starting from the specific machinery costs (referring to engine MCR power) (Dotto et al., 2021; Livanos et al., 2014; Su et al., 2020; Theotokatos et al., 2020), in Table 3 and according to the following equation (7) (Dotto et al., 2021):
$$\mathrm{CAPEX}=\mathrm{IC} \cdot R \frac{(1+R)^n}{(1+R)^n+1}$$ (7) Table 3 Specific machinery costsMachinery items Specific cost (€/kW) Dual fuel and NG engines 295–400 LNG tanks and equipment 200 Mechanical propulsion line 220 Waste heat recovery systems 105–120 Hybrid turbocharger 32 Electric generator 100 where R is the discount rate (for the maritime sector assumed equal to 10% (Livanos et al., 2014)), n is the considered number of years in economic computations.
Table 4 reports the overall costs of the considered systems, normalized to the engine cost without energy recovery.
Table 4 Overall systems normalized costsSystem configuration Normalized costs No recovery (reference) 1.00 WHR 1.13 HTC 1.04 WHR+HTC 1.17 WHR-VL 1.15 WH-VL+HTC 1.19 According to Dotto et al. (2021), OPEX cost is the sum of Annual Fuel Cost (AFC), Annual Lubrification Oil Cost (ALOC), and Annual Maintenance Costs (AMC). For the different system configurations here considered, engines with or without energy recovery systems, cost differences are found only for the AFC and AMC, about the latter, between the different configurations studied, they differ only about the maintenance costs relating to the WHR and HTC systems, whose specific values considered are: 0.3 M€/year for WHR and WHR-VL systems and 0.1 M€/year for HTC one (Dotto et al. 2021).
3 Case study
A mathematical model of the MAN 4-stroke DF (51/60 18V) engine, characterized by an MCR of 17 550 kW of power at 500 rpm (MAN 2015) has been developed as well. In the simulation environment, this engine has been considered for the propulsion of a cruise ferry with an overall length of 211 m, a displacement of 49 257 t, and a max speed of 25.0 knots. For the ship propulsion system, two controllable pitch propellers have been considered, each driven by one DF engine.
The vessel services thermal power needs 0.8 kg/s of saturated steam at 7 bar and 0.35 kg/s at 2 bar (at least). When the NG is used as fuel, to fulfil the ship’s thermal power, only 0.35 kg/s of steam at 2 bar is necessary.
For this application, the MAN DF (51/60 18V) engine’s Normal Condition Rating (NCR) power corresponds to 75% of the MCR (13 162 kW) at 23.1 knots of ship speed (Altosole et al., 2018a).
Figures 4a and b show the engine exhaust gas temperature and outlet mass flow rate respectively trends according to the engine MCR load percentage. It is remarkable the difference in values of the turbine outlet exhaust gas temperature and mass flow rate as function of the fuel and, at different engine loads (Figures 4a and b) (MAN 2015).
 Figure 4 MAN 4-stroke DF (51/60 18V) exhaust gas temperature and mass flow rate as a function of the engine load and fuel (diesel oil: black curves; NG: dotted curves)
The propulsion systems have been compared on the same route: Genoa-Palermo, whose main data are reported in Table 5.
Table 5 Ship route main dataData Genoa-Palermo Length (nm) 427 Ship speed (kn) 22.5 Summer travel number 96 Winter travel number 61 4 Results
A very good agreement between reference and calculated quantities is observed in Altosole et al. (2018a) as regards of physics and thermodynamic parameters of the WHR plant characteristics (i. e., heat exchangers surface and HRSG pipes number, Rankine cycle thermodynamic fluid data and efficiency). A difference value lower 1% is observed by comparison between calculated and reference data at design conditions, these lasts are from two similar existing WHR plants which have been modelled with the procedure used in this article; in the off-design engine working these differences are generally less than 4%.
Considering the engine exhaust gas data reported in Figure 5 and the procedure reported in paragraph 2.2.1, the WHR single-pressure steam plant parameters have been evaluated and optimized. Tables 6 and 7 report the main DF-WHR combined plant data, in both WHR design (NCR condition) and off-design working conditions, with both HFO and NG fuels. In Table 6 and Table 7, the engine efficiency (ηE) is determined according to Benvenuto et al. (2017), the efficiency (ηCP) of the DF-WHR combined plant according to equation (6), and the HRSG one (HRSGeff) according to equation (8) (Benvenuto et al., 2014):
$$\mathrm{HRSG}_{\mathrm{eff}}=\frac{T_{1 g}-T_{4 g}}{T_{1 g}-T_{\mathrm{amb}}}$$ (8)  Figure 5 WHR-VL plant HRSG gas-steam temperature profile vs waste heat recovered with engines operating at 75% MCR load and 488 rpm speedTable 6 DF engine–WHR single pressure combined plant simulator results in design and off-design engine load conditions (Fuel HFO)
Engine-WHR plant parameters Engine load (MCR%) 50 75 85 100 Engine power (kW) 8 775 13 162 14 917 17 550 Engine speed (r/m) 462 488 500 500 SD pressure (bar) 11.8 8.4 8.5 9.1 ΔT pp (℃) 3.6 7.0 7.1 7.6 SSS mass flow rate (kg/s) 0.57 0.57 0.57 0.57 ST mass flow rate (kg/s) 1.03 1.3 6.62 1.99 ST power (kW) 1 075 1 274 1 616 1 981 ηE (%) 44.9 45.6 46.5 46 ηCP (%) 47.6 47.8 48.9 48.6 HRSGeff (%) 53 46 49.1 49 HRSG stack temp. (℃) 171 171 170 176 Table 7 DF engine–WHR single pressure combined plant simulator results in design and off-design engine load conditions (Fuel NG)Engine–WHR plant parameters Engine load (MCR%) 50 75 85 100 Engine power (kW) 8 775 1 3162 14 917 17 550 Engine speed (r/min) 462 488 500 500 SD pressure (bar) 6.7 7.9 8.3 8.7 ΔT pp (℃) 2.6 5.1 5.7 6.2 SSS mass flow rate (kg/s) 0.17 0.17 0.17 0.17 ST mass flow rate (kg/s) 1.5 1.76 1.93 1.9 ST power (kW) 1 384 1 702 1 801 1 807 ηE (%) 46.3 47.3 47.3 47.5 ηCP (%) 50.0 50.2 50.1 50.0 HRSGeff (%) 68.3 58.0 57.1 53.2 HRSG stack temp. (℃) 148 164 169 174 where: T1g and T4g are the HRSG inlet and outlet gas temperature respectively and Tamb is the ambient temperature.
Results of Table 6 show higher values of ηE in the case of the engine-fed NG (in the range of 46.3%–47.5%) compared to HFO (in the range of 44.9%–46.54%) at the same MCR. The WHR system increases the combined plant (DF-WHR) efficiency (ηCP), between 2.5 and 3.7% in the case of NG, and between 2.2 and 2.7% for HFO. Under the same engine working conditions, the fuelling of NG gives always HRSGeff values higher than the case of the HFO; this difference is lowest at 100% engine load (4.2%) and increases up to 15.3% at 50% of engine load. HRSG stack temperature is always equal to or greater than 170 ℃ in the case of HFO, while slightly lower values (in the range of 148–174 ℃) are found with the engine powered with NG.
Figure 5 shows the WHR-VL steam plant the gas and water/steam temperature profile in the HRSG components with the engine running at 75% MCR load and 488 rpm speed, fed with NG and HFO (Figure 5a and Figure 5b, respectively).
It can be seen a better engine exhaust gas waste energy recovery when NG is used as fuel. Moreover, the double-pressure steam plant reduces the HRSG outlet temperature (point 4g in Figure 6a) to a very lower value referring to the single-pressure one (point 4g in Figure 6b).
 Figure 6 HRSG steam plants SD HP pressure and HP pinch point temperature difference at different engine loads
Figure 6a shows that the NG engine-WHR-VL plant HP steam drum pressure is much greater than the NG engine-WHR one. The steam drum pressure in the WHR single steam pressure plant remains always lower by referring to the WHR-VL plant, both in the case of NG and that of HFO fuels. With these fuels, the pertinent WHR steam drum pressure remains about constant at high and medium engine loads while it increases up to 11.8 bar at lower engines load with HFO. This is essentially due to the necessity of maintaining the steam pressure not lower than 7 bar, as required by the high-temperature steam service (only when HFO is used). In this case, the SD pressure is governed by the ILV valve (Altosole et al., 2018b). Figure 6b indicates that, with regards to the HRSG HP pinch point difference temperature, no relevant difference is observed between WHR-VL and WHR steam plants, with the only exception of the WHR-VL plant in the case of engines fed with HFO. In this case, the HRSG HFO-WHR-VL pinch point values are higher varying in the range of 14-19 ℃.
According to Figure 7a, whit the engines fed by NG and at high engine loads, the WHR-VL plant HRSG efficiency is very high compared to that of the WHR single steam pressure. Furthermore, with the engines fed by HFO, the HRSG efficiency is smaller, particularly in the WHR-VL plant. This is particularly due to the HRSG outlet gas temperatures, which are reported in Figure 7b for different engine loads. The HWR-VL plant is more advantageous with the engines fed by NG; while, referring to the WHR-VL plant, the effect of the low-pressure section deactivation is highlighted when the engines run with HFO. As a general comment, being the same as the WHR steam plant scheme used for the engine fed by NG or HFO, the WHR single steam pressure plant is characterized by a minor difference in the HRSG outlet gas temperature between NG or HFO engine fuel.
 Figure 7 HRSG steam plants efficiency and gas outlet temperature at different engine loads
The WHR and WHR-VL plant’s steam turbine mass flow rates trends versus the engine loads, in the case of fuelling NG and HFO, are presented in Figure 8. With the engine load reduction, the ST mass flow rate decreases slightly with an engine powered by NG, while a much more consistent reduction can be seen with the HFO. Regarding the WHR-VL plant, in the double steam pressure, with NG as fuel, the HP steam mass flow rate remains nearly constant for all engine loads, while the LP one value almost reduces to about a quarter of its value at 100% MCR engine load when the engine running at 50% MCR. When the engine is fuelled by HFO in the WHR-VL configuration the turbine steam mass flow rate is the lowest among the cases considered, with a little variation at different engine loads.
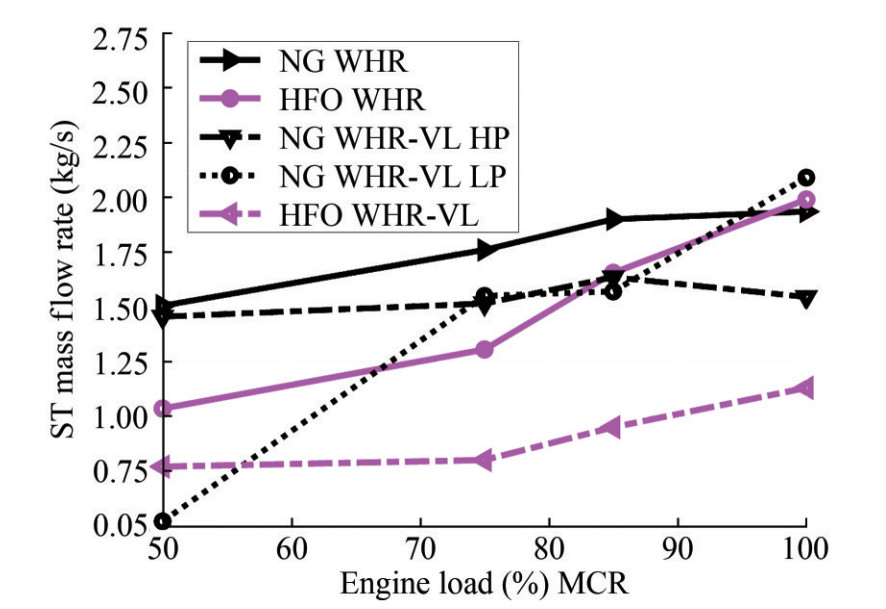 Figure 8 WHR and WHR-VL plants steam turbine mass flow rate vs engine load
4.1 Hybrid turbocharger
According to Section 2.5, the simulator has been used to compare the engine performance with HTC as an alternative to the original TC. Specifically, the data reported in Table 8 and Table 9 refer to engines using HFO or NG, for different working conditions (100%, 85%, 75%, and 50% of the MCR power). Results show that the electric power recovered by the HTC is 728 kW and 769 kW in the case of HFO and NG respectively at 100% MCR. At engine medium and lower loads, the recovered power increases with the engine fed by NG, while it reduces progressively with the engine powered by HFO mainly due to the greater NG’s lower heating value compared to that of HFO (49 000 kJ/kg for NG, 42 700 kJ/kg for HFO), the different combustion processes and equivalence ratio (Altosole et al., 2021).
Table 8 Simulation results condition for the DF engine with HTC (HFO)Engine & HTC parameters Engine load (MCR%) 50 75 85 100 Engine power (kW) 8 775 13 162 14 917 17 550 Engine speed (r/m) 462 488 500 500 HTC electric power (kW) 143 428 690 769 EM/G electric power of Engine power (%) 1.63 3.25 4.15 4.38 Table 9 Simulation results condition for the DF engine with HTC (NG)Engine & HTC parameters Engine load (MCR%) 50 75 85 100 Engine power (kW) 8 775 13 162 14 917 17 550 Engine speed (r/m) 462 488 500 500 HTC electric power (kW) 842 834 801 728 EM/G electric power of Engine power (%) 9.60 6.34 5.37 4.15 4.2 Combined plants comparisons
The electric powers produced by the steam turbine and that by the HTC at different electric loads are reported in Figure 9 for WHR and WHR-VL plants. It is quite evident for the WHR-VL plant the difference between NG and HFO fuels, indicating the highest power production in the case of NG. The steam turbine power difference varies in a range of 1.1 MW and 1.7 MW (at 50% and 75% MCR engine load respectively). The steam turbine electric power difference between the WHR-VL and WHR single steam pressure plants, with both the engines fed by NG, varies between 0.75 MW at 50% and 1.08 MW at 100% engine load, always to the WHR-VL plant’s advantage. According to Figure 9, it should be noted that, with the engine fed by HFO, the WHR steam turbine electric power is always higher than that of the WHR-VL plant, this power difference is greater at 100% engine load (0.71 MW) and decrease almost to cancel itself out to 50% one. With NG fuel, the HTC electric power produced (red dash-dot line in Figure 9) is similar to that of WHR, with an opposed trend to engine load variation. With the engine fed by HFO, the HTC electric power undergoes a consistent and approximately constant decrease as the engine load decreases, from 790 to 146 kW.
 Figure 9 WHR and WHR-VL plants ST & HTC electric powers as a function of the engine load
Fuelling NG gives an engine efficiency that is higher than that of HFO (dash-dot black curves in Figure 10a and Figure 10b, respectively). According to Figure 10a, the engine-WHR plant efficiency with NG is higher than the engine alone from 4.1 to almost 5% with the engine load decreasing. The engine-WHR-VL efficiency is higher than the engine-WHR one (continuous and dashed black lines respectively), with a WHR-VL plant maximum advantage, referring to the WHR one, near to 2% with the engine running to 75% MCR load. Using HTC (dotted red line) with NG increases the engine alone efficiency (dash-dot black line) from 2.6 to 4.8% to the engine load decrease. In combination with the WHR and mainly with the WHR-VL plants, the HTC system increases the engine-WHR & HTC efficiency up to 56% (dash-dotted red line) at 50% of engine load (with the NG the HTC provides the maximum electrical power at 50% of the MCR engine load).
 Figure 10 Engine and combined plants efficiency as a function of the engine load for NG and HFO
Figure 10b shows how with HFO the engine-WHR-VL system efficiency is lower than the system with single pressure WHR (continuous and dash-dot black lines respectively in Figure 10b); this difference is reduced as the engine load decreases. Furthermore, it can be noted that the WHR and WHR-VL plant’s efficiencies vary slightly and have similar values (but with WHR single pressure plant advantage), but these are higher than the efficiency of the engine alone showing a maximum increase of 2.7% at 50% MCR. Figure 10b shows that with HFO fuel the HTC (dotted red line) increases the engine efficiency between 3% to 1% to engine load decrease; indeed, in spite of what happens with NG, in the case of HFO the HTC electric power decreases with the decrease of the engine load, as reported in Table 5. As a consequence, the engine-WHR & HTC system efficiency improvement decreased from 2.5% to 2%, referring to the engine alone efficiency, to engine load increase (solid red line in Figure 10b). The engine-WHR-VL & HTC system efficiency is slightly less referring to the engine-WHR & HTC one (dash-dotted red line in Figure 10).
A comparison with a similar system, a marine DF 4-stroke engine fed with NG with single steam pressure WHR plant, can be made considering the work of Livanos et al. (2014), where it is demonstrated that, within the output engine range from 50 to 100% of the MCR engine load, the engine efficiency of the DF engine with WHR plant increased by 2% (dashed black lines Figure 10a). It should be noted that the efficiency of the engine considered by Livanos et al. (2014) without a WHR plant is not known. No other energy recovery systems from marine DF engines, comparable with the WHR-VL dual stem pressure system have been found in the literature, particularly in combination with the HTC system.
4.3 Economic analysis
Results of the economic analysis show that the installation of WHR-VL leads to a slight increase in costs compared to the simple WHR (see Table 4), furthermore the same table shows that the addition of HTC alone alters the cost of the system by very few values. OPEX costs include the sum of annual fuel and maintenance costs (AFC and AMC respectively) (Dotto et al., 2021). AFC is the sum of NG and MDO annual costs while AMC differs (between the considered systems) only for WHR, WHR-VL, and HTC system installation; in particular, the specific annual maintenance costs are 20 €/kW for WHR and WHR-VL systems and 0.4 €/kW for HTC (Dotto et al., 2021). Being DF marine engines almost always used with NG, and only occasionally with HFO, the considered plant’s economic analysis is carried out with reference to the NG only, with a small quantity of Marine Gas Oil (MGO), used for the start ignition in the engine cylinders. Due to the significant marine fuels price variation in these last years, as shown in the literature (Jeong et al., 2018; MAN 2015; MIDAS 2022; Theotokatos et al., 2020; Sharples 2019; Völker 2015) it has been considered two values (Theotokatos et al., 2020) of the fuels price for the economic analysis of the systems: a baseline value referred to the end 2018 (398 €/t for NG and 575 €/t for MGO), and a 60% increase price referred the previous one (637 €/t and 920 €/t for NG and MGO respectively). Figure 11 shows the economic comparison of the studied systems in the case of the engine fed with NG, being NG the fuel normally used by DF marine engines, while HFO is used only in case of emergency (such as NG exhaustion). Figure 11a and Figure 11b are related to the baseline fuel prices and the increased ones, respectively.
 Figure 11 Engine fed by NG, economic comparison for the case study on the route Genoa-Palermo
In Figure 11 the costs of the reference propulsion system (NG-engines without energy recovery devices, ‘E only’) are represented by the solid red zero line. Each other line is obtained as the difference between the annual reference propulsion system OPEXref and the same parameter referred to the considered option (OPEXco), multiplying each annual cost by the chosen ship’s lifetime (25 years) equation (9):
$$\left(\text{OPEX}_{\text{ref}}-\text{OPEX}_{\text{co}}\right) \cdot 25$$ (9) In the graphs of Figure 11, the considered options ordinate value at the beginning of the lines (year zero) is determined by subtracting the considered plant total cost from the reference one.
Referring to the baseline fuel price (Figure 11a), the propulsion system with WHR or HTC (solid black and magenta lines, respectively) allows analogues economic savings, slightly higher for the HTC, this is due to its lower initial plant cost compared to WHR one. Both systems’ simultaneous use allows greater savings (dotted black line). Employing WHR, HTC, and both energy recovery devices, the respective payback times are 4.1, 0.8, and 2.8 years respectively (Figure 11a). The WHR-VL recovery system obtains better results referring to the WHR one (green and black solid lines respectively in Figure 11a), thanks to the WHR-VL higher energy recovery efficiency. The same consideration can be done if it is combined the WHR-VL with the HTC system (dotted green line in Figure 11a). In these last two cases, the payback times are 4.4 and 2.6 years, respectively.
Comparing Figures 11a and 11b, it results that a high fuel price generates a consistent payback time reduction, and above all, a considerable increase in fuel cost savings in the 25 years of the ship’s life, referring to the same heat recovery system typology.
5 Conclusions
In this paper, three different energy recovery systems have been considered for the application to a DF four-stroke marine engine to increase the overall energy efficiency: engine exhaust gas WHR and WHR-VL steam plants, which can be employed individually or together with an HTC system. Comparisons in terms of performance at different engine loads and with different fuels (NG and HFO) have been carried out, analysing the output results of the engine simulations carried out in the Simulink environment. Results indicated that the use of NG always involves better energy efficiency of the system, compared to HFO, for all the engine working conditions, with or without an energy recovery system. With NG fuel the double steam pressure system (WHR-VL) had higher efficiency than the single pressure one (WHR); in the case of fuelling NG, if the engine load decreased, the HTC electric power slightly increased, while with engine fed by HFO, the HTC considerably reduced to engine load reduction. With the engine fed with NG, the simultaneous use of the WHR, or VHR-VL, and HTC systems led to a very high combined system, with NG fuel this efficiency increased as the load decreased; on the contrary, using HFO the efficiency of these combined systems decreased as the engine load decrease. In conclusion, when the engine was fed with NG, the WHR-VL steam plant allowed a better engine exhaust gas waste heat recovery, compared to the WHR single pressure one, the opposite occurred with the engine powered by HFO. Being the DF engines fed mainly by NG, the combination of WHR-VL & HTC systems resulted as the best choice. In the case of diesel engines, the WHR combination with HTC systems was the best solution. Finally, the economic analysis, referring NG only, shows that all engine waste energy recovery systems bring a considerable economic benefit in the 25 years of considered ship operation time. The simultaneous use of the WHR and WHR-VL plants with the HTC one produces a significant increase in ship management cost savings, particularly in the case of WHR-VL & HTC.
Nomenclature AC air cooler AF compressor inlet air filter AFC Annual Fuel Cost AMC Annual Maintenance Cost Ae pipe wall external area (m2) Ai pipe wall internal area (m2) Aml pipe wall logarithm area (m2) BV bleed valve C turbocharger compressor CAPEX Capital Expenditure CII Carbon Intensity Indicator CP evaporator circulating pump DF Dual-Fuel engine E Economizer ECA Emission Control Area EEXI Energy Efficiency Existing Ship Index EG Electric generator EM/G Electric Motor/Generator ENG Engine EV Evaporator FP Feed Pump GD Gas Deviator GHG Green House Gases HFO Heavy Fuel Oil HP High Pressure HRSG Heat Recovery Steam Generator HTC Hybrid Turbocharger HWT Heat Water Tank h specific enthalpy (kJ/kg) he external pipe convective heat transfer coefficient (kW/(m2 K)) hi internal pipe convective heat transfer coefficient (kW/(m2 K)) k wall thermal conductivity (kW/(m K)) IC Investment cost ILV Isenthalpic Lamination Valve IMO International Maritime Organization JW Jacket Water LP Low Pressure MCR Maximum Continuous Rating MFP Main Feed Pump M mass flow rate (kg/s) N shaft speed (r/min) n Number of years NCR Normal Continuous Rating NG Natural Gas OPEX Operational Expenditure P Power (kW) Q’ shaft torque (Nm) p pressure (Pa) P Power (W) R Discount rate Re external pipe thermal resistance (K/kW) Ri internal pipe thermal resistance (K/kW) SC SCavenger SCO Steam COndenser SCP Steam Condensing Pump SD HRSG evaporator Steam Drum SH SuperHeater SSC Steam Service Condensing outlet SSS Ship Steam Service ST Steam Turbine s pipe wall thickness (m) T temperature (K), turbocharger turbine TC TurboCharger V Valve VL Variable Layout VTNA Variable Turbine Nozzle Area WHR Waste Heat Recovery 0s heat water tank outlet 0s COND steam condensing pump outlet 0sc main feed pump outlet 00sc scavenger water outlet 1g turbocharger turbine outlet 1s economizer water outlet 2g evaporator gas inlet 2s evaporator water inlet 2’s evaporator steam outlet 3g economizer gas inlet 3s superheater steam outlet, steam turbine inlet 3sd HRSG stean drum steam outlet 4g HRSG gas outlet 4s vacuum condenser inlet 5s steam condensing pump 6s jacket water outlet Subscripts a Air amb Ambient cs Control Signal e External el Electric E Engine EM/G Electric Motor/Generator f Fuel g Gas HP High Pressure i Inlet, Internal LP Low Pressure MF Fuel Mass o Outlet s Steam, Signal pp Pinch Point T Turbine TC Turbocharger w Wall Competing interest The authors have no competing interests to declare that are relevant to the content of this article. -
Figure 1 Marine engine WHR saturated steam plant scheme
Figure 2 WHR-VL steam plant schemes
Figure 3 Simulink scheme for simulating a marine engine DF integrated with an HTC system
Figure 4 MAN 4-stroke DF (51/60 18V) exhaust gas temperature and mass flow rate as a function of the engine load and fuel (diesel oil: black curves; NG: dotted curves)
Figure 5 WHR-VL plant HRSG gas-steam temperature profile vs waste heat recovered with engines operating at 75% MCR load and 488 rpm speed
Figure 6 HRSG steam plants SD HP pressure and HP pinch point temperature difference at different engine loads
Figure 7 HRSG steam plants efficiency and gas outlet temperature at different engine loads
Figure 8 WHR and WHR-VL plants steam turbine mass flow rate vs engine load
Figure 9 WHR and WHR-VL plants ST & HTC electric powers as a function of the engine load
Figure 10 Engine and combined plants efficiency as a function of the engine load for NG and HFO
Figure 11 Engine fed by NG, economic comparison for the case study on the route Genoa-Palermo
Table 1 WHR and WHR-VL systems Rankine cycle and components design fixed parameters (at 75% MCR load and fuelled by NG)
WHR plant fixed parameters WHR-VL plant added fixed parameters Engine exhaust gas mass flow rate (kg/s) Engine exhaust gas temperature (℃) Condenser pressure (bar) HP SSS steam mass flow rate (kg/s) HP SSS steam pressure (bar) HP/LP SSS steam mass flow rate (kg/s) HRSG LP steam drum pressure (bar) 26 352 0.065 0.8 7 0/0.35 3 Table 2 WHR and WHR-VL systems HRSG steam plants optimization parameters variation range and step
WHR plant optimization parameters Variation range Variation step WHR-VL plant optimization parameters Variation range Variation step HRSG steam drum pressure (bar) 8–30 0.5 Low press. pinch point temperature differences, ΔTppLP (℃) 5–20 1 Pinch point temperature differences, ΔTpp (℃) 5–20 1 Table 3 Specific machinery costs
Machinery items Specific cost (€/kW) Dual fuel and NG engines 295–400 LNG tanks and equipment 200 Mechanical propulsion line 220 Waste heat recovery systems 105–120 Hybrid turbocharger 32 Electric generator 100 Table 4 Overall systems normalized costs
System configuration Normalized costs No recovery (reference) 1.00 WHR 1.13 HTC 1.04 WHR+HTC 1.17 WHR-VL 1.15 WH-VL+HTC 1.19 Table 5 Ship route main data
Data Genoa-Palermo Length (nm) 427 Ship speed (kn) 22.5 Summer travel number 96 Winter travel number 61 Table 6 DF engine–WHR single pressure combined plant simulator results in design and off-design engine load conditions (Fuel HFO)
Engine-WHR plant parameters Engine load (MCR%) 50 75 85 100 Engine power (kW) 8 775 13 162 14 917 17 550 Engine speed (r/m) 462 488 500 500 SD pressure (bar) 11.8 8.4 8.5 9.1 ΔT pp (℃) 3.6 7.0 7.1 7.6 SSS mass flow rate (kg/s) 0.57 0.57 0.57 0.57 ST mass flow rate (kg/s) 1.03 1.3 6.62 1.99 ST power (kW) 1 075 1 274 1 616 1 981 ηE (%) 44.9 45.6 46.5 46 ηCP (%) 47.6 47.8 48.9 48.6 HRSGeff (%) 53 46 49.1 49 HRSG stack temp. (℃) 171 171 170 176 Table 7 DF engine–WHR single pressure combined plant simulator results in design and off-design engine load conditions (Fuel NG)
Engine–WHR plant parameters Engine load (MCR%) 50 75 85 100 Engine power (kW) 8 775 1 3162 14 917 17 550 Engine speed (r/min) 462 488 500 500 SD pressure (bar) 6.7 7.9 8.3 8.7 ΔT pp (℃) 2.6 5.1 5.7 6.2 SSS mass flow rate (kg/s) 0.17 0.17 0.17 0.17 ST mass flow rate (kg/s) 1.5 1.76 1.93 1.9 ST power (kW) 1 384 1 702 1 801 1 807 ηE (%) 46.3 47.3 47.3 47.5 ηCP (%) 50.0 50.2 50.1 50.0 HRSGeff (%) 68.3 58.0 57.1 53.2 HRSG stack temp. (℃) 148 164 169 174 Table 8 Simulation results condition for the DF engine with HTC (HFO)
Engine & HTC parameters Engine load (MCR%) 50 75 85 100 Engine power (kW) 8 775 13 162 14 917 17 550 Engine speed (r/m) 462 488 500 500 HTC electric power (kW) 143 428 690 769 EM/G electric power of Engine power (%) 1.63 3.25 4.15 4.38 Table 9 Simulation results condition for the DF engine with HTC (NG)
Engine & HTC parameters Engine load (MCR%) 50 75 85 100 Engine power (kW) 8 775 13 162 14 917 17 550 Engine speed (r/m) 462 488 500 500 HTC electric power (kW) 842 834 801 728 EM/G electric power of Engine power (%) 9.60 6.34 5.37 4.15 Nomenclature AC air cooler AF compressor inlet air filter AFC Annual Fuel Cost AMC Annual Maintenance Cost Ae pipe wall external area (m2) Ai pipe wall internal area (m2) Aml pipe wall logarithm area (m2) BV bleed valve C turbocharger compressor CAPEX Capital Expenditure CII Carbon Intensity Indicator CP evaporator circulating pump DF Dual-Fuel engine E Economizer ECA Emission Control Area EEXI Energy Efficiency Existing Ship Index EG Electric generator EM/G Electric Motor/Generator ENG Engine EV Evaporator FP Feed Pump GD Gas Deviator GHG Green House Gases HFO Heavy Fuel Oil HP High Pressure HRSG Heat Recovery Steam Generator HTC Hybrid Turbocharger HWT Heat Water Tank h specific enthalpy (kJ/kg) he external pipe convective heat transfer coefficient (kW/(m2 K)) hi internal pipe convective heat transfer coefficient (kW/(m2 K)) k wall thermal conductivity (kW/(m K)) IC Investment cost ILV Isenthalpic Lamination Valve IMO International Maritime Organization JW Jacket Water LP Low Pressure MCR Maximum Continuous Rating MFP Main Feed Pump M mass flow rate (kg/s) N shaft speed (r/min) n Number of years NCR Normal Continuous Rating NG Natural Gas OPEX Operational Expenditure P Power (kW) Q’ shaft torque (Nm) p pressure (Pa) P Power (W) R Discount rate Re external pipe thermal resistance (K/kW) Ri internal pipe thermal resistance (K/kW) SC SCavenger SCO Steam COndenser SCP Steam Condensing Pump SD HRSG evaporator Steam Drum SH SuperHeater SSC Steam Service Condensing outlet SSS Ship Steam Service ST Steam Turbine s pipe wall thickness (m) T temperature (K), turbocharger turbine TC TurboCharger V Valve VL Variable Layout VTNA Variable Turbine Nozzle Area WHR Waste Heat Recovery 0s heat water tank outlet 0s COND steam condensing pump outlet 0sc main feed pump outlet 00sc scavenger water outlet 1g turbocharger turbine outlet 1s economizer water outlet 2g evaporator gas inlet 2s evaporator water inlet 2’s evaporator steam outlet 3g economizer gas inlet 3s superheater steam outlet, steam turbine inlet 3sd HRSG stean drum steam outlet 4g HRSG gas outlet 4s vacuum condenser inlet 5s steam condensing pump 6s jacket water outlet Subscripts a Air amb Ambient cs Control Signal e External el Electric E Engine EM/G Electric Motor/Generator f Fuel g Gas HP High Pressure i Inlet, Internal LP Low Pressure MF Fuel Mass o Outlet s Steam, Signal pp Pinch Point T Turbine TC Turbocharger w Wall -
Akiliu BT, Gilani SI (2010) Mathematical modeling and simulation of a cogeneration plant. Applied Thermal Engineering, 30(16): 2545-2554. https://doi.org/10.1016/j.applthermaleng.2010.07.005 Altosole M, Laviola M, Trucco A, Sabattini A (2014) Waste heat recovery systems from marine diesel engines: comparison between new design and retrofitting solutions. In Proceedings of the 2th International Conference on Maritime Technology and Engineering (MARTECH 2014), Lisbon, Portugal, 15-17. https://doi.org/10.3390/en10050718 Altosole M, Benvenuto G, Campora U, Laviola M, Zaccone R (2017) Simulation and performance comparison between diesel and natural gas engines for marine applications. Proceedings of the Institution of Mechanical Engineers, Part M: Journal of Engineering for the Maritime Environment, 231(2): 690-704. https://doi.org/10.1177/1475090217690964 Altosole M, Campora U, Laviola M, Zaccone (2018a) Waste heat recovery from dual-fuel marine engine. In Maritime Transportation and Harvesting of Sea Resources, Vol. 1. Guedes Soares C, Teixeira AP Eds. Taylor & Francis Group, London, 79-86. https://doi.org/10.3233/978-1-61499-870-9-21. Altosole M, Campora U, Laviola M, Zaccone R (2018b) High efficiency waste heat recovery from dual fuel marine engines. Technology and Science for the Ships of the Future. A. Marinò, V. Bucci, Eds. Proc. NAV, 21-28. Doi: 10.3233/978-1-61499-870-9-21. Altosole M, Benvenuto G, Campora U, Silvestro F, Terlizzi G (2018c) Efficiency improvement of a natural gas marine engine using a hybrid turbocharger. Energies, 11(8): 1924. https://doi.org/10.3390/en11081924 Altosole M, Campora U, Donnarumma S, Zaccone R (2019) Simulation techniques for design and control of a waste heat recovery system in marine natural gas propulsion applications. Journal of Marine Science and Engineering, 7(11): 397. https://doi.org/10.3390/jmse7110397 Altosole M, Campora U, Vigna V (2020a) Energy efficiency analysis of a flexible marine hybrid propulsion system. In 2020 International Symposium on Power Electronics, Electrical Drives, Automation and Motion (SPEEDAM): 436-441. https://doi.org/10.1109/SPEEDAM48782.2020.9161873 Altosole M, Benvenuto G, Zaccone R, Campora U (2020b) Comparison of saturated and superheated steam plants for waste-heat recovery of dual-fuel marine engines. Energies, 13(4): 985. https://doi.org/10.3390/en13040985 Altosole M, Balsamo F, Campora U, Mocerino L (2021) Marine dual-fuel engines power smart management by hybrid turbocharging systems. Journal of Marine Science and Engineering, 9(6): 663. https://doi.org/10.3390/jmse9060663 Altosole M, Campora U, Mocerino L, Zaccone R (2022) An Innovative variable layout steam plant for waste heat recovery from marine dual-fuel engines. Ships and Offshore Structures. https://doi.org/10.1080/17445302.2022.2061769 Barreiro J, Zaragoza S, Diaz-Casas V (2022) Review of ship energy efficiency. Ocean Engineering, 257, 111594. https://doi.org/10.1016/j.oceaneng.2022.111594 Benvenuto G, Campora U, Laviola M, Terlizzi G (2017) Simulation model of a dual-fuel four stroke engine for low emission ship propulsion applications. International Review of Mechanical Engineering, 11(11): 817-824. https://doi.org/10.15866/ireme.v11i11.11929 Benvenuto G, Campora U, Laviola M, Zaccone R (2015) Comparison of Waste Heat Recovery Systems for the Refitting of a Cruise Ferry. Proceedings of the NAV. Benvenuto G, Trucco A, Campora U (2014) Optimization of waste heat recovery from the exhaust gas of marine diesel engines. Proceedings of the Institution of Mechanical Engineers, Part M: Journal of Engineering for the Maritime Environment, 230(1): 83-94. https://doi.org/10.1177/1475090214533320 Choi CB, Kim YM (2013) Thermodynamic analysis of a dual loop heat recovery system with trilateral cycle applied to exhaust gases of internal combustion engine for propulsion of the 6800 TEU container ship. Energy, 58: 404-416. https://doi.org/10.1016/j.energy.2013.05.017 Cohen H, Rogers GFC, Saravanamuttoo HIH (1987) Gas Turbine Theory (Third Edition), Longman Scientific & Technical, Harlow, Essex, England Dimopoulos GG, Kakalis NMP (2010) An integrated modelling framework for the design, operation and control of marine energy systems. 26th CIMAC World Congress, Bergen, Norway Dotto A, Campora U, Satta F (2021) Feasibility study of an integrated COGES-DF engine power plant in LNG propulsion for a cruise-ferry. Energy Conversion and Management, 245: 114602. https://doi.org/10.1016/j.enconman.2021.114602 Dzida M (2009) On the possible increasing of efficiency of ship power plant with the system combined of marine diesel engine, gas turbine, and steam turbine, at the main engine-steam turbine mode of cooperation. Polish Maritime Research, 47-52. https://doi.org/10.2478/v10012-008-0010-z Grimmelius H, Boonen EJ, Nicolai H, Stapersma D (2010) The integration of mean value first principle diesel engine models in dynamic waste heat and cooling load analysis. Proceedings of the CIMAC Congress. Bergen, Norway, 14-17. DNV (2022) http.//www.dnvgl.com/maritime/lng/current-price-development-oil-and–gas.html, IMO (2003) Assembly 23, Resolution A. 963(23). IMO Policies and Practices Related to the Reduction of Greenhouse Gas Emissions from Ships, December 5. IMO (2008) International Maritime Organization, Report of the Marine Environment Protection Committee (MEPC) on its Fifty-Seventh Session, 57th session, April 7 IMO (2020) International Maritime Organization, MARPOL Annex Ⅵ – Prevention of Air Pollution from Ships, National Workshop (virtual) on Ratification and Effective Implementation of MARPOL Annex Ⅵ, November 26 Ioannidis J (1984) Thermo Efficiency System (TES) for Reduction of Fuel Consumption and CO2 Emission. Aalborg AG: Copenhagen, Denmark Ito K, Akagi S (1986) An optimal planning method for a marine heat and power generation plant by considering its operational problem. International Journal of Energy Research, 10(1): 75-85. https://doi.org/10.1002/er.4440100109 Jeong B, Oguz E, Wang H, Zhou P (2018). Multi-criteria decision-making for marine propulsion: Hybrid, diesel electric and diesel mechanical systems from cost-environment-risk perspectives. Applied energy, 230, 1065-1081. https://doi.org/10.1016/j.apenergy.2018.09.074 Livanos GA, Theotokatos G, Pagonis DN (2014) Techno-economic investigation of alternative propulsion plants for Ferries and RoRo ships. Energy Conversion and Management, 79: 640-651. https://doi.org/10.1016/j.enconman.2013.12.050 MAN 51/60DF Project Guide (2015) Marine, Four-stroke dual-fuel engine compliant with IMO Tier Ⅱ / IMO Tier Ⅲ MAN B & W Diesel (2005) Thermo Efficiency System (TES) for Reduction of Fuel Consumption and CO2 Emission. Publ. No. : P3339161. Copenhagen, Denmark. MAN Diesel & Turbo (2010) Thermo Efficiency System. Report 5510-0030-02, Copenhagen, Denmark MIDAS (2022) www.coinmarketcap.com/it/currencies/midas-dollar. Ono Y, Shiraishi K, Yamashita Y (2012) Application of a large hybrid turbocharger for marine electric-power generation. Mitsubishi Heavy Industries Technical Review, 49(1) Rusman JD (2018) Charge air configurations for propulsion diesel engines aboard fast naval combatants. In Proceedings of the 14th International Naval Engineering Conference & Exhibition (INEC), Glasgow, UK, 2-4 Sharples J (2019) LNG supply chains and the development of LNG as a shipping fuel in Northern Europe. The Oxford Institute for Energy Study. https://doi.org/10.26889/9781784671266 Shiraishi K, Ono Y (2007) Hybrid Turbocharger with integrated High Speed Motor-generator. Technical Review: Mitsubishi Heavy Industries, Ltd, 44(1): 1-3 Shiraishi K, Ono Y, Sugishita K (2010) Development of large marine hybrid turbocharger for generating electric power with exhaust gas from the main engine. Mitsubishi Heavy Industries Technical Review, 47(3): 53-58 Shiraishi K, Ono Y, Yamashita Y, Sakamoto M (2015) Energy savings through electric-assist turbocharger for marine diesel engines. Mitsubishi Heavy Ind. Tech. Rev, 52(1): 36-41 Su Z, Ouyang T, Chen J, Xu P, Tan J, Chen N, Huang H (2020) Green and efficient configuration of integrated waste heat and cold energy recovery for marine natural gas/diesel dual-fuel engine. Energy Conversion and Management, 209, 112650. https://doi.org/10.1016/j.enconman.2020.112650 Theotokatos G, Rentizelas A, Guan C, Ancic I (2020) Waste heat recovery steam systems techno-economic and environmental investigation for ocean-going vessels considering actual operating profiles. Journal of cleaner production, 267, 121837. https://doi.org/10.1016/j.jclepro.2020.121837 Tien WK, Yeh RH, Hong JM (2007) Theoretical analysis of cogeneration system for ships. Energy Conversion and Management, 48(7): 1965-1974. https://doi.org/10.1016/j.enconman.2007.01.032 Völker T (2015) Hybrid propulsion concepts on ships Harbor Tug Description of harbor tug Load profiles for harbor Tug. Scientific Journal of Gdynia Maritime University, 11-16
