
Computational Analysis of the Effect of Hull Vane on Hydrodynamic Performance of a Medium-speed Vessel
https://doi.org/10.1007/s11804-023-00378-y
-
Abstract
The importance of reducing ship resistance is growing considerably as a result of the increase in atmospheric emissions and the drive towards green shipping through decarbonization. Until this point, Energy Saving Devices (ESD), in particular, Hull Vane® (HV), have been widely applied as a potential technique for reducing wave-making resistance for vessels with higher Froude Number (Fr). The advantages of HV for a medium-speed vessel, where the wave-making component accounts for almost 50% of total resistance, have yet to be investigated. This study presents the computational analysis of the KCS model (1: 75.5); for a particular trim condition by using the VOF method and RANS solver. The hull acts as a candidate vessel for the class of medium-speed characteristics. A total of 36 numerical simulations were carried out to study the changes in resistance and motion characteristics of the vessel with and without HV. To validate the numerical setup, the experimental work ofHou et al (2020) on the DTMB hull was used. The effectiveness of HV can be comprehended by the reduction percentage in total resistance, trim, sinkage, and transom wave height, in comparison to bare hull condition. The reduction in total resistance extends up to 6% for Fr = 0.32 with configuration 2 with negative AoF. The CFD results indicate that there is a reduction in trim up to 57% for the maximum speed with a corresponding Fr = 0.34 with a positive angle of foil (AoF). The trim correction effect is increasing with the depth of submergence of HV. Concerning sinkage, there occurs nearly a 31% reduction for Fr = 0.34 with a positive AoF. There exists a substantial reduction in the height of the transom wave with the inclusion of HV, the results of which are discussed in detail. From the presented results, retrofitting the Hull Vane® is effective in the selected speed range but pronouncing as the speed of the vessel increases.Article Highlights• Medium speed vessels are the kind of vessels whose individual components of resistance are equivalent in percentage to their total resistance.• On a medium speed displacement vessel, an energy-saving device-Hull Vane was used to reduce resistance.• The effect of Hull Vane on a medium speed displacement vessel towards hydrodynamic performance was studied numerically using StarCCM+. -
1 Introduction
In the modern era, shipping has been a significant mode of transportation for both domestic and international trade with the goal of bulk handling goods across countries. However, harmful pollutants such as greenhouse gases (GHG) have been released into the environment due to rising emissions from the maritime industry. International Maritime Organization (IMO) mandates specific guidelines on all ships to assimilate energy-efficient technologies to lower fuel consumption and CO2 emissions from vessels. Research has focused on finding energysaving strategies to mitigate the resistance acting on ships, reducing ship-borne emissions. The major component of resistance are the frictional and wave-making resistance. The frictional resistance are predominant in lowspeed vessel contributes about 70% (Sindagi et al., 2020. Some of the Potential ways to reduce frictional drag are Coating drag reduction, superhydrophobic drag reduction, polymer additives drag reduction and Microbubble drag reduction (MBDR). Considering the environment friendly nature, MBDR has been evolving as the preferred technique for reducing frictional resistance (Sindagi et al., 2018; 2020 & 2021). Energy Saving Devices (ESDs) are increasingly used to lower wave-making resistance. ESD was chosen over other alternatives, such as hull shape optimization; it took less work and was more cost-effective; it was used as a retrofit attachment that didn't require any changes to the hull's current design. Regardless of the bow or stern, every ESD is made to lessen the inherent en‐ergy that ship-generated waves possess. The wave-making component has been successfully reduced through extensive research employing energy-saving tools such as bulbous bows, stern wedges with initial studies of Karafith G et al (2019), interceptors, stern flaps (Hemanth et al., 2019; 2020a and 2020b), and Hull Vane s® (Hull Vane® -hereafter, denoted as HV). Uithof et al. (2016) conducted a systematic numerical comparative study on a 50 m patrol vessel by comparing three ESDs, including HV, interceptors, and trim wedges. They measured the change in trim and its direct impact on hull resistance. According to the author, using interceptors and stern wedges to reduce resistance by 7 and 12%, respectively, for Froude Numbers (Fr) above 0.8. For Fr between 0.2 and 0.7, the HV's location near the transom is more effective than other ESDs. This thorough study provides the operating limit of the HV and its application to ships. The critical parameters are to be analyzed for the adequate performance of HV towards selected applications. In the past, several studies have been carried out on predicting these vital parameters.
A numerical analysis was performed by Suastika et al. (2017) on a planning hull crew boat to determine the crucial Froude number for the effective operation of the stern foil with its leading edge positioned right below the transom. Retrofitting the HV has the unfavourable consequence of raising the ship's overall resistance, especially at comparatively slower speeds. Celik et al. (2019) conducted a computational study of the HV of the NACA 4412 profile with chord length variation on a yacht hull model for a speed of 2.15 m/s with corresponding Fr = 0.37. The author concludes the study with chord length as one of the influencing parameters toward the reduction of total resistance. Firdhaus et al. (2019) carried out conducted an experimental and computational analysis of the effect of the longitudinal position of the HV towards resistance reduction. The study includes three different longitudinal positions concerning the chord length of foil; the configuration with the farthest position is more effective in resistance reduction with a maximum of 13% than the other two locations. Further, the author concludes that, at higher speeds, the HV is causing adverse effects, increasing resistance.
Budiyanto et al. (2020) performed Experimental and Numerical studies on the effect of stern foil on patrol crew boats for the Fr range between 0.35‒0.75. The study consists of variations in HV configuration and AoF and hull load conditions. The author concludes that the resistance reduction significantly depends on load condition, AoF, and vessel speed since the higher speed rate has enhanced resistance reduction. HV has been investigated as a retrofit or new build concept based on the abovementioned investigations. The design and optimization of HV, experimental examination of use on big boats, performance in waves, and associated motion responses, etc., have not yet been thoroughly explored in a study that is publicly accessible. Murdianto et al. (2020) computationally studied the effect of stern foil on a high-speed patrol vessel for the Fr range of 0.6‒1.3. Being a stern foil, the trailing edge of the aerofoil is placed right under the transom. The test conditions include the Angle of Foil (AoF) variation of stern foil with 0 and 3 degrees. The results show that for Fr up to 0.8, the stern foil affects the ship resistance positively with a maximum reduction rate of 16% & and 13% = 0.7 with AoF of 3 and 0 degrees, respectively. For Fr = 0.9‒1.3, the stern foil causes adverse effects of adding to ship resistance up to 24% for Fr = 1.3. The authors used NACA 4412 after being inspired by literature and higher lift generation for load conditions as similar to Soma & Vijayakumar (2023a & 2023b).
Dwiputera et al. (2020) conducted a numerical study on a ship model with stern foil with varying AoF from 0‒5 degrees. The study concluded a drag ruction of 9-26% for the selected speed range from 1.57‒2.3 m/s with Fr = 0.5‒0.75, respectively, for selected AoF. The results show that, as AoF increases at increased speed, the effectiveness of stern foil on ship resistance reduces when compared to lower speeds with the same AoF. Chrismanto et al. (2020) performed a computational analysis on a 30GT fishing vessel fitted with HV. A NACA 2408 profile was used for the HV model. The study includes variations in HV and AoF HV submergence depth and AoF for analyzing the effect on ship total resistance. The results show that the HV is more effective at higher speeds. Also, as the submergence depth decreases with increased AoF (Fr is the same), the resistance reduction decreases for lower speeds. The key inference is that the negative AoF also results in net resistance reduction, reduces net resistance at higher speeds and all submergence depths.
The application of stern foil and HV had been carried out interchangeably to reduce the ship's resistance. However, there are no proper guidelines for selecting appropriate ESD for marine applications. To shed some light on these issues, Nawabi et al. (2021) conducted a numerical study on a semi-trimaran vessel with stern foil and HV for various speeds, including Fr 0.4‒1.1. The author made a well-distinguished difference between stern foil and HV. The author used NACA 4012 type foil profile for both HV and stern foil 3D models. The results show that the resistance reduction rate is higher up to 13% with HV installation than with stern foil with 5%. Also, the author commented that HV reduces the waves generated by the ships, making HV superior to stern foil. This work helps to make the selection of HV a suitable ESD for marine applications.
Hou et al. (2020) carried out an experimental and numerical study on the effect of HV on resistance characteristics and motion response of a DTMB 5415 destroyer ship using a model scale and full-scale experimental research in both calm waters and with wave conditions and also proposed two different approaches for full-scale extrapolation. The findings indicate that, as opposed to the vessel's position, the angle of foil has the greatest, most significant impact on reducing sinkage. While in sea states, the vessel's speed, wave height, and longitudinal location of the HV will all have a major effect on sinkage and a 20‒30% reduction in motion responsiveness. Since both hypotheses will similarly impact resistance and motion characteristics, the HV can be considered an integral component of the hull or a retrofit attachment. Kiryanto et al. (2021) numerically analyzed the effect of HV on ship resistance using a research vessel. The study comprises of NACA 2415 profile as an HV model. The numerical simulations were performed for different positions of HV and single and double foil concepts. The results show that, out of six variations, including depth and number of foils, the single foil configuration with 50% elevated HV towards the waterline than the original configuration causes a 20% reduction rate to bare hull condition.
This research has been started within this framework to investigate the impact of ESD on a medium-speed displacement vessel towards resistance reduction, enhancing the trim and sinkage in calm water. The study is planned as a series of works based on mutual drag reduction. The HV is selected as the target ESD, and the KRISO Container Ship is chosen for our analysis with an operational range of Fr 0.28‒0.34. As a first part, this study presents the numerical work on a medium-speed KCS hull retrofitted with an HV at the transom to predict the influence of HV on ship hydrodynamic performance. The study also includes analyzing and presenting the numerical results for the effects of HV on total resistance reduction, sinkage, trim reduction of the vessel, and the influence of HV on the Transom stern wave system. The remaining portions of this paper are structured as follows:
The geometrical models of the ship, HV, and proposed configurations are shown in Section 2; the numerical approach is presented in Section 3; the results on the effects of HV on the ship's hydrodynamics and discussions; the findings of this study and some suggestions for future work are presented in Section 4. The conclusions drawn from the present study are given in Section 5.
2 Geometrical model
2.1 Hull and hull vane
The well-researched benchmark KRISO Container Ship (KCS) hull model with a scale ratio of 1∶75.5 is used for our numerical analysis to explore HV's effect on mediumspeed displacement vessels. Figure 1 depicts the KCS model chosen for our study. Figure 2 shows the chosen HV model with Rhode St Gense NACA profile for the present study. Figure 2(a) shows the side view along the chord length direction. Figure 2(b) shows the perspective 3D view of the HV model. The subjected model and its speed range selections are made according to the criteria of a vessel having an equivalent percentage of the ship's major resistance components, namely frictional and wave-making resistance. The main particulars of the KCS hull are shown in Table 1. An unsymmetrical aerofoil Rhodes St Gense profile was selected for the HV configuration. The aerofoil fact of generation of lift force at zero angle of foil chose this profile with similar characteristics to NACA 4412. The geometrical particulars of HV in the model scale are shown in Table 2.
 Figure 1 KRISO Container Ship Model
 Figure 2 Rhodes St. Gense profile HV ModelTable 1 Ship main particulars
Parameters Symbol Full scale Model scale Scale λ 1 75.5 Length between perpendiculars Lpp (m) 230.0 3.046 Length at waterline Lwl (m) 232.5 3.079 Beam Bwl (m) 32.2 0.426 Draught T (m) 10.8 0.143 Mass displacement ∇ (m3) 52 030.0 0.121 Depth d (m) 19.0 0.251 7 Block coefficient 0.651 0.651 Wetted surface area w/o rudder S (m2) 9 539.0 1.692 Table 2 DimensionsParameters Symbol Dimensions Span s (m) 0.426 Chord length c (m) 0.091 4 Angle of foil θ (degree) 0 2.2 Test matrix
Numerical simulations were performed with the KCS model or bare hull and with HV condition for the running speeds with corresponding Fr=0.28 to 0.34. For all the cases mentioned in Table 3, the resistance, trim, sinkage, and wave height were measured numerically under calm water conditions. During the test, the angle of Foil (AoF), a critical parameter of HV, was modified to study the effect on ship hydrodynamic performance. Thirty-six cases were simulated, summarised, and displayed in Table 3. Figure 3 demonstrates the proposed HV configuration. Figure 3(a) indicates all three configurations, in which C1, C2, and C3 refer to configuration 1, configuration 2, and configuration three, respectively (hereafter, will be used throughout the paper). C1 refers to the condition in which the HV is attached below the transom at a vertical distance equal to 10% of the Draught (T) of the vessel. C2 refers to a configuration with a vertical distance equal to 15% of the T of the vessel. C3 refers to the configuration with a vertical distance equal to 20% of the T of the vessel. It is important to note that the tests were conducted for a vessel with initial trim, and also, for all the configuration, the span and chord length is maintained to be constant with the dimension of 0.426 m (equal to the vessel's beam) and 0.091 4 m (3% of Lwl) respectively. All the simulations are carried out without struts, which are well adopted in the previous kinds of literature.
Table 3 Test matrixParameters Configuration Configuration Configuration 1 (C1) 2 (C2) 3 (C3) Span (m) 0.426 0.426 0.426 Chord length (m) 0.091 4 0.091 4 0.091 4 The angle of foil (°) −5, 0, 5 −5, 0, 5 −5, 0, 5 Longitudinal position from AP (m) 0.8 0.8 0.8 Vertical position from waterline (m) 0.014 3 0.021 45 0.028 6 Froude number 0.28‒0.34  Figure 3 Proposed HV configuration
3 Numerical approach
3.1 Governing equations
The fundamental equations that govern incompressible turbulent flows are continuity (conservation of mass) and conservation of momentum.
$$ \frac{\partial\left(\rho \overline{u_i}\right)}{\partial t}=0 $$ (1) The averaged momentum equation for incompressible flows is given by:
$$ \frac{\partial\left(\rho \overline{u_i}\right)}{\partial t}+\frac{\partial}{\partial t}\left(\rho \overline{u_i u_j}+\rho \overline{u_i^{\prime} u_j^{\prime}}\right)=-\frac{\partial \bar{p}}{\partial x_I}+\frac{\partial \overline{\tau_{i j}}}{\partial x_j} $$ (2) where ρ is the flow medium density, ui is the average velocity vector, $\rho \overline{u_i^{\prime} u_j^{\prime}}$ is the Reynolds stress component, p is the average pressure, $\overline{\tau_{i j}}$is the average viscous stress component.
For a Newtonian fluid, the viscous stress can be defined as:
$$ \overline{\tau_{i j}}=\mu\left(\frac{\partial \bar{u}_i}{\partial x_j}\right)+\left(\frac{\partial \overline{u_j}}{\partial x_i}\right) $$ (3) where μ refers to the dynamic viscosity.
3.2 Computational setup
Figure 4 depicts the computational domain per International Towing Tank Conference (ITTC 2021) guidelines and the imposed boundary conditions on the domain. The inlet was placed at 1 Lpp from the bow and set with velocity inlet condition, whereas the outlet was at 3 Lpp from the stern and was applied with pressure outlet boundary condition. The top, bottom, and side boundaries are about a distance of 1 Lpp, 1.5 Lpp, and 2 Lpp from the hull and are prescribed with velocity inlet conditions. Due to the symmetry of hull geometry, the one (port) side is simulated, and the ship's centre plane was prescribed with symmetry plane boundary condition. This step's primary aim and advantage are minimized computational time and cost. In addition to that, Figure 5 shows the sectional views of the generated volume mesh.
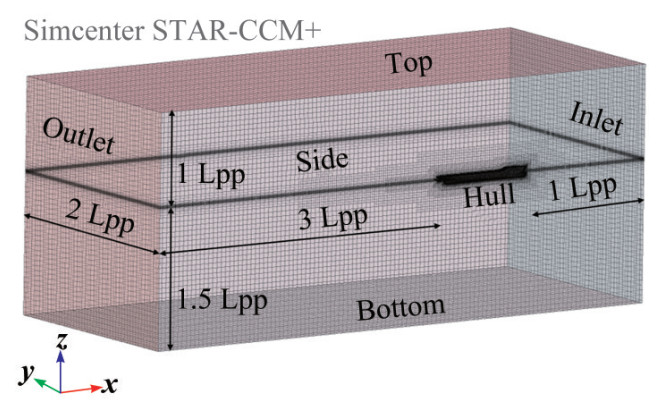 Figure 4 Computational domain
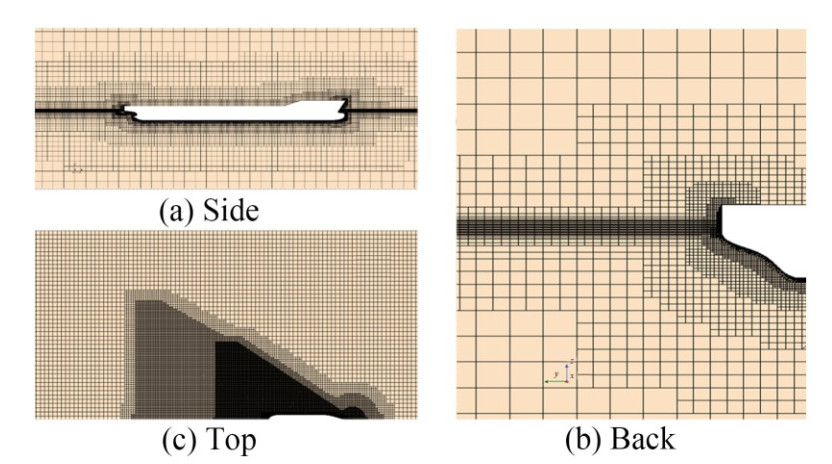 Figure 5 Different views of generated volume mesh
3.3 Mesh generation and computational physical setup
The 3D volume mesh of the computational domain and the hull were generated using the parts-based meshing procedure in the commercial CFD tool StarCCM+. The tetrahedral meshing tool is used to discretize the computational domain with the hull, and the tool solves the problem domain using Finite Volume Method (FVM). Prism layer Mesher with Two layers all y+ wall treatment approach is used to generate prismatic cells for capturing the boundary layer and its effects along the hull. The predictor-corrector technique is used by the RANS solver to couple the conservation equations. To capture the Kelvin wave pattern volume controls with a very fine mesh size. The model ship's hull surface first layer cell thickness was selected so that the y+ values were higher than 30. The Realizable k-Epsilon turbulence model (RKE) uses a two-layer all y+ treatment approach to appropriately predict the turbulent eddy viscosity of highly separated flows and the turbulence properties across the wall boundary layer as well supported by Vipin CV et al (2022).
The Volume of Fluid (VOF) multiphase model simu‐lates multiphase flows and solves the flows between two immiscible fluids. A High-Resolution Interface Capturing scheme (HRIC) captures and tracks the existing sharp interface. A flat wave advancing in a negative x direction with a magnitude of respective flow velocity against the hull is generated using the VOF waves model to simulate the calm water condition. Dynamic Fluid Body Motion (DFBI) model simulates the ship's motion. The ship hull can only move in the x-z plane, i. e., heave (translation along the z-axis) and trim (rotation about the y-axis). The hull is rigidly fixed for the first few seconds to initialize the flow and solve the procedure gradually. A considerable ramp time is provided to apply the hydrodynamics forces. The VOF wave damping condition is applied at appropriate boundaries to avoid wave reflections.
The discretization of connective terms significantly impacts the spatial accuracy of the simulation domain. A second-order upwind scheme discretizes the convection terms in the Navier-Stokes equations to avoid the unphysical oscillations in the solution, like the free surface distortions. Navier-Stokes equations are solved uncoupled; a segregated flow model was used. Semi-Implicit Method for Pressure Linked Equations (SIMPLE) algorithm to solve these uncoupled Navier-Stokes Equations.
3.4 Choice of time step
In numerical simulations, Convective Courant-Friedrichs-Lewy (CFL) is important to finalize the discretized time step and, eventually, the resultant convergence of solutions. The CFL number is given by:
$$ \mathrm{CFL}=\frac{u \Delta t}{\Delta x}<1 $$ where u is the flow velocity in m/s. ∆t is the discretized time step in seconds, and ∆x is the length of the discretized cell in meters. To account for the sufficient amount of time it takes a fluid particle to pass through from one cell to the next to be equal to or more than the selected value of ∆t; this must be determined suitably. Therefore, CFL must be equal to or less than 1 to guarantee that all flow parameters are recorded within the created grid of cells. The implicit unsteady option is used to control the time step in Star-CCM+. However, ITTC recommended an alternative approach for calculating the time step ∆t. It is given by:
$$ \Delta t=0.005 \sim 0.01 L / V $$ where L is the length of the model in meters and V is the model velocity in m/s. This study selected the time step as per the above equation. Finally, with the aim of stability and good convergence, the first-order discretization method is used for the time-dependent term in the governing Navier-Stokes equation (Terziev et al., 2018). Figure 6 shows the wall Y+ distribution along the hull and HV surface with the generated mesh.
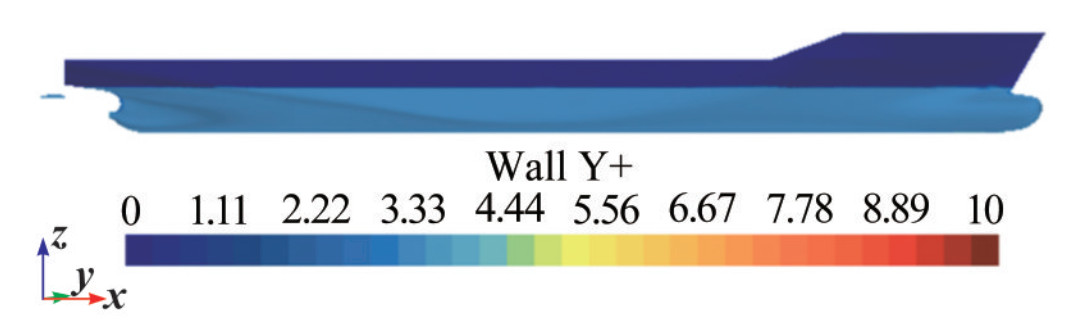 Figure 6 Wall Y+ distribution along the hull and HV
4 Results and discussions
4.1 Grid convergence study
Richardson (1911) suggested that the Grid Convergence study is necessary to predict the uncertainty in the mesh, and the results predicted by the CFD do not influence it. Roache (2008) has given a detailed procedure for estimating the uncertainty due to discretization in CFD applications. The resistance is taken as a reference parameter to conduct a convergence study.
Three distinctly generated meshes, namely fine (N1), medium (N2), and coarse (N3), were used, where N1, N2, and N3 are the number of cells in millions. Table 4 shows the necessary terms and parameters for a spatial or grid convergence study. The numerical simulations were performed on the KCS hull with bare hull condition, with the Fr 0.26. According to the study, using different cell sizes in the grids has little to no impact on the solution. Getting a solution for the finer grid would be too expensive computationally. Any CFD study that wants to save time on computations needs to conduct this uncertainty analysis. Thus, medium meshing was selected to undertake further computational research. The GCIfine21 for resistance is 2.12% for and 1.37% for GCImedium32, demonstrating that the medium grid is suitable and, hence, picked for subsequent studies.
Table 4 Grid convergence studyParameters (°) Fine Mid Coarse No. of cells (106) N1, N1, N1 4 2 1.5 Grid size h1, h2, h3 0.071 0 0.100 0 0.141 4 Grid refinement factor r21, r32 1.408 5 1.414 0 Output values ϕ1, ϕ2, ϕ3 7.840 0 7.960 0 8.04 ε21, ε32 0.120 0 0.080 0 Apparent order P 1.880 0 Extrapolated values ϕ_ext_21, ϕ_ext_32 7.707 2 7.872 9 Approximate relative error ea21, ea32 0.015 3 0.010 1 Extrapolated relative error eext21, eext32 0.017 2 0.011 1 Grid convergence index GCIfine21, GCImedium32 0.021 167 2 0.013 685 4.2 Validation
The numerical setup was validated with the experimental work of Hou et al. (2020). Figure 7 compares the total resistance (reference parameter) between the present numerical study and the experimental data. The four curves correspond to the bare hull condition (without HV) and HV condition. The maximum deviation of the absolute resistance value is 2.3% for the bare hull condition, where a 6% deviation in total resistance is observed for the HV condition. The substantial agreement between experimental and numerical value in total resistance helps to select the proposed numerical setup for further simulations.
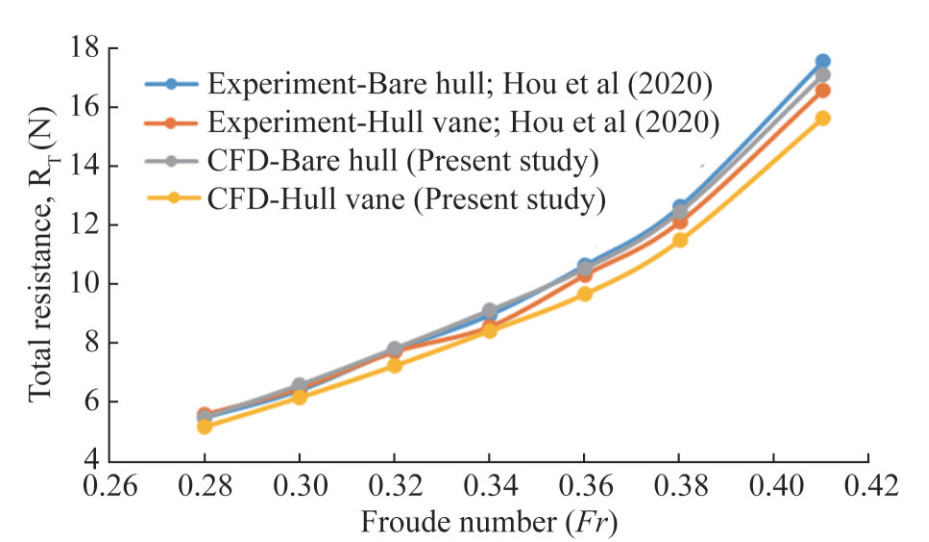 Figure 7 Total resistance for the range of Froude numbers
4.3 Effects of HV on resistance
Figure 7 shows the graph between the percentage reduction in total resistance for the different HV configurations with three different AoF and the Froude number. The effect of HV on total resistance is measured using the reduction percentage in total resistance with the formula mentioned below.
$$ \text{Reduction Percentage in Total Resistance} (\%) $$ =\left(\frac{R_{\mathrm{T}, \mathrm{HV}}-R_{\mathrm{T}, \text { Bare Hull }}}{R_{\mathrm{T}, \text { Bare Hull }}}\right) \times 100 $$ $$ From Figure 8, it can be inferred that, at Fr=0.28, there exists no reduction in total resistance for all the three configurations (C1, C2, and C3) with 0° AoF; i.e., there is a slight increase in total resistance than bare hull condition. This increase in total resistance is pronounced for all the configurations with +5° AoF with a maximum of 8.2% for C2, whereas at −5° AoF, there exists a reduction in total resistance up to 2.6% for C1with −5° AoF.
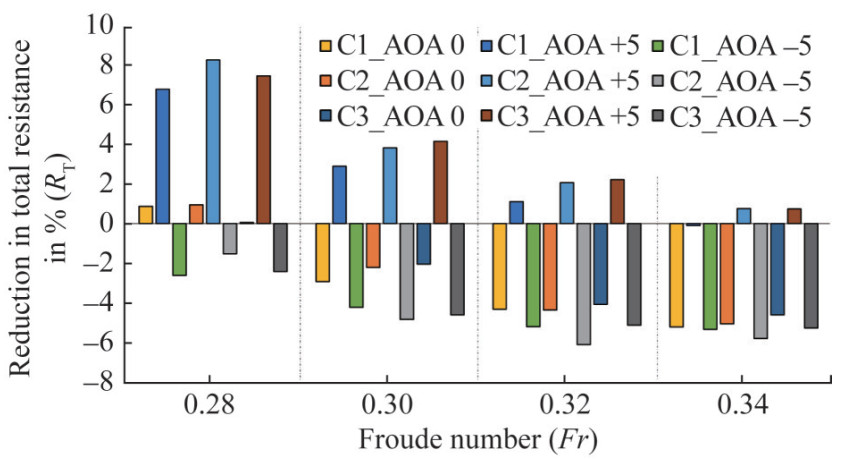 Figure 8 Percentage reduction in total resistance for different positions of HV vs. Froude number
As the speed increases with corresponding Fr=0.30, the resistance penalty (increase in total resistance) with 5° AoF is reduced for C1, C2, and C3. On the other hand, a resistance reduction occurs at 0° AoF for all C1, C2, and C3. An increased reduction rate occurs with a maximum value of −4.8% for C2 with −5° AoF. With a further increase in speed with corresponding Fr = 0.32, the resistance penalty with 5° AoF is further reduced for C1, C2, and C3. At the same time, the resistance reduction at 0° AoF is increasing for all C1, C2, and C3. An increased reduction rate of around −6.1% for C2 with −5° AoF occurs. At Fr = 0.34, an increased reduction rate occurs for C2 with −5° AoF with a maximum value of −5.8%. The reason behind this resistance reduction and increase is given in the following graph.
Figure 9 depicts the pressure drag on HV for different configurations with varying AoF. It compares the pressure drag component between 0°, +5°, and −5° AoF. The graph shows that with 0° AoF, the pressure drag of HV decreases with an increase in submergence depth. It is found to be true for all speeds. But, with − 5° AoF, the pressure drag component acting on HV is reduced compared with 0° AoF for all the configurations. With +5° AoF, there is a minimization in the HV stagnation area, promoting smooth flow entry over the HV surface. But, with +ve AoF, as the flow meets the HV with increased frontal area, pressure drag occurs when compared to 0° AoF. This is the reason for a corresponding increase in total resistance at Fr=0.28. With the increase in speed with Fr=0.30, 0.32, 0.34, there occurs a monotonic increase in the pressure drag component of HV, which is rapidly increased with +5° AoF. In all the above cases (with +5° AoF), the pressure drag of HV adds up to the hull's pressure resistance, resulting in increased total resistance. However, there is a decrease in HV's pressure drag (with −5° AoF), which eventually reduces total resistance at all the selected speeds.
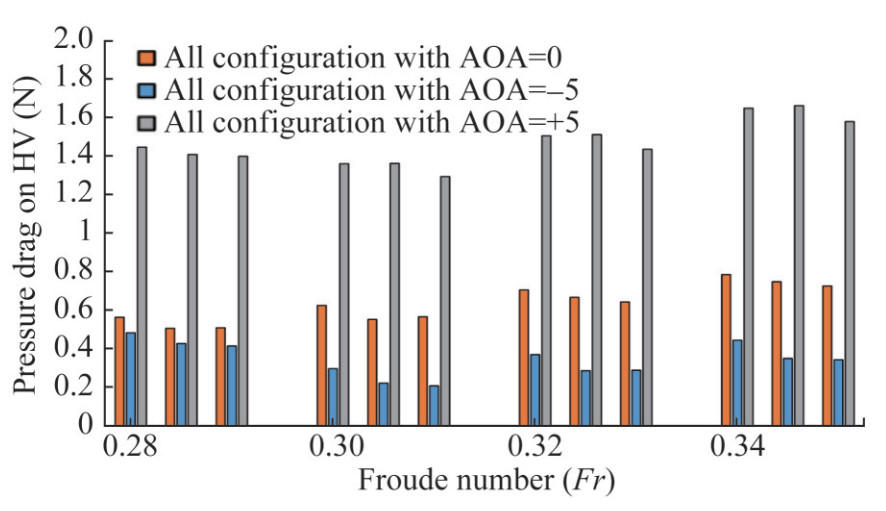 Figure 9 Pressure drag acting on HV for different positions vs. Froude number
Figure 10 shows the percentage increase in the frictional resistance component with the inclusion of HV. Adding HV increases the overall wetted surface area, contributing to an increase in net frictional resistance. The frictional resistance is increasing for all the speeds with all HV configurations. Since the addition of HV doesn't positively affect or increase the frictional resistance, it is planned to incorporate Air Lubrication System (ALS) on the same vessel to reduce the frictional resistance component simultaneously. The combined effect of the HV and Air Lubrication System on resistance characteristics will be studied.
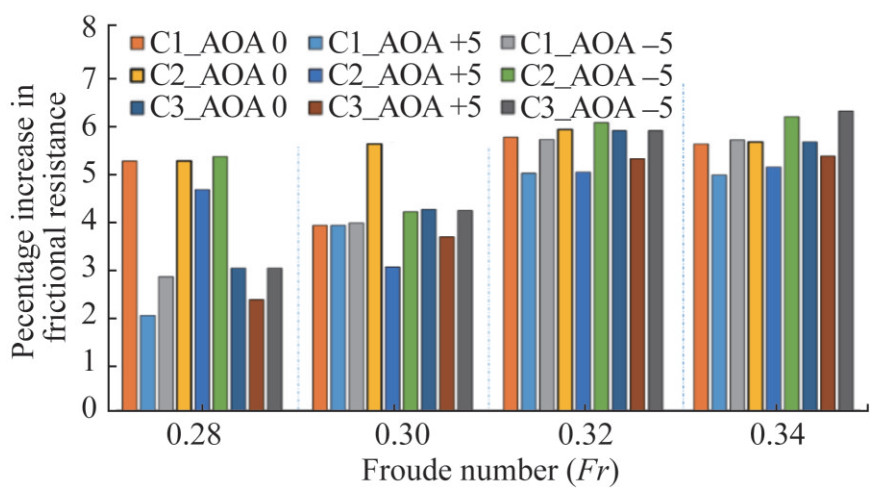 Figure 10 Percentage increase in frictional resistance with the addition of HV
Figure 11 shows the pressure resistance component reduction percentage with HV retrofitment. For Fr=0.28, the pressure resistance is reduced by 5.45% for the C1 configuration with 0° AoA. The reduction rate increases with an increase in speed with the value of 10.7%, 14%, and 15.3% for Fr=0.30, 0.32, and 0.34, respectively. The other two configurations, C2 and C3, with AoF=0, had less significance toward pressure resistance reduction since the reduction rate is lower than the C1 configuration, as shown in Figure 11. The increase reduction rates for the HV case with a negative angle of foil (−5°) and C1 configuration are 10.4, 15.2, 15.7, and 15.6, corresponding to Fr=0.28, 0.30, 0.32, and 0.34, respectively. The reduction in pressure resistance is increased with AoF (AoA), particularly with a negative angle of foil, except at higher speeds, since the pressure drag induced by the inclusion of HV is lesser than with a positive foil angle, as shown in Figure 9. Subsequently, for C2 configuration with − 5° AoF, a maximum reduction in pressure resistance of 11.42%, 14.46%, − 15.8%, and 17% Fr=0.28, 0.30, 0.32, and 0.34, respectively, occurs. The results demonstrate that the HV predominantly affects the pressure resistance components regarding wave-making resistance and suppression of sternward vortices. This study solely analyse the performance of HV on bare hull towards resistance and trim and sinkage and transom wave characteristics that doesn't includes the propeller effect. The propeller behind the hull can substantially modify the flow to the HV with increased velocity, which can change the lift force generation by HV, resulting in a potential change in the HV performance towards resistance and motion reduction characteristics. Therefore, the propeller effect on HV could be addressed as a future study.
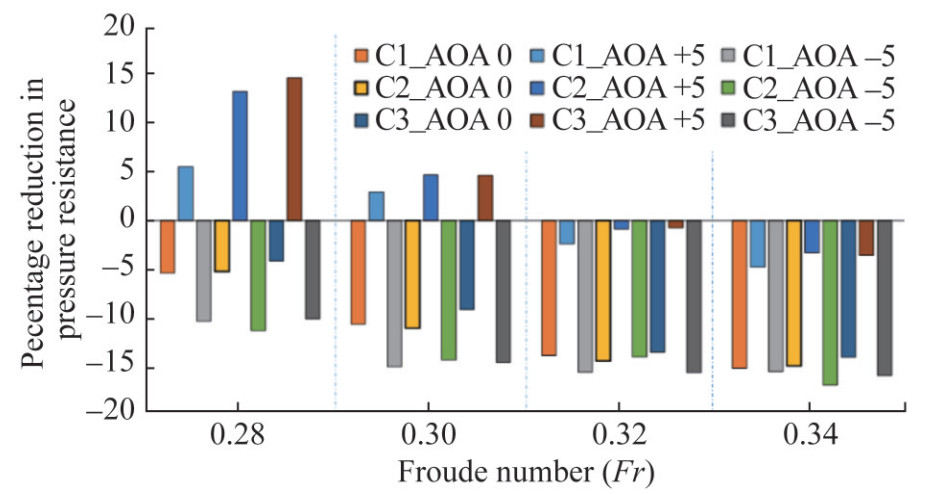 Figure 11 Percentage reduction of pressure resistance with the addition of HV
Furthermore, as the Froude number increases, there is a substantial reduction in total resistance, which is attributed to higher pressure resistance and simultaneous increase in the frictional. At low speeds, the HV is effective with negative AoF, whereas it creates an adverse effect of an increase in resistance with positive AoF. But, as the Fr increases, we can infer from the plot that HV is effective in all the speeds with all proposed configurations.
4.3.1 Effects of HV on trim
One of the positive effects of an HV is a correction of the running trim of the vessel. Figure 10 shows the trim comparison plot with a Fr range of 0.28‒0.34. The numerical analysis was made for different cases, including bare hull and HV of all configurations and with three different foil angles. The bottommost curve in all the plots represents the trim of bare hull condition.
Figure 10 (a) depicts the change in trim with HV configuration 1 with different AoF. At Fr of 0.28, the trim value of the bare hull is found to be −1.068°. Including the HV with configuration 1 (blue curve) with 0° AoF, the trim is reduced to −0.723° with a reduction of nearly 33%. At higher speeds, Fr = 0.34 increases, and the bare hull trim value increases with a maximum of −1.214°, which is reduced to −0.666° and attains a maximum reduction of 45% with the inclusion of HV. The other two curves represent the HV configuration 1 with AoF of +5° (grey curve) and −5° (yellow curve). For Fr = 0.28, the trim is reduced to −0.649° with an increased reduction of nearly 40% with +5°AoF. At Fr = 0.34, the trim is reduced to −0.528° and attains a maximum enhanced reduction of 57% with +5°AoF.
Figure 12(b) represents the test case of the KCS hull retrofitted with HV configuration 2 with different AoF. For Fr=0.30, for the bare hull, the trim value is −1.124°, which was reduced to −0.682 degrees and a reduction of 37% with HV at AoF = 0°. The results show that, with the increase in submergence depth of the HV to 15% of T, the reduction rate is increased marginally from configuration 1. If the AoF is increased to +5°, the trim is further reduced to −0.556 with a reduction of 47%. Figure 12(c) depicts the configuration 3 test case with different AoF. With the increase in depth of HV below the waterline to 20% of T, For Fr=0.32, for the bare hull, the trim value is −1.182°, which was reduced to −0.667 degree and reduction of 41% with HV at AoF = 0°. If the AoF is increased to +5°, the trim is further reduced to −0.532 with a decrease of 53%.
 Figure 12 Change in trim with HV
The lift force generated by a pressure difference between the upper and lower surface of the HV aids in lifting the ship's stern, eventually reducing the trim. For the positive angle of foil, as the lift force generated by the HV is high, the reduction of trim is higher when compared to the negative angle of foil condition. From the plots, we can infer that the HV is more effective as the speed of the vessel increases, which the trim reduction percentage can prove compared to bare hull condition. This reduction positively affects the trim of the vessel. It can be inferred that there is a marginal change in the trim between three vertical loca‐tions and that the effect on trim is not strictly dependent on the vertical position of the HV. However, it is visible that the variation of the AoF can significantly impact the trim angle of the vessel.
4.3.2 Effects of HV on sinkage
As we discussed the HV effects on trim, it is meaningful to present the sinkage results. Figure 13 describes the comparison plot of sinkage for the Fr range of 0.28‒0.34. The top (orange) curve in all the plots (a), (b), and (c) represents the sinkage in bare hull condition.
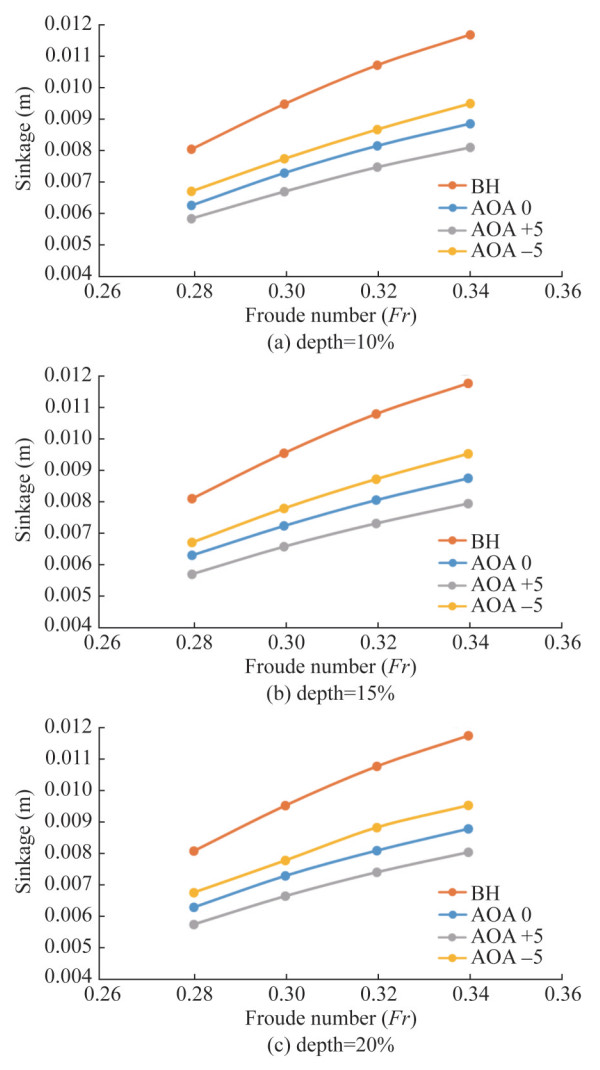 Figure 13 Change in Sinkage with HV
In Figure 13(a), At Fr of 0.28, the sinkage value is 0.008 06 m. In addition to HV with configuration 1 (blue curve) and 0 AoF, the sinkage is reduced to 0.006 27 m with a 22% reduction rate. As the Fr increases to 0.34, the bare hull sinkage value increases to 0.011 71 m, which is reduced to 0.008 87 m, and with the inclusion of HV, the hull attains a maximum reduction of 24%. The other two curves represent the HV configuration 1 with AoF of +5 (grey curve) and −5 (yellow). At Fr of 0.28, the sinkage is reduced to 0.005 847 m with a reduction of nearly 27%. At higher speed with Fr = 0.34, the sinkage is reduced to 0.008 12 m and attains an increased reduction of 31% by providing a positive angle of foil to the HV.
Figure 13(b) represents the test case of the KCS hull retrofitted with HV configuration 2 with different AoF. The results show that, with the increase in submergence depth of HV to 15% of T, the reduction rate is increased marginally from configuration 1. i.e., for Fr = 0.30, for the bare hull, the sinkage value is 0.009 01 m, which was reduced to 0.006 64 m with reduction of 19% with HV at AoF = 0. If the AoF is increased to +5°, an enhanced reduction of 0.007 39 with a reduction of 26% exists. If the AoF is −5°, there exists a reduced (than +5°) reduction of 0.008 80 with a decrease of 14%. The drop had been found for all other speeds. Figure 13(c) depicts the configuration 3 test case with different AoF. With the increase in depth of HV below the waterline to 20% of T. For Fr = 0.32, for the bare hull, the sinkage value is 0.010 74 m, which was reduced to 0.008 01 m with a reduction of 11% with HV at AoF = 0°. If the AoF is increased to +5°, the sinkage is further reduced to 0.007 91 with a reduction rate amplified to 32%. If the AoF is −5°, there exists a reduced (than +5°) reduction of 0.009 48 with a decrease of 19%. The decrease was seen in all other speeds.
The change in trim due to the action of HV will directly influence the vessel's sinkage, reducing the ship's underwater immersed area proportionate to a decrease in net wetted surface area and helps decrease the frictional resistance component. At higher speeds, the lift generated by the HV is more elevated; hence, trim and sinkage are reduced. This is the reason behind the increase in the percentage reduction of total resistance at higher Fr. Since the trim results directly influence sinkage, the trim results can also be valid or applied to sinkage results. It can be inferred that there is a marginal change in the sinkage between three vertical locations; thus, it can be believed that the effect on sinkage is not strictly dependent on the vertical position of the HV.
4.3.3 Effects of HV on transom stern wave system
Modifying the transom stern wave system is among the primary benefits of adopting HV. The KCS hull has an overhang transom stern, which is anticipated with the formation of a rooster tail. The wave elevation of the bare hull is higher near the transom, which is reduced by adopting HV. This reduction in wave height is attributed to the suppression of the free surface that emerges from the transom due to the development of a low-pressure region over the suction side HV behind the transom. Figure 14(a) shows the transom stern wave height for the speed with Fr = 0.34. From this, we can observe that the maximum stern wave height at the centreline is 0.062 3 m from the waterline. With the addition of HV, there is a substantial reduction in stern wave height, which can be seen in Figure 14(b) with configuration 1 with 0° AoF condition, where the extent of the maximum stern wave is reduced to between 0.014 9‒0.038 6 m. The reduction in stern wave height increases with increased AoF.
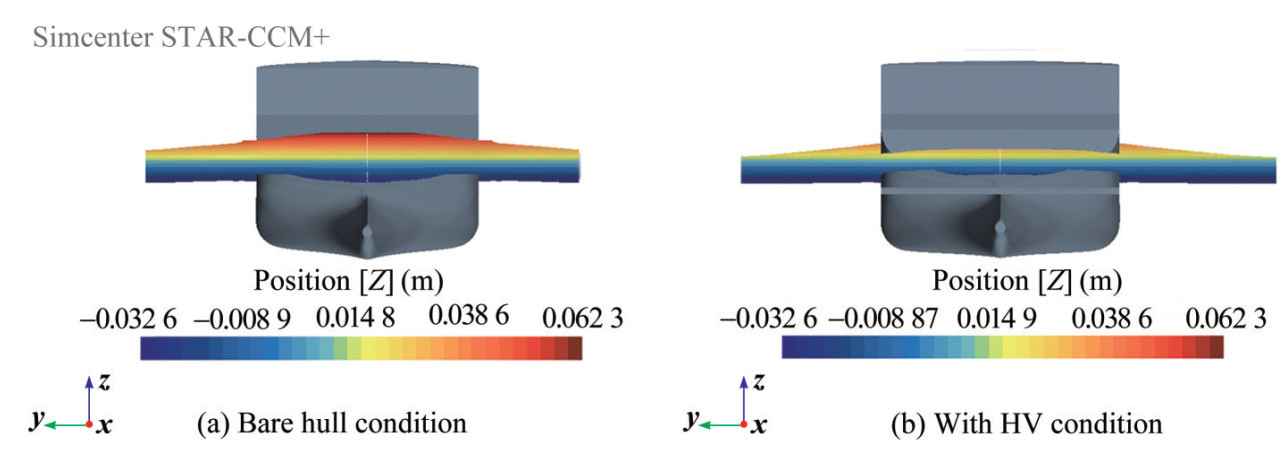 Figure 14 Changes in transom stern wave
This change in the maximum wave height position prevents energy loss by the ships when stern waves break. The region of this energy loss is shifted away from the ship with the inclusion of HV, which aids in lowering ship resistance. The stern wave system begins with the crest due to the high-pressure area. On the other hand, the HV wave system begins with a trough due to the presence of a low-pressure region. The first stern wave's crest amplitude is minimized due to the destructive interference between the two wave systems, and the actual stern wave system is pushed away from the transom and starts aft of HV.
Figure 15 shows the top view of the transom stern wave system. Figure 15(a) depicts the bare hull condition and found that the location of maximum wave height occurs very close to the transom. The energy content of the wave is maximum, which carries the ship's energy, resulting in increased wave-making resistance. The encircled portion of Figure 12(b) demonstrates the transom stern wave with adding HV. The location mentioned above is shifted aft of the transom, which reduces the energy lost by the ship and reduces wave-making resistance. Also, the low-pressure region developed on the top surface of HV aids in suppressing transom wave height, reducing wave-making resistance.
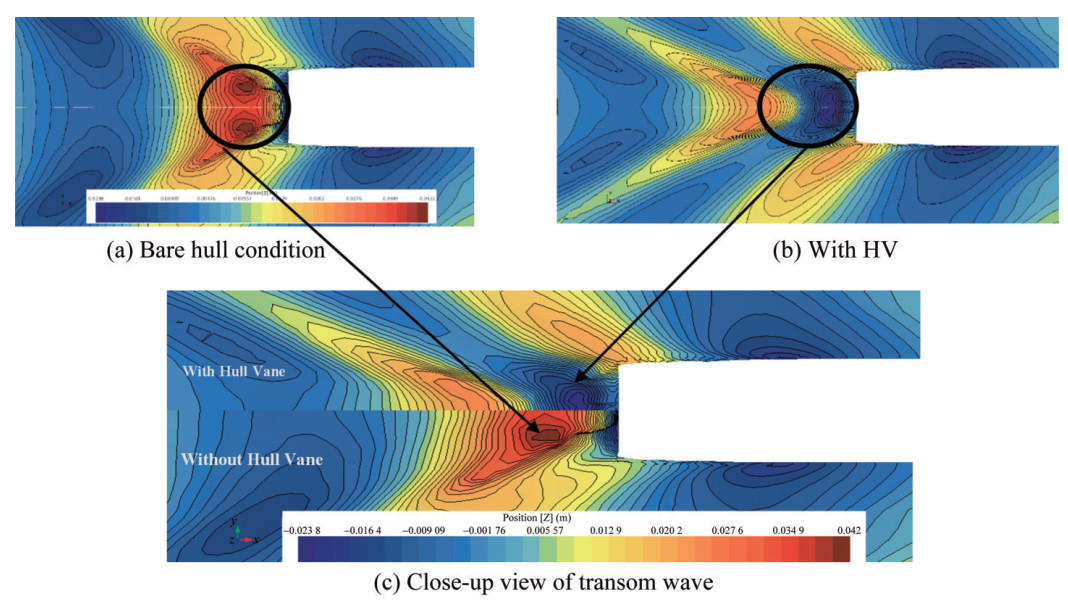 Figure 15 Changes in transom stern wave
The quantitative results are presented through wave-cut elevation of the free surface along the ship's longitudinal centre plane. Similar reduction characteristics were observed for all other speeds, as shown in the Fr = 0.34 case below. Figure 16 shows the effect of HV's vertical position, i. e., submergence depth and AoF, on the bow and stern wave height. From Figure 16(a), in bare hull condition, the transom wave's height is 0.059 m at the location of −0.382 m from the origin (at the rudder stock along the waterline). This location had been moved away from the origin by −0.582 m with a reduced wave height of 0.027 m due to the influence of HV with configuration 1 with 0° AoF. The maximum wave height location had been moved further away from the transom with the addition of HV.
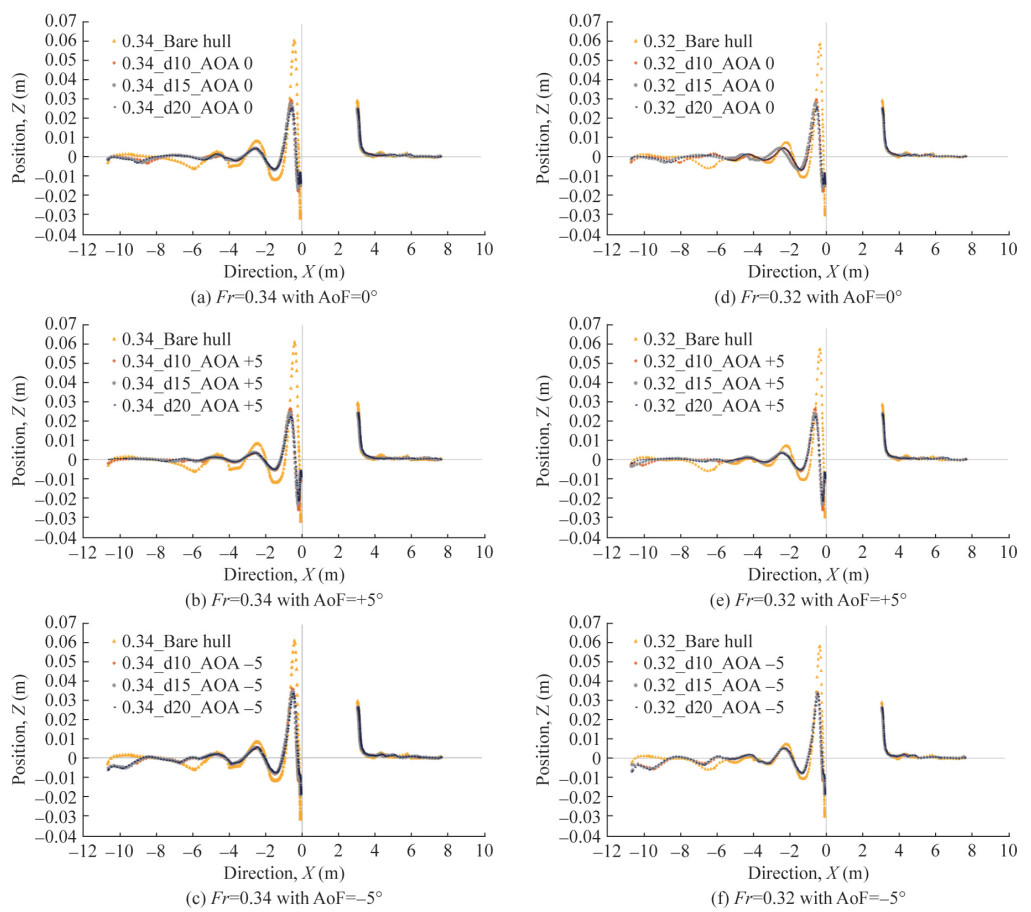 Figure 16 Wave-cut elevation along the Ship's Centre plane for different configurations with varying AoF
With an increase in submergence depth for the same AoF (0°), it was observed that the wave height is further reduced to 0.025 m and 0.022 m for configurations 2 and 3, respectively. It shows that the submergence depth significantly impacts wave height reduction. The influence of HV AoF on wave height can be studied from the wave-cut plot below for all configurations with varying AoF. In Figure 16(a) Shows the wave height plot for Fr = 0.34 for all the configurations with AoF = 0°, where the transom wave height for bare hull condition is 0.059 m from the waterline. With the addition of HV, the wave height is reduced to 0.029 m with configuration 1 with AoF 0°. With increased submergence depth, the reduction increases with a maximum of 0.024 m for configuration 3.
Figure 16(b) indicates the wave height plot for Fr = 0.34 for all the configurations with AoF +5°. The finding is that, with positive AoF and submergence depth, the influence on stern wave height is higher. It is crucial to note that the higher AoF positively affects the successive waves after the first stern wave, and still, the reduction is more significant. Figure 12(c) indicates the wave height plot for Fr = 0.34 for all the configurations with AoF −5°. Figure 16(d), (e), and (f) indicate the wave height plot for Fr = 0.32 for all the configurations with AoF 0°, +5°, and −5°, respectively. From the plots, the transom wave height for bare hull condition is 0.057 5 m from the waterline. With the addition of HV, the wave height is reduced to 0.027 m with configuration 1 with AoF 0°. With the increase in submergence depth, the reduction increases with a maximum of 0.024 m for configuration 3. The key finding is that, with negative AoF and submergence depth, the influence on stern wave height is the same for all the submergence depths, and the HV performs similarly for all the configurations.
From the results, it is opined that, in increased submergence conditions, the flow is primarily similar to undisturbed flow, i. e., the flow between the overhang transom and HV is accelerating more in C1 than in the C3 configuration. This accelerating phenomenon is not found with an increase in submergence condition with no and negative foil angle. But, if we provide a positive angle of foil, a small amount of flow acceleration is observed, which helps in better performance of HV towards trim and sinkage reduction. But, the converse of the condition mentioned above is happening towards resistance reduction.
5 Conclusion
This research aimed to understand the behaviour of the Hull Vane on a medium-speed displacement vessel. The KRISO Container Ship model was chosen as the candidate's vessel to represent the class of medium-speed characteristics. Initially, the resistance estimate on the KCS hull for a bare hull condition was made and modified to account for HV conditions. From the numerical analysis results, the following conclusions were made:
a) Hull Vane at the installed location, i. e., below the transom, develops a low-pressure region that helps in positive effects.
b) The low pressure developed by the HV aids in suppressing the high-velocity energy-carrying eddies behind the transom, reducing the pressure resistance.
c) For resistance reduction, out of 3 HV configurations, C2 is less effective at Fr = 0.28 but more effective as speed increases.
d) The lift force generated by HV aids in uplifting the stern part, resulting in a change in the vessel's altitude, eventually leading to trim reduction for all the selected speeds.
e) The trim reduction significantly depends on the submergence depth and angle of foil, where the drag reduction is nearly 32% for lower speeds for AoF 0 and increases with an increase in AoF, and concerning higher speeds (Fr = 0.34), the drag reduction is nearly 48% and increases with submergence depth and AoF up to 61%.
f) The direct influence on trim reduction was seen in minimizing the sinkage of the vessel, with a maximum reduction of 32% for Fr = 0.34 and 29% for Fr =0.28. The sinkage reduction increased with increasing the submergence depth and AoF.
g) The sinkage reduction eventually reduces the net wetted surface area, leading to a reduced frictional resistance component. This reduction was pronounced for higher speeds due to higher lift force by HV.
h) Adding HV has the maximum resistance reduction of 6% for C2 configuration for Fr = 0.32.
i) The HV also affects the transom wave system, which reduces the energy loss by the ships in the form of waves and helps reduce the wave-making resistance.
j) The inclusion of HV affects the frictional (high speeds) and wave-making resistance components (at all the selected speeds), making it recommendable for a wide range of speeds.
k) The positive AoF gives beneficial results in trim, sinkage, and wave height reduction, but it is unbeneficial in resistance reduction. The reason is the increased pressure drag at positive AoF.
l) From the presented results, retrofitting the HV is effective in the selected speed range but pronouncing as the vessel's speed increases.
Acknowledgement: The authors would like to express their heartfelt gratitude to the Indian Institute of Technology, Madras High-Performance Computing Environment (HPCE) for providing computing resources for carrying out numerical simulations.Competing interest The authors have no competing interests to declare that are relevant to the content of this article. -
Figure 1 KRISO Container Ship Model
Figure 2 Rhodes St. Gense profile HV Model
Figure 3 Proposed HV configuration
Figure 4 Computational domain
Figure 5 Different views of generated volume mesh
Figure 6 Wall Y+ distribution along the hull and HV
Figure 7 Total resistance for the range of Froude numbers
Figure 8 Percentage reduction in total resistance for different positions of HV vs. Froude number
Figure 9 Pressure drag acting on HV for different positions vs. Froude number
Figure 10 Percentage increase in frictional resistance with the addition of HV
Figure 11 Percentage reduction of pressure resistance with the addition of HV
Figure 12 Change in trim with HV
Figure 13 Change in Sinkage with HV
Figure 14 Changes in transom stern wave
Figure 15 Changes in transom stern wave
Figure 16 Wave-cut elevation along the Ship's Centre plane for different configurations with varying AoF
Table 1 Ship main particulars
Parameters Symbol Full scale Model scale Scale λ 1 75.5 Length between perpendiculars Lpp (m) 230.0 3.046 Length at waterline Lwl (m) 232.5 3.079 Beam Bwl (m) 32.2 0.426 Draught T (m) 10.8 0.143 Mass displacement ∇ (m3) 52 030.0 0.121 Depth d (m) 19.0 0.251 7 Block coefficient 0.651 0.651 Wetted surface area w/o rudder S (m2) 9 539.0 1.692 Table 2 Dimensions
Parameters Symbol Dimensions Span s (m) 0.426 Chord length c (m) 0.091 4 Angle of foil θ (degree) 0 Table 3 Test matrix
Parameters Configuration Configuration Configuration 1 (C1) 2 (C2) 3 (C3) Span (m) 0.426 0.426 0.426 Chord length (m) 0.091 4 0.091 4 0.091 4 The angle of foil (°) −5, 0, 5 −5, 0, 5 −5, 0, 5 Longitudinal position from AP (m) 0.8 0.8 0.8 Vertical position from waterline (m) 0.014 3 0.021 45 0.028 6 Froude number 0.28‒0.34 Table 4 Grid convergence study
Parameters (°) Fine Mid Coarse No. of cells (106) N1, N1, N1 4 2 1.5 Grid size h1, h2, h3 0.071 0 0.100 0 0.141 4 Grid refinement factor r21, r32 1.408 5 1.414 0 Output values ϕ1, ϕ2, ϕ3 7.840 0 7.960 0 8.04 ε21, ε32 0.120 0 0.080 0 Apparent order P 1.880 0 Extrapolated values ϕ_ext_21, ϕ_ext_32 7.707 2 7.872 9 Approximate relative error ea21, ea32 0.015 3 0.010 1 Extrapolated relative error eext21, eext32 0.017 2 0.011 1 Grid convergence index GCIfine21, GCImedium32 0.021 167 2 0.013 685 -
Budiyanto MA, Syahrudin MF, Murdianto MA (2020) Investigation of the effectiveness of a stern foil on a patrol boat by experiment and simulation. Cogent Engineering, 7(1). https://doi.org/10.1080/23311916.2020.1716925 Çelik C, Danışman DB, Khan S, Celik C, Danisman DB, Kaklis P, Khan S (2019) An investigation into the effect of the Hull Vane on the ship resistance in OpenFOAM. https://www.researchgate.net/publication/335840650 Chrismianto D, Yudo H, Rangga Dewa N (2020) Modification of 30 Gt fishing vessels using NACA 2408 type for reducing ship resistance. International Journal of Advanced Research in Engineering and Technology (IJARET), 11(4): 57-62 Dwiputera H, Prawira NY, Budiyanto MA, Arif M (2020) Effect of angle of foil variation of stern foil on high-speed craft on various speed with computational fluid dynamics method. International Journal of Technology, 11(7): 1359-1369. https://doi.org/10.14716/ijtech.v11i7.4467 Firdhaus A, Akbar R (2019) Experimental and numerical study of ship resistance due to variation of hull vane positioning in the longitudinal direction. Proceedings of International Conference on Ship and Offshore Technology. https://www.researchgate.net/publication/354714893 https://www.researchgate.net/publication/354714893 Hemanth Kumar Y, Vijayakumar R (2019) Stern flaps: A cost-effective technological option for the Indian shipping industry, Maritime Affairs: Journal of the National Maritime Foundation of India, 14(2): 26-27. https://doi.org/10.1080/09733159.2018.1562454 Hemanth Kumar Y, Vijayakumar R (2020a) Development of an Energy-efficient Stern Flap for improved Warship EEDI of a Typical High-speed Displacement Surface Combatant. Defence Science Journal 70(1): 95-102. https://doi.org/10.14429/dsj.70.14669 Hemanth Kumar Y, Vijayakumar R (2020b) Effect of flap angle on transom stern flow of a high-speed displacement surface combatant. Ocean Systems Engineering 10 (1): 1-23. https://doi.org/10.12989/ose.2020.10.1.001 Hou H, Krajewski M, Ilter YK, Day S, Atlar M, Shi W (2020) An experimental investigation of the impact of retrofitting an underwater stern foil on the resistance and motion. Ocean Engineering, 205. https://doi.org/10.1016/j.oceaneng.2020.107290 ITTC-Recommended Procedures and Guidelines (2021) Practical Guidelines for Ship Resistance CFD Karafiath G, Cusanelli DS, Lin CW (1999) Stern wedges and stern flaps for improved powering-U. S. Navy Experience, SNAME Transactions, 107, 67-99 Kiryanto Budiarto U, Firdhaus A (2021) Analysis of the effect of hull vane on ship resistance using CFD methods. IOP Conference Series: Earth and Environmental Science, 649(1). https://doi.org/10.1088/1755-1315/649/1/012051 Murdianto MA, Budiyanto MA, Syahrudin MF (2020) Application of stern foil on full draft patrol vessel at high-speed condition using computational fluid dynamics (CFD) method. AIP Conference Proceedings, 2255. https://doi.org/10.1063/5.0013750 Nawabi RA, Syahril, Primawati (2021) Study reduction of resistance on the flat hull ship of the semi-trimaran model: vs stern foil. CFD Letters, 13(12): 32-44. https://doi.org/10.37934/cfdl.13.12.3244 Sindagi S, Vijayakumar R (2020) A succinct review of MBDR/ BDR technique in reducing ship's drag. Ships and Offshore Structures, 1-12. Taylor and Francis Ltd. https://doi.org/10.1080/17445302.2020.1790296 Sindagi S, Vijayakumar R, Saxena BK (2018) Frictional drag reduction: Review and numerical investigation of microbubble drag reduction in a channel flow. Transactions of the Royal Institution of Naval Architects Part A: International Journal of Maritime Engineering, 121-139. https://doi.org/10.3940/rina.ijme.2018.a2.460 Sindagi S, Vijayakumar R, Saxena BK (2020) Parametric CFD investigation of ALS technique on reduction in drag of bulk carrier. Ships and Offshore Structures, (4): 417-430. https://doi.org/10.1080/17445302.2019.1661617 Sindagi S, Vijayakumar R, Saxena BK (2021) Experimental parametric investigation to reduce drag of a scaled model of bulk carrier using BDR/ALS technique. Journal of Ship Research 65: 257-265. https://doi.org/10.5957/JOSR.02190009 Soma GC, Vijayakumar R (2023a) Numerical investigation on the effect of hull vane for a high-speed displacement vessel. Ships and Offshore Structures. https://doi.org/10.1080/17445302.2023.2239541 Soma GC, Vijayakumar R (2023b) Hydrodynamic performance of high-speed displacement vessel with hull vane. Ocean Engineering, 285, 1. https://doi.org/10.1016/j.oceaneng.2023.115362 Suastika K, Hidayat A, Riyadi S (2017) Effects of the application of a stern foil on ship resistance: A case study of an Orela crew boat. International Journal of Technology, 8(7): 1266-1275. https://doi.org/10.14716/ijtech.v8i7.691 Terziev M, Tezdogan T, Oguz E, Gourlay T, Demirel YK, Incecik A (2018) Numerical investigation of the behaviour and performance of ships advancing through restricted shallow waters. Journal of Fluids and Structures, 76: 185-215. https://doi.org/10.1016/j.jfluidstructs.2017.10.003 Uithof K, Hagemeister N, Bouckaert B, van Oossanen PG, Moerke N (2016) A systematic comparison of the influence of the Hull Vane®, interceptors, trim wedges, and ballasting on the performance of the 50m AMECRC series #13 patrol vessel. Warship 2016: Advanced Technologies in Naval Design, Construction, & Operation. Vipin CV, Gopinath S, Vijayakumar R (2022) Numerical Study on A Planning Hull to Improve the Sea Water Intake at High Speed. OCEANS 2022-Chennai, 1-8, https://doi.org/10.1109/OCEANSChennai45887.2022.9775125
