
Maritime Energy Transition: Future Fuels and Future Emissions
https://doi.org/10.1007/s11804-023-00369-z
-
Abstract
The lifecycle greenhouse gas (GHG) emissions (Well-to-Wake) from maritime transport must be reduced by at least 50% in absolute values by 2050 to contribute to the ambitions of the Paris Agreement (2015). A transition from conventional fuels to alternative fuels with zero or lower GHG emissions is viewed as the most promising avenue to reach the GHG reductions. Whereas GHG and toxic pollutants emitted from the use of fossil fuels (heavy fuel oil (HFO) and marine gas/diesel oil (MGO/MDO)) are generally well understood, the emissions associated with the new fuel options are only now being measured and communicated. This review provides an outlook on fuels that could help shipping respond to the decarbonization effort including Liquefied Petroleum Gas (LPG), Liquefied Natural Gas (LNG), methanol, ammonia, and hydrogen. A quantification of the pollutants associated from the use of these fuels is provided and challenges and barriers to their uptake are discussed.-
Keywords:
- Greenhouse gas ·
- Emissions ·
- Maritime transport ·
- Future fuels ·
- Future emissions ·
- Life-cycle assessment ·
- Energy transition
Article Highlights● Implementing renewably sourced zero carbon fuels, such as hydrogen and ammonia, is the most promising, and perhaps the only, option to deliver the desired greenhouse gas (GHG) reductions for the maritime industry.● Although hydrogen produced from renewable sources can achieve a WtW GHG emission reduction of 79.9% compared to conventional fuels, if hydrogen is produced from NG, the WtW GHG emissions will contribute to 96.2% more GHG emissions compared to conventional fuels.● Ammonia produced from renewable sources (green ammonia) can achieve a 71.0% GHG emission reduction, but if ammonia is produced from NG and the current N2O emissions are not abated, the use of ammonia as a fuel will result in a WtW GHG emissions increase of 140.0%.● Technical maturity, tank capacity and bunkering infrastructure are some of the key hurdles to overcome to implement ammonia and hydrogen across the worldwide fleet to realize a net-zero shipping future. -
1 Introduction
The downstream (Tank-to-Wake, TtW) greenhouse gas (GHG) emissions from maritime transport that are emitted from ships combustion engines are estimated at approximately one billion tons of carbon dioxide equivalents (CO2e) annually (Buhaug et al., 2009; Faber et al., 2020; Lindstad et al., 2021; Smith et al., 2014). When the upstream (Well-to-Tank, WtT) GHG emissions from fuel production are included the total Well-to-Wake (WtW), or life-cycle emissions, increase to 1.25 – 1.5 billion tons of CO2eq (Lindstad et al., 2020), which is 3% of the 50 billion tons of anthropogenic GHG emitted annually (BP, 2021).
In 2018, the International Maritime Organization (IMO) agreed to reduce GHG emissions, which includes carbon dioxide (CO2), methane (CH4) and nitrous oxide (N2O), from international shipping by at least 50% by 2050 (to 2008) (IMO, 2018) as a pathway to reach the Paris Agreement goal to limit global warming to 1.5℃ compared to pre-industrial levels (UN, 2015). Recent activities indicate that this target will most likely be revised, with a strong push to reduce GHG emissions by 100% by 2050 (Bush, 2022). There are several options (and their combinations) for the maritime industry to reach the required GHG reductions, including design and other technical improvements of ships, operational improvements, and, perhaps most promisingly, adopting energy carriers (fuels) with lower or zero GHG footprint (effectively moving away from the conventional use of fossil or carbon-based fuels) (Bouman et al., 2017). Considering that 99.5% of the current world fleet, which consists of approximately 110 700 vessels above 100 GT (not including inland waterways, non-merchant, and non-propelled vessels) is powered by diesel engines running on conventional marine fuel oils (such as heavy fuel oil (HFO) and marine gas/diesel oil (MGO/MDO)) (Figure 1), switching to fuels with lower or zero GHG emissions will be a disruptive transition for the conservative industry (DNV, 2021; UNCTAD, 2021). As indication of the decarbonization efforts by ship owners, approximately 12% of current newbuilds are ordered with fuel systems that move away from conventional fuels (Figure 1), with an increase in use of fuels such of ammonia, hydrogen, methanol, Liquefied Petroleum Gas (LPG) and Liquefied Natural Gas (LNG).
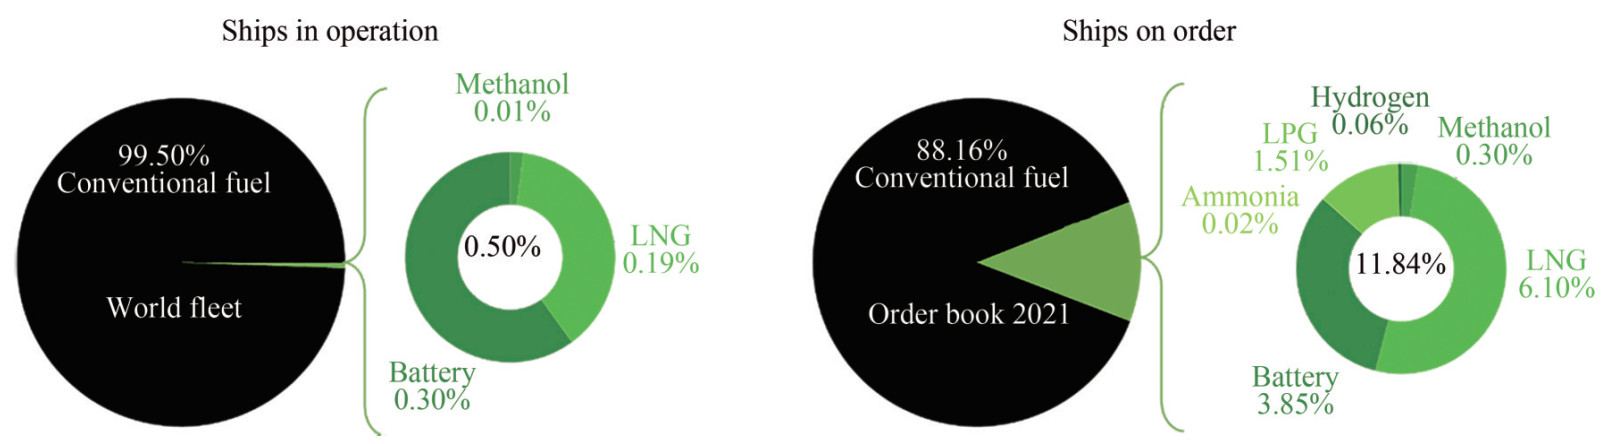 Figure 1 Uptake of alternative fuels for the world fleet (June 2021) (adapted from DNV, 2021)
At first glance, the use of carbon-free fuels, such as ammonia and hydrogen, are obvious candidates to reduce carbon dioxide (CO2) emissions as the carbon-free molecules do not release CO2 when combusted. It is also generally accepted that LNG combusted in the ship's engines delivers approximately 25% lower CO2emissions than conventional fuels (MGO and HFO) (Lindstad et al., 2020; Ushakov et al., 2019). However, these TtW emission reductions do not elucidate other issues arising from other pollutants that are released during combustion. For example, when one includes WtT estimates for the LNG supply chain (including extraction and transportation) and un-combusted methane (CH4) from the ship's engine(s) (complete TtW), these additional emissions reduce and in the worst case negate any GHG benefits relative to HFO or MGO (Lindstad, 2019; Lindstad and Rialland, 2020). Furthermore, emissions of N2O, a potent GHG with a Global Warming Potential (GWP) 273 times that of CO2 on a 100-year timescale, formed in the combustion of ammonia can significantly contribute to CO2e emissions (Zincir, 2022).
In an effort to compare the alternative fuels (LNG, LPG, methanol, hydrogen, and ammonia) being pursued by the shipping industry to reduce GHG emissions, there is first provided a summarized emission factor data (in both g/kWh and g/MJ) of all of the pollutant emissions (both toxic and GHG) that result from combustion of these fuels (complete TtW emissions); these values are compared against traditional bunker fuel (HFO) and diesel (MGO/MDO) (Tables 1 and 2). The emissions of carbon dioxide (CO2), methane (CH4) and nitrous oxide (N2O) are used to calculate CO2e emissions as a metric to compare exhaust gas emissions based on their GWP on both a 20-year and 100-year perspective (Shine, 2009). The most recent GWP values provided by the International Panel on Climate Change (IPCC) in their 6th Assessment Reports (AR 6), (IPCC, 2022) are based on the most recent scientific work and therefore recommended as a characterization factor of climate impact in life-cycle assessment (LCA) studies (Hauschild et al., 2013). Values for sulfur oxides (SOx), nitrogen oxides (NOx), ammonia (NH3), particulate matter (PM), non-methane volatile organic compounds (NMVOC), and carbon monoxide (CO) emission values are also provided as they have both global climate effects and regional and local environment impacts on human health and nature (Lindstad et al., 2020). These TtW emissions are then presented with WtT emissions to provide a LCA summary of the alternative fuels (Table 3). In this way, one can clearly compare the GHG reduction potentials of LNG, LPG, methanol, hydrogen, and ammonia against HFO and MGO/MDO from both WtT and TtW perspectives.
Table 1 Tank-to-Wake (TtW) combustion emissions by fuel (gpollutant/kWh)Pollutant HFO MGO LPG LNG Methanol Hydrogen24 Ammonia25 CO2 5616 54511 47516 41819 69523 9024 11326 CH4 1.08 × 10⁻², 7 1.02 × 10⁻², 12 1.00 × 10⁻², 17 3.0020 2 × 10⁻², 23 - - N2O 3.06 × 10⁻², 8 3.06 × 10⁻², 13 3.00 × 10⁻², 17 2.13 × 10⁻², 21 - - 1.9526 SO21 2.009 0.3214 0.6010 3.00 × 10⁻², 14 - - 0.1026 NOx2 14.410 14.414 12.910 1.1714 6.523 4.024 28.226 NH3 2.17 × 10⁻³, 9 2.17 × 10⁻³, 9 - - - - 1027 PMTotal 0.679 0.1614 0.2018 0.02714 0.09323 0.01524 0.03526 NMVOC3 0.419 0.4315 0.6810 0.3822 1.623 0.3024 2027 CO 0.949 0.7315 1.2118 1.8622 3.723 0.1124 5027 CO2e (100 year)4 569 554 484 513 696 90 646 CO2e (20 year)5 569 554 484 671 697 90 628 Notes:
1According to Annex VI of the International Convention for the Prevention of Pollution from Ships (MARPOL), the SO2 emitted from HFO considers the limits of sulphur in the fuel oil used on board ships operating outside designated emission control areas to 0.50% m/m
2Pollutant abatement systems (e.g., SCR) not included
3Non-methane volatile organic compounds
4CO2e (100 year) [g/kWh] = (CO2 (g/kWh) * 1 (GWPCO2)) + (CH4 (g/kWh) * 29.8 (GWPCH4)) + (N2O (g/kWh) * 273(GWPN2O)
5CO2e (20 year) [g/kWh] = (CO2 (g/kWh) * 1 (GWPCO2)) + (CH4 (g/kWh) * 82.5 (GWPCH4)) + (N2O (g/kWh) * 264 (GWPN2O)
6Source: Calculated from (Comer, 2021): TtW (g/kWh) = TtW (g/gfuel) * SFC (g/kWh), consistent with (Lindstad et al., 2021): TtW (g/kWh) = 558
7Source: Calculated (TtW (g/kWh) = TtW (g/gfuel) * SFC (g/kWh)) and reported from (Comer, 2021)
8Source: Calculated (TtW (g/kWh) = TtW (g/gfuel) * SFC (g/kWh)) and reported from (Comer, 2021)
9Source: Calculated from TtW(g/MJ) reported from (Brynolf et al., 2014a)
10Source: (Kristenen, 2015)
11Source: Calculated from (Comer, 2021): TtW (g/kWh) = TtW (g/gfuel) * SFC (g/kWh), consistent with (Lindstad et al., 2021): TtW (g/kWh) = 541
12Source: Calculated (TtW (g/kWh) = TtW (g/gfuel) * SFC (g/kWh)) and reported from (Comer, 2021); consistent with (Gilbert et al., 2018):
TtW (g/kWh) = 1.00 × 10⁻²
13Source: Calculated (TtW (g/kWh) = TtW (g/gfuel) * SFC (g/kWh)) and reported from (Comer, 2021); consistent with (Gilbert et al., 2018):
TtW (g/kWh) = 2.60 × 10⁻²
14Source: (Faber et al., 2020; Gilbert et al., 2018)
15Source: Calculated from TtW(g/MJ) reported from (S. Brynolf et al., 2014)
16Source: (Lindstad et al., 2021)
17Extraplotated from (Lindstad et al., 2021) and consistent with (Comer, 2021)
18Calculated from (Wagemakers and Leermakers, 2012)
19Source: Calculated from (Comer, 2021): TtW (g/kWh) = TtW (g/gfuel) * SFC (g/kWh), consistent with (Gilbert et al., 2018): TtW (g/kWh) =
412, and with (Lindstad et al., 2021): TtW (g/kWh) = 404
20Conservative report of most common LNG engines (Otto-SS and MS) calculated (TtW (g/kWh) = TtW (g/gfuel) * SFC (g/kWh)) and reported from (Comer, 2021): LNG-Diesel = 0.2 g/kWh; LNG-Otto-SS = 2.5 – 3.5g/kWh, LNG-Otto-MS = 5.5 – 6.5g/kWh; consistent with (Winnes et al., 2020)
21Source: Calculated (TtW (g/kWh) = TtW (g/gfuel) * SFC (g/kWh)) and reported from (Comer, 2021); consistent with (Gilbert et al., 2018) :
TtW (g/kWh) = 1.60 × 10⁻²
22Source: (Winnes et al., 2020)
23Source: (Fridell et al., 2021) at 80% engine load
2485% H2 energy share with diesel in an inline-4 heavy-duty hydrogen (port injection)-diesel (direct injection) dual-fuel engine (Dimitriou et al., 2018); consistent with (Lilik et al., 2010) and (Dimitriou et al., 2018)
2595% NH3/ 5% MDO energy share (Zincir, 2022)
26Source: (Zincir, 2022)
26Source: (Hansson et al., 2020b)Table 2 Tank-to-Wake (TtW) combustion emissions by fuel (gpollutant/MJ)1Pollutant HFO MGO LPG LNG Methanol Hydrogen Ammonia LCV2 (MJ/kg) 40.26 42.76 46.311 486 19.96 12015 18.617 SFC3 (g/kWh) 1807 1707 15512 1527 44114 5716 38818 CO2 77.5 75.1 66.2 57.3 79.2 13.1 15.7 CH4 1.49 × 10⁻³ 1.41 × 10⁻³ 1.39 × 10⁻³ 0.41 2.28 × 10⁻³ - - N2O 4.23 × 10⁻³ 4.22 × 10⁻³ 4.18 × 10⁻³ 2.92 × 10⁻³ - - 0.27 SO2 0.288 4.41 × 10⁻² 8.36 × 10⁻² 4.11 × 10⁻⁴ - - - NOx 1.99 2.04 1.80 0.16 0.74 0.58 3.91 NH3 3.00 × 10⁻⁴, 8 3.00 × 10⁻⁴, 8 - - - - 1.39 PMTotal 9.3 × 10⁻², 8 2.20 × 10⁻² 2.79 × 10⁻² 3.70 × 10⁻³ 1.06 × 10⁻² 2.19 × 10⁻³ - NMVOC 0.0568 0.05910 9.48 × 10⁻² 5.21 × 10⁻² 0.2 4.39 × 10⁻² 2.8 CO 0.138 0.110 0.17 0.25 0.52 1.65 × 10⁻² 6.9 CO2e(100 year)4 78.79 76.39 67.413 70.3 79.3 13.1 89.5 CO2e (20 year)5 78.7 76.3 67.4 92.0 79.4 13.1 87.0 Notes:
1All combustion emission values (g/MJ) calculated (unless indicated as reported) from values reported in Table 1 (TtW combustion emissions by fuel (g/kWh)), whereby:
$ \frac{g_{\text {pollutant }}}{\mathrm{MJ}}=\frac{g_{\text {pollutant }}}{\mathrm{kWh}_{\text {engine output }}} \times \text { engine efficiency } \times \frac{\mathrm{kWh}_{\text {delivered to engine }}}{3.6 \mathrm{MJ}}=\frac{g_{\text {pollutant }}}{\mathrm{kWh}_{\text {engine output }}} \times \frac{\mathrm{kWh}_{\text {engine output }}}{\mathrm{g}_{\text {fuel }}} \times \frac{\mathrm{g}_{\text {fuel }}}{\mathrm{MJ}}$
2Lower Calorific Value
3Specific Fuel Consumption
4CO2e (100 year) [g/MJ] = (CO2 (g/MJ) * 1 (GWPCO2)) + (CH4 (g/MJ) * 29.8 (GWPCH4)) + (N2O (g/MJ) * 273 (GWPN2O)
5CO2e (20 year) [g/MJ] = (CO2 (g/MJ) * 1 (GWPCO2)) + (CH4 (g/MJ) * 82.5 (GWPCH4)) + (N2O (g/MJ) * 264 (GWP N2O)
6Source: (Faber et al., 2020; Lindstad et al., 2021)
7Source: (Comer, 2021; Faber et al., 2020)
8Source: (Brynolf et al., 2014a)
9Consistent with (Al-Aboosi et al., 2021; Pavlenko, 2020)
10Source: Reported from (Brynolf et al., 2014b)
11Source: ("Resolution MEPC.281(70) – Amendments to the 2014 Guidelines on the Method of Calculation of the Attained Energy Efficiency Design Index (EEDI) For New Ships (Resolution MEPC.245(66), as Amended by Resolution MEPC.263(68))-(Adopted on 28 October 2016)," 2016)
12Source: ("MAN B&W ME-LGIP, " 2020)
13Consistent with (Nikolaou et al., 2017)
14Source: (Fridell et al., 2021)
15Source: (Gilbert et al., 2018; Lindstad et al., 2021)
16Source: (Gilbert et al., 2018)
17Source: (Herdzik, 2021; Lindstad et al., 2021)
18Source: (Zincir, 2022)Table 3 Emission factors (WtT, TtW and WtW) of different shipping fuels (g CO2e/MJ of fuel) and comparison to HFO/MGO (conventional shipping fuels) (GWP100)Supply chain HFO MGO LPG LNG NG Methanol NG Hydrogen Ammonia Renewable NG Renewable NG Well-to-Tank (WtT) 9.01 12.82 7.23 9.74 20.45 4.56 1597 9.78 12110 WtT Difference to HFO - +42.2% -20.6% +7.6% +126.7% -50.0% 1 667.7% +7.8% 1 244.4% Tank-to-Wake(TtW) 78.7 75.0 65.5 70.3 79.3 13.1 13.1 15.7 – 89.59 15.7 – 89.59 TtW Difference to HFO - -4.7% -16.8% -10.7% 0.71% -83.4% -83.4% -80.0% – +13.7% -80.0% – +13.7% Well-to-Wake (WtW) 87.7 87.8 72.7 80.0 99.7 17.6 172.1 25.4 – 99.2 25.4 – 210.5 WtW Difference to HFO - +0.1% -17.2% -8.8% +13.6% -79.9% +96.2% -71.0%–+13.1% +55.9%–+140.0% Notes:
1Source: (Al-Aboosi et al., 2021) = 9.0; (Nikolaou et al., 2017) = 9.8; (Comer, 2021) = 10.8
2Source: (Al-Aboosi et al., 2021) = 12.8; (Nikolaou et al., 2017) = 12.7; (Comer, 2021) = 13.6
3Source: (Nikolaou et al., 2017)
4Source: (Comer, 2021); consistent with (Brynolf et al., 2014a) = 9.3
5Source: (Brynolf et al., 2014a)
6Source: (Ozawa et al., 2017)
7Source: Calculated from (Lindstad et al., 2021): WtT (g/kWh) = 1 086; consistent with (Ozawa et al., 2017)
8Source: (Al-Aboosi et al., 2021); consistent with (Lindstad et al., 2021)
9Range reported for 0 g/kWh and 1.95 g/kWh (Table 1) N2O emissions, respectively
10Source: Calculated from (Lindstad et al., 2021): WtT (g/kWh) = 874; consistent with (Al-Aboosi et al., 2021)There is also provided highlights of the key challenges to adopt alternative fuels in the shipping industry to put in context the difficulty in switching to these fuels. Typical key barriers include the retrofit cost (implementation of new or adaptation of existing machinery and storage), engine availability and technical maturity as an energy converter, increased and/ or highly variable fuel prices (with unknown availability), lack of global bunkering infrastructure, increased tank capacity to store less energy-dense fuels (this is a substantial barrier for many alternative fuels to be used in deep-sea trading), and safety and handling considerations (particularly the currently unestablished rules and regulations) (DNV, 2021).
By first providing the most up-to-date and quantitative TtW emission factors of all the GHG and toxic pollutants that are released during combustion from alternative fuels, and then duly providing an LCA summary for complete WtW emission factors, one can weigh the GHG reduction potentials of LNG, LPG, methanol, hydrogen, and ammonia against the reality of implementing these alternative fuels across the global fleet with the highlighted key barriers to uptake in the shipping industry.
2 Future fuels and emissions
2.1 Liquefied natural gas (LNG)
There is a large interest in the use of Liquefied natural gas (LNG) in shipping to reduce emissions, including CO2 (Burel et al., 2013). LNG consists mainly of methane and is favored since the emissions of air pollutants SOx, PM and NOx are significantly lower from LNG engines compared to traditional marine diesel engines burning HFO or MGO/MDO (Brynolf et al., 2014a). The low sulfur content of LNG results in low SOx emissions (although the sulfur content of the pilot fuel can contribute to SOx emissions), and corollary, PM emissions are low (the absence of polyaromatics and combustion specifics also contribute to low PM emissions). The lower NOx emissions from LNG compared to HFO is mainly a result of reduced peak temperatures during combustion (Woodyard, 2009), and although can reach Tier Ⅲ levels, are still significant. Also, CO2emissions per energy unit is relatively low from LNG combustion due to more chemically bound energy per carbon content in natural gas than in fuel oil (Winnes et al., 2020).
The marine engines operating on LNG (or equally Liquefied Biogas, LBG) are very often either a low-pressure or high-pressure type, with the low-pressure dual fuel engines being the most used on ships that are not LNG carriers. The low-pressure engines are either spark ignited (SI) (gas only) or use a dual fuel technology where a pilot fuel injection is used for ignition (referred to as LPDF or LNG Otto, medium speed (MS) and slow speed (SS)). Another type of dual fuel engine is the high-pressure engine that uses LNG as fuel in a diesel combustion cycle (HDPF or LNG diesel).
The drawback from the combustion in the low-pressure engines is a 2.3% – 4.1% slip of unburnt methane through the combustion process for the most common LNG fueled-engines that are in operation today (Stenersen and Thonstad, 2017). The slip, measured as CO2e from a 100-year perspective, is large enough to result in CO2e emissions from LNG to be comparable to those from MGO (Pavlenko, 2020), and when measured from a 20-year perspective, results in emissions of CO2e to exceed those from MGO (Winnes et al., 2020). The methane slip from ships engine contributes to the world's increasing global methane emissions, where the rising atmospheric methane levels represent a major challenge in the effort to limit global warming (Lindstad et al., 2020).
In a comparison between the engine types, the methane slip is lower from a HPDF engine (LNG diesel) (0.2 – 0.4 g/kWh) than a LPDF engine (LNG Otto) (average emission factors are reported as 5.5 – 6.9 g/kWh for LPDF MS (LNG Otto MS) and 2.5 – 3.2 g/kWh for LPDF SS (LNG Otto SS)) (Comer, 2021; Winnes et al., 2020). This is mainly a result of burning the fuel directly upon injection during the compression stroke in a HPDF engine, whereas a LPDF engines compress an air/fuel mixture (Ushakov et al., 2019). These emission factors will also change at different load conditions and from different engine manufacturers.
2.2 Liquefied petroleum gas (LPG)
Liquefied petroleum gas (LPG or LP-gas) consists of propane, propylene, butane, and butylenes (US EPA, 2020). Although the emissions from the use of LPG onboard a vessel have not been reported to date, it is known that gaseous pollutants such as NOx, CO, and organic compounds are produced during combustion as are small amounts of SO2 and PM. LPG combustion results in lower CO2emissions compared to oil-based fuels due to its lower carbon to hydrogen ratio (Nikolaou et al., 2017), but the CO2emissions are higher than that of LNG. Unburnt fuel emissions can also be released from LPG combustion, including propane (GWP100 = 0.02), n-butane and isobutane (GWP100 butane = 0.006) (IPCC, 2022), although any slip of un-combusted fuel through the engine would result in less GHG emissions for LPG than for LNG.
2.3 Methanol
Methanol is also a potential alternative fuel for shipping. It is a liquid at standard temperature and pressure, which makes handling easier in comparison to LNG (Brynolf et al., 2014b). On an industrial scale, methanol is predominantly produced from natural gas reforming and distilling the resulting mixture (Riaz et al., 2013). Methanol can also be produced from renewable resources, enabling lower WtT GHG emissions in the transition to non-fossil fuels (Fridell et al., 2021).
Recently, emissions of exhaust gases and PM from a dual fuel marine engine using methanol as fuel with MGO as pilot fuel have been reported for an operating ferry (Fridell et al., 2021). It was determined that the emission factor for NOx was between 6.5 and 12.3 g/kWh, which is lower than what is typically found for MGO, but does not reach the Tier Ⅲ limit. The emissions of CH4 was determined to be 0.020 g/kWh, which is low when compared to the 5.5 – 6.9 g/kWh reported for dual fuel LNG engines of similar type (Stenersen and Thonstad, 2017). The PM emission (as mass of particles) was measured as approximately 0.1 g/kWh, which is lower than what is normally reported when using MGO as fuel, although there is a significant range in results from MGO reported in the literature (from 0.1 to 0.4 g/kWh) (Winnes et al., 2016). The black carbon (BC) represented approximately 17% of the mass of the PM in the data reported and the BC emissions are also lower than what is expected from MGO (Fridell and Salo, 2016). Furthermore, the measured emissions of THC and NMHC were both 1.6 g/kWh, which is higher than what has been reported when using fuel oil in a medium speed engine (approximately 0.2 g/kWh) (Cooper and Gustafsson, 2004). Although emissions of aldehydes are a concern for alcohol fuels, the emission factor measured for formaldehyde was 4.9 × 10⁻⁴ g/kWh, which is well below the US HD limit of 0.013g/kWh ("Worldwide Emissions Standards Heavy Duty and Off-Highway Vehicles, " 2016). Importantly, it was also determined that the emission factor of CO2 was 28% higher than the use of MGO.
2.4 Hydrogen
Hydrogen has been attracting attention across all energy sectors as a clean and flexible energy carrier with perceived zero GHG emissions (World Economic Forum, 2022). Hydrogen can be produced from hydrocarbon feedstocks via chemical processes (e. g., steam reforming of NG and coal gasification), and by using electricity to electrolyse water (Holladay et al., 2009; Navarro et al., 2007). "Renewable hydrogen" is produced using renewable energy or electricity sources that results in a decrease or zeroing of the GHG emissions (Barbir et al., 2016). At the other end of the supply chain, hydrogen can be consumed by diverse end-use applications including fuel cells and internal combustion engines (Ozawa et al., 2017).
Hydrogen combustion does not produce CO2 (or other greenhouse gases), CO, HCs, SOx, smoke, lead (or other toxic metals), sulphuric acid, ozone (or other oxidants), benzene (or other carcinogenic compounds), or formaldehydes (Masood et al., 2007). Instead, its main product of combustion is water (Bose and Maji, 2009). There can be, however emissions of CO, CO2 and HCs in exhaust gas because of the burning of lube oil and pilot fuel that is required for combustion (Bose and Maji, 2009). The only pollutant is NOx, which is due to high combustion temperature in hydrogen fuelled engines; the exhaust gas temperature for hydrogen enrichment is 505 ℃ at 80% load whereas that of diesel is 260 ℃ (Bose and Maji, 2009).
The application of hydrogen injection in internal combustion engines was proposed in the 1970s (Pan et al., 2014) and can be dated back two-hundred years (Cecil, 1822). Many studies have implemented the use of hydrogen as a fuel in SI engines (Haragopala Rao et al., 1983), but these studies illustrated issues with backfire and knocking problems at high loads due to the spontaneous combustion of hydrogen, as well as a substantial drop in power output (Pan et al., 2014). Nevertheless, the implementation of hydrogen in SI engines has demonstrated excellent energy conversion with extremely low harmful emissions (Verhelst et al., 2006; White et al., 2006). Because of hydrogen's high self-ignition temperature (576 ℃), it is not possible to use hydrogen directly in compression ignition (CI) engines as fuel (Bose and Maji, 2009), and an energy source is needed to provide ignition (Gomes Antunes et al., 2009). Combustion triggering devices such as installation of glow plugs in the combustion chamber has been used, but more widely investigated and implemented is the addition of a lower auto-ignition fuel to the combustion chamber (Bose and Maji, 2009). Hydrogen can be used in small energy share ratios for improving the engine's performance and provide reductions in carbon, smoke and NOx emissions, or can be used in high energy share ratios with the (diesel) fuel injected close to the engine's top dead centre to act as the combustion trigger (Dimitriou et al., 2018). Although work has been reported for cases with hydrogen energy share ratio to be less than 5% or even more than 95%, most demonstrations investigates the effects of hydrogen energy share ratios between 10 and 40% (Dimitriou et al., 2018).
A recent review of H2 supply in CI engines concludes that the use of H2 as an energy carrier provides significant reduction in HC, CO, CO2 and smoke in comparison to conventional fuels, but NOx formation was a significant issue (Dimitriou and Tsujimura, 2017). In one example, hydrogen fuel (0-98% energy share ratio) was tested at low and medium operating loads in a heavy-duty hydrogen-diesel dual-fuel engine (Dimitriou et al., 2018). At medium load (with a maximum of 85% H2 energy share ratio), the CO emission was reduced by up to 88%, the CO2emission was decreased by up to 84% (compared to diesel), the soot formation was up to 87% reduced, and the THC were at the same level (compared to diesel) for the dual-fuel operation. However, NOx emission increased four times higher than the conventional engine due to the high energy content of hydrogen fuel. Similar results were reported when the energy share of hydrogen co-combusted with diesel was changed in the range from 0 to 30% in a single-cylinder 4-stroke diesel dual-fuel engine (Jamrozik et al., 2020). The addition of up to 25% hydrogen to the CI engine resulted in an 85% reduction in soot emissions, 57% reduction in CO, and 27% reduction in CO2. The disadvantage of using hydrogen as a fuel for a CI engine was increase in HC emissions and a significant increase in NO emissions (by over 80%).
2.5 Ammonia
Towards meeting the IMO's goals, the use of ammonia as a shipping fuel is gaining significant interest because, like hydrogen, it is a carbon-free molecule and will not produce CO2 when combusted (Al-Aboosi et al., 2021; Hansson et al., 2020a). However, it is important to account for all of the emissions emitted during combustion, as other significant GHGs, such as N2O, are known to be emitted in the exhaust gas from the use of ammonia as a fuel (Zincir, 2022). Furthermore, the emissions associated with the use of pilot fuels, which are required for combustion as ammonia has a high resistance to autoignition, can produce CO2e emissions and need to be considered.
Although ammonia has been used in combustion engines since the second world war, there are a limited number of combustion tests (with emission data) published. Ammonia has rather poor ignition and combustion properties and an ignition fuel is needed for both CI engines (e.g., diesel oil, methanol or dimethyl ether (DME) (Gross and Kong, 2013; Pochet et al., 2017; Reiter and Kong, 2011, 2008) and SI engines (e.g., hydrogen or alcohols (Frigo and Gentili, 2013; Mørch et al., 2011)) (Hansson et al., 2020b; Rehbein et al., 2019). In the CI engine application it was found that the successful approach was to supply ammonia vapor to the air intake system and use diesel fuel to provide ignition energy (Pearsall and Garabedian, 1968). The other approach of directly injecting liquid ammonia into the cylinder without using diesel fuel was not successful even though the engine compression ratio was increased to 30∶1.
The available tests on combustion engines show issues with ammonia slip (Bro and Pedersen, 1977; Reiter and Kong, 2011), NOx (Frigo and Gentili, 2013; Gray et al., 1966; Gross and Kong, 2013; Mørch et al., 2011; Ryu et al., 2013) and N2O (Pochet et al., 2017) emissions and potentially emissions of CO and hydrocarbons (Gross and Kong, 2013; Ryu et al., 2013) (depending on pilot fuel). Ammonia that is released into the atmosphere can have health risks (if at high concentrations) and contributes to eutrophication. Emissions of N2O are of significant concern due to its high GWP. Recently, a case study of the environmental and economic effects of an ammonia-diesel dual-fuel marine engine onboard a general cargo ship has been reported (Zincir, 2022). There were three fuel options in the study: 100% MDO, 60% NH3/40% MDO, and 95% NH3/5% MDO (this fraction is the highest energy fraction for the stable combustion of the ammonia-diesel dual-fuel engines in the literature). It was reported that the SOx and PM emissions were decreased up to 95% by ammonia usage. The NOx emissions were 19.4% lower than MDO at 60% NH3 energy fraction but increased 133.1% at 95% NH3 energy fraction. Although it was reported that blue and solar green ammonia comply with IMO2030 CO2e reduction target of 40% and green ammonia (from wind energy) complies with IMO2050 CO2e reduction target of 70%, the full TtW emissions, including the N2O emissions and carbon-based emissions from the pilot fuel, were not taken into consideration. Importantly, the N2O emissions of the ammonia-fueled engines with 60% and 95% energy fractions were calculated as 1.55 g/kWh and 1.95 g/ kWh, respectively (calculated using values reported by Yousefi et al., 2022). The NOx and N2O emissions can likely be handled with after treatment systems (achieving Tier Ⅲ NOx values and near zero N2O values), either three-way catalyst (TWC) if the combustion is stoichiometric or Selective Catalytic Reduction/Exhaust Gas Recirculation (SCR/EGR) for lean combustion. However, the high fraction of the pilot fuel (specifically the emissions that result from the pilot fuel), the ammonia slip, and the N2O emissions are factors that need to be addressed (Hansson et al., 2020b).
3 Emissions discussion
The TtW combustion emissions (i. e., onboard emissions) for LPG, LNG, methanol, hydrogen, and ammonia are presented in Table 1 (gpollutant/kWh) and Table 2 (gpollutant/MJ); the emission factors for HFO and MGO are shown for comparison. The emissions of carbon dioxide (CO2), methane (CH4) and nitrous oxide (N2O) are used to calculate CO2e emissions as a metric to compare exhaust gas emissions based on their GWP on both a 20-year and 100-year perspective (Shine, 2009).
For LPG, the CO2emissions are 13% and 15% less than MGO and HFO, respectively, and with lower emissions of SOx and PM; NOx and CO remain similar to the conventional fuels. Although CO2emissions for LNG are reduced by 25% when compared to HFO, including the conservative value of 3 g/kWh of methane slip (reflecting the most common LNG engines of Otto-SS and MS, in which LNG-Otto-SS = 2.5 – 3.5 g/kWh and LNG-Otto-MS = 5.5 – 6.5 g/kWh) detract from the CO2e reduction potential of the fuel; lower values of SOx, NOx, and PM are still advantageous for LNG. Methanol has little advantage over HFO/MGO other than lower SOx and PM values, but the higher CO2 and CH4 emissions nullify any CO2e reduction potential. The emission factors reported for hydrogen considers an 85% H2 energy share with diesel in an inline-4 heavy-duty hydrogen (port injection)-diesel (direct injection) dual-fuel engine (Dimitriou et al., 2018). The benefits of hydrogen are clear (83% CO2e reduction), with reduction or removal of most pollutants, other than CO2 (from the pilot fuel) and high NOx emissions. Similar to hydrogen, the emissions factors reported for ammonia considers a 95% NH3/ 5% MDO energy share (Zincir, 2022). Although the CO2 reduction in comparison to HFO/MGO is 80%, including the N2O emissions surpasses the CO2e emissions for HFO/MDO; the high NOx and HC emissions are also of concern. The TtW combustion emission factors for all considered fuels are combined with WtT emissions to provide a LCA summary of the alternative fuels (Table 3).
Considered on a lifecycle perspective, LPG production is associated with lower emissions than oil-based fuels. The combination of low production and combustion emissions yields an overall GHG emissions reduction of 17.2% compared to HFO or MGO (consistent with Nikolaou et al., 2017). For LNG, by including a conservative estimate of methane slip in the TtW emissions, the overall GHG emissions reduction is only 8.8% compared to HFO or MGO. Methanol, overall, has higher GHG emissions (13.6%) than the conventional fuels. If hydrogen is produced from a renewable source (hydro, wind or solar), the WtW GHG emission can be reduced by 79.9%; (Bicer and Dincer, 2018) reported a 40% decrease in GHG emissions per tonne-kilometre when hydrogen was used as dual fuel with heavy fuel oils (50%). Unfortunately, if hydrogen is produced from natural gas, as is common practice today, the use of hydrogen as a marine fuel contributes to 96.2% more GHG emissions than the use of conventional fuels. An interesting trend is calculated for ammonia: even if ammonia is produced from a renewable source (green ammonia), the use of ammonia can reduce GHG emissions by 71% if N2O emissions are completely removed nearing the advantages of hydrogen, otherwise will contribute to 13.1% GHG emissions; (Bicer and Dincer, 2018) reported a 30% decrease in GHG emissions per tonne-kilometre when ammonia was used as dual fuel with heavy fuel oils (50%). If ammonia is produced from natural gas (brown ammonia), the WtW GHG emissions increase by 140.0% including N2O emissions and 55.9% without including N2O emissions; note that although the production of blue ammonia (produced from fossil sources with carbon capture) results in 85% less CO2emissions than brown variants, only green ammonia can provide the up to 71% GHG emission reduction and is a zero-carbon fuel (Brinks and Chryssakis, 2022).
4 Challenges and barriers to uptake
Table 4 identifies seven key challenges in the uptake of alternative fuels identified above for shipping.
Table 4 Key challenges for the uptake of alternative fuels for shippingCategory LNG LPG Ammonia Methanol Hydrogen Retrofit Cost (LR1) (in $m)1 26.5 18.5 20 15 Unknown Engine Availability Yes Yes 2024 Yes 2030+ Technology Maturity Mature Mature Immature Immature Immature Fuel Price ($/mt)2 1 200 590 Natural Gas: 770
Renewable: 700Grey: 470
Green: 650Natural Gas: 2 000
Renewable: 3 500 – 7000Bunkering and Tank Infrastructure Existing Only LPG carriers use cargo for fuel Not established (ability to piggyback on LPG infrastructure) Not established (technically feasible to piggyback on liquid infrastructure) Not established Tank Capacity3 1.6× 1.5× 3.1× 2.3× 4.2× Safety and Handling Considerations Liquefaction @ -160 ℃ Liquefaction @ -33 ℃ Liquefaction @ -33 ℃(safety Ignition fuel required) Liquid at ambient temp and pressure; inert nitrogen gas needed requires very clean tanks as it is colorless 4.2× Liquefaction @ −253 ℃ Notes:
1Retrofit costs are based on American Bureau of Shipping (ABS) MarE-fuel study, link: https://orbit.dtu.dk/en/projects/electro-fuels-for-long-range-maritime-transport
2Prices for green methanol, green ammonia and green hydrogen are based on Trafigura market analysis and project reviews. All prices used in this table are indicative (https://www.methanol.org/wp-content/uploads/2020/04/Nitrogen-Blanketing-for-Ships.pdf). Pricing assumptions: Natural Gas and Renewable – determine feedstocks used in the process, agnostic of technology (SMR, ATR, Alkaline, PEM…); LNG Singapore cal 2023; LPG Singapore cal 2023; Methanol – grey spot Singapore and green is based on production cost modelling; Ammonia Far East cal 2023 is 700 vs. USG is 240 for cal 2023 (green based on production cost modelling); Hydrogen – grey USG today, green based on production cost modelling
3Tank Capacity is based on low heating values in MJ/L vs. VLSF – share values4.1 Retrofit cost
In order to maintain comparability across all fuels, one category of vessels is presented: LR1 tankers. The retrofit costs are based on the American Bureau of Shipping's (ABS) MarE-fuel study, published in late 2021.
On the higher end, LNG's retrofit cost of $26.5 million compares to a less costly retrofit for a methanol operation at $15 million. Both LPG and ammonia have similar retrofit costs with $18.5 million and $20 million, respectively. A hydrogen retrofit cost is not included as none have been identified for this vessel type.
4.2 Engine availability
Engine technologies for LNG, LPG and methanol are readily available today. Methanol engines today are developed by MAN and WinGD's engine is expected to be available from 2024. The first ammonia engine will be ready end of 2024 (developed by MAN Energy Solutions). WinGD and Wartsila are also working on ammonia engines to be delivered in 2025. For hydrogen, it is estimated that the first engines for this vessel type will only be available beyond 2030. It is also worth noting that engine manufacturers, such as MAN, have developed innovative dual-fuel two-stroke engines that can run on LNG, LPG, ethane and methanol nearly interchangeably (Anner, 2022); fuel-agnostic engine platforms, which offer different versions of the same base engine with unique cylinder heads designed to accommodate a different low or zero carbon fuel, are also being pursued in addition to fuel flexible engines that can run on multiple fuels (White, 2022). Existing optimizations of diesel engines (Altosole et al., 2017; Tadros et al., 2019) and application of established aftertreatment exhaust systems (Lu et al., 2022) can be applied to future engine developments using alternative fuels to provide the most sustainable engine technologies (Trivyza et al., 2022).
4.3 Technology maturity
Both LNG and LPG use mature technology, with approximately 1, 050 LNG and 37 LPG vessels in operation today (according to Clarkson's research). Conversely, methanol has not been deployed to the same scale with only 16 vessels deployed and 23 on order. Both ammonia and hydrogen have the lowest technology maturity at this stage compared to the other alternative fuels.
4.4 Fuel price
Price visibility is a key challenge for the renewable fuels. Fuels such as ammonia, methanol and hydrogen are not as readily traded as their counterparts. As much as possible the fuels are priced based on the same delivery location in Singapore. In addition, their renewable production pathway is not readily priced, heavily depending on current project development. As a result, renewable pathways are priced based on production cost in this analysis. These prices should only serve as indicative for the purpose of this comparative exercise.
Fuel prices (June 2022) are presented in $/1 000 MJ to compare fuel prices adjusted for energy density and can be parallelly compared to prices in $/mt (Table 5).
Using Very Low Sulphur Fuel (VLSF) oil as a reference to compare against alternative fuels, LPG is more cost-effective than VLSF based on equal energy density. Meanwhile, LNG and ammonia are expected to be approximately 50% and 150% more expensive than VLSF, respectively. Methanol would be similar to LNG, ranging from 50% to 100% more expensive than VLSF. Hydrogen's cost compared to VLSF depends on its feedstock, with it being competitive if produced from gas or 80% to 260% more expensive otherwise.
4.5 Bunkering and tank infrastructure
In terms of ease of adoption, LNG is the most broadly used and possesses existing global bunkering and infrastructure. LPG is almost wholly used on LPG carriers only. Today there is very limited (if any) bunkering and infrastructure for methanol, ammonia, and hydrogen. Methanol can technically use existing liquid infrastructure whereas ammonia can "piggyback" on LPG infrastructure. Today both methanol and ammonia are waterborne traded. Ammonia traded volumes are approximately 20 million tonnes per annum and are even larger for methanol, both with existing handling and safety considerations in use today which will need to be transposed to the bunkering industry.
4.6 Tank capacity
Tank capacity was used as a measure for space requirements on board. The size of the tanks directly affects the ease of retrofitting and, consequently, the adoption of the fuel. In comparison to VLSFO (the base case for comparison here), LNG and LPG require approximately 60% and 50% more tank space, respectively. Methanol, with a 130% increase in tank capacity, can also be more readily adopted. Ammonia requires a 210% increase in tank space and may require space optimization. Hydrogen poses the greatest challenge, requiring a 320% increase in tank space, making it particularly challenging to adopt in deep-sea shipping.
4.7 Safety and handling considerations
Lastly, each fuel presents their own handling and safety considerations, making it more (or less) straightforward to adopt them. LNG, LPG, ammonia, and hydrogen all require liquefaction, with ammonia and LPG at a required temperature of –33 ℃, needing the least amount of energy and isolation in the infrastructure. LNG, at a required temperature of –153 ℃, requires entirely dedicated and costly infrastructure whereas hydrogen, at – 253 ℃, a temperature close to absolute zero, will also need dedicated and expensive infrastructure. All liquefaction comes at an energy cost, in line with the temperature required. Hydrogen and LNG will require the most energy to liquefy, with hydrogen liquefaction consuming up to 30% of the energy contained in the hydrogen. Methanol is liquid at atmospheric conditions however requires very clean tanks to avoid contamination. In addition, methanol requires inert gas, such as nitrogen, to be used during loading and discharge to prevent an explosive air mixture in the cargo tanks. Finally, ammonia does not easily ignite and hence requires a low autoignition temperature fuel such as diesel or even hydrogen to be injected in the engine. This entails availability of these fuels on board and dedicated tanks.
Table 5 Alternative marine fuel prices in $/mt and $/1000 MJ (June 2022)Marine Fuel Price VLSF LNG LPG Ammonia Methanol Hydrogen Fuel price ($/mt) 700 1 200 590 Natural Gas: 770
Renewable: 700Natural Gas: 470
Renewable: 650Natural Gas: 2, 000
Renewable: 3 500–7000Fuel price ($/1 000 MJ) 16.4 24 12.8 Natural Gas: 41.4
Renewable: 37.6Natural Gas: 23.6
Renewable: 32.7Natural Gas: 16.7
Renewable: 29.2–8.35 Conclusions
Adopting energy carriers (fuels) with lower or zero GHG footprint is a promising route for shipping to cut carbon emissions. Implementing renewably sourced zero carbon fuels, such as hydrogen and ammonia, is the most promising, and perhaps the only, option to deliver the desired GHG reductions for the maritime industry (Lindstad et al., 2021); although not the focus of this review, it must be noted that the upstream WtT emissions across all fuels can vary widely (European Parliament, Council of the European Union, 2018). Hydrogen produced from renewable sources can achieve a WtW GHG emission reduction of 79.9% compared to conventional fuels. Similarly, ammonia produced from renewable sources (green ammonia) can also achieve a 71.0% GHG emission reduction.
However, these GHG emission reductions are only achievable under the "cleanest" conditions. If hydrogen is produced from NG and used in the shipping industry as a fuel, the WtW GHG emissions will contribute to 96.2% more GHG emissions compared to conventional fuels. Furthermore, if uncombusted hydrogen is released as a slip, it would amplify the GHG emissions as hydrogen has a GWP100 of 11±5 (Warwick et al., 2022). Similarly, if ammonia is produced from NG and the current N2O emissions are not abated, the use of ammonia as a fuel will result in a WtW GHG emissions increase of 140.0%.
Equally as important to considering these LCA emissions is the barriers to overcome to implement ammonia and hydrogen across the worldwide fleet: technical maturity, tank capacity and bunkering infrastructure are some of the key hurdles to overcome to realize a net-zero shipping future.
Competing interestThe authors have no competing interests to declare that are relevant to the content of this article.Open Access This article is licensed under a Creative Commons Attribution 4.0 International License, which permits use, sharing, adaptation, distribution and reproduction in any medium or format, as long as you give appropriate credit to the original author (s) and the source, provide a link to the Creative Commons licence, and indicate if changes were made. The images or other third party material in this article are included in the article's Creative Commons licence, unless indicated otherwise in a credit line to the material. If material is not included in the article's Creative Commons licence and your intended use is not permitted by statutory regulation or exceeds the permitted use, you will need to obtain permission directly from the copyright holder. To view a copy of this licence, visit http://creativecommons.org/licenses/by/4.0/. -
Figure 1 Uptake of alternative fuels for the world fleet (June 2021) (adapted from DNV, 2021)
Table 1 Tank-to-Wake (TtW) combustion emissions by fuel (gpollutant/kWh)
Pollutant HFO MGO LPG LNG Methanol Hydrogen24 Ammonia25 CO2 5616 54511 47516 41819 69523 9024 11326 CH4 1.08 × 10⁻², 7 1.02 × 10⁻², 12 1.00 × 10⁻², 17 3.0020 2 × 10⁻², 23 - - N2O 3.06 × 10⁻², 8 3.06 × 10⁻², 13 3.00 × 10⁻², 17 2.13 × 10⁻², 21 - - 1.9526 SO21 2.009 0.3214 0.6010 3.00 × 10⁻², 14 - - 0.1026 NOx2 14.410 14.414 12.910 1.1714 6.523 4.024 28.226 NH3 2.17 × 10⁻³, 9 2.17 × 10⁻³, 9 - - - - 1027 PMTotal 0.679 0.1614 0.2018 0.02714 0.09323 0.01524 0.03526 NMVOC3 0.419 0.4315 0.6810 0.3822 1.623 0.3024 2027 CO 0.949 0.7315 1.2118 1.8622 3.723 0.1124 5027 CO2e (100 year)4 569 554 484 513 696 90 646 CO2e (20 year)5 569 554 484 671 697 90 628 Notes:
1According to Annex VI of the International Convention for the Prevention of Pollution from Ships (MARPOL), the SO2 emitted from HFO considers the limits of sulphur in the fuel oil used on board ships operating outside designated emission control areas to 0.50% m/m
2Pollutant abatement systems (e.g., SCR) not included
3Non-methane volatile organic compounds
4CO2e (100 year) [g/kWh] = (CO2 (g/kWh) * 1 (GWPCO2)) + (CH4 (g/kWh) * 29.8 (GWPCH4)) + (N2O (g/kWh) * 273(GWPN2O)
5CO2e (20 year) [g/kWh] = (CO2 (g/kWh) * 1 (GWPCO2)) + (CH4 (g/kWh) * 82.5 (GWPCH4)) + (N2O (g/kWh) * 264 (GWPN2O)
6Source: Calculated from (Comer, 2021): TtW (g/kWh) = TtW (g/gfuel) * SFC (g/kWh), consistent with (Lindstad et al., 2021): TtW (g/kWh) = 558
7Source: Calculated (TtW (g/kWh) = TtW (g/gfuel) * SFC (g/kWh)) and reported from (Comer, 2021)
8Source: Calculated (TtW (g/kWh) = TtW (g/gfuel) * SFC (g/kWh)) and reported from (Comer, 2021)
9Source: Calculated from TtW(g/MJ) reported from (Brynolf et al., 2014a)
10Source: (Kristenen, 2015)
11Source: Calculated from (Comer, 2021): TtW (g/kWh) = TtW (g/gfuel) * SFC (g/kWh), consistent with (Lindstad et al., 2021): TtW (g/kWh) = 541
12Source: Calculated (TtW (g/kWh) = TtW (g/gfuel) * SFC (g/kWh)) and reported from (Comer, 2021); consistent with (Gilbert et al., 2018):
TtW (g/kWh) = 1.00 × 10⁻²
13Source: Calculated (TtW (g/kWh) = TtW (g/gfuel) * SFC (g/kWh)) and reported from (Comer, 2021); consistent with (Gilbert et al., 2018):
TtW (g/kWh) = 2.60 × 10⁻²
14Source: (Faber et al., 2020; Gilbert et al., 2018)
15Source: Calculated from TtW(g/MJ) reported from (S. Brynolf et al., 2014)
16Source: (Lindstad et al., 2021)
17Extraplotated from (Lindstad et al., 2021) and consistent with (Comer, 2021)
18Calculated from (Wagemakers and Leermakers, 2012)
19Source: Calculated from (Comer, 2021): TtW (g/kWh) = TtW (g/gfuel) * SFC (g/kWh), consistent with (Gilbert et al., 2018): TtW (g/kWh) =
412, and with (Lindstad et al., 2021): TtW (g/kWh) = 404
20Conservative report of most common LNG engines (Otto-SS and MS) calculated (TtW (g/kWh) = TtW (g/gfuel) * SFC (g/kWh)) and reported from (Comer, 2021): LNG-Diesel = 0.2 g/kWh; LNG-Otto-SS = 2.5 – 3.5g/kWh, LNG-Otto-MS = 5.5 – 6.5g/kWh; consistent with (Winnes et al., 2020)
21Source: Calculated (TtW (g/kWh) = TtW (g/gfuel) * SFC (g/kWh)) and reported from (Comer, 2021); consistent with (Gilbert et al., 2018) :
TtW (g/kWh) = 1.60 × 10⁻²
22Source: (Winnes et al., 2020)
23Source: (Fridell et al., 2021) at 80% engine load
2485% H2 energy share with diesel in an inline-4 heavy-duty hydrogen (port injection)-diesel (direct injection) dual-fuel engine (Dimitriou et al., 2018); consistent with (Lilik et al., 2010) and (Dimitriou et al., 2018)
2595% NH3/ 5% MDO energy share (Zincir, 2022)
26Source: (Zincir, 2022)
26Source: (Hansson et al., 2020b)Table 2 Tank-to-Wake (TtW) combustion emissions by fuel (gpollutant/MJ)1
Pollutant HFO MGO LPG LNG Methanol Hydrogen Ammonia LCV2 (MJ/kg) 40.26 42.76 46.311 486 19.96 12015 18.617 SFC3 (g/kWh) 1807 1707 15512 1527 44114 5716 38818 CO2 77.5 75.1 66.2 57.3 79.2 13.1 15.7 CH4 1.49 × 10⁻³ 1.41 × 10⁻³ 1.39 × 10⁻³ 0.41 2.28 × 10⁻³ - - N2O 4.23 × 10⁻³ 4.22 × 10⁻³ 4.18 × 10⁻³ 2.92 × 10⁻³ - - 0.27 SO2 0.288 4.41 × 10⁻² 8.36 × 10⁻² 4.11 × 10⁻⁴ - - - NOx 1.99 2.04 1.80 0.16 0.74 0.58 3.91 NH3 3.00 × 10⁻⁴, 8 3.00 × 10⁻⁴, 8 - - - - 1.39 PMTotal 9.3 × 10⁻², 8 2.20 × 10⁻² 2.79 × 10⁻² 3.70 × 10⁻³ 1.06 × 10⁻² 2.19 × 10⁻³ - NMVOC 0.0568 0.05910 9.48 × 10⁻² 5.21 × 10⁻² 0.2 4.39 × 10⁻² 2.8 CO 0.138 0.110 0.17 0.25 0.52 1.65 × 10⁻² 6.9 CO2e(100 year)4 78.79 76.39 67.413 70.3 79.3 13.1 89.5 CO2e (20 year)5 78.7 76.3 67.4 92.0 79.4 13.1 87.0 Notes:
1All combustion emission values (g/MJ) calculated (unless indicated as reported) from values reported in Table 1 (TtW combustion emissions by fuel (g/kWh)), whereby:
$ \frac{g_{\text {pollutant }}}{\mathrm{MJ}}=\frac{g_{\text {pollutant }}}{\mathrm{kWh}_{\text {engine output }}} \times \text { engine efficiency } \times \frac{\mathrm{kWh}_{\text {delivered to engine }}}{3.6 \mathrm{MJ}}=\frac{g_{\text {pollutant }}}{\mathrm{kWh}_{\text {engine output }}} \times \frac{\mathrm{kWh}_{\text {engine output }}}{\mathrm{g}_{\text {fuel }}} \times \frac{\mathrm{g}_{\text {fuel }}}{\mathrm{MJ}}$
2Lower Calorific Value
3Specific Fuel Consumption
4CO2e (100 year) [g/MJ] = (CO2 (g/MJ) * 1 (GWPCO2)) + (CH4 (g/MJ) * 29.8 (GWPCH4)) + (N2O (g/MJ) * 273 (GWPN2O)
5CO2e (20 year) [g/MJ] = (CO2 (g/MJ) * 1 (GWPCO2)) + (CH4 (g/MJ) * 82.5 (GWPCH4)) + (N2O (g/MJ) * 264 (GWP N2O)
6Source: (Faber et al., 2020; Lindstad et al., 2021)
7Source: (Comer, 2021; Faber et al., 2020)
8Source: (Brynolf et al., 2014a)
9Consistent with (Al-Aboosi et al., 2021; Pavlenko, 2020)
10Source: Reported from (Brynolf et al., 2014b)
11Source: ("Resolution MEPC.281(70) – Amendments to the 2014 Guidelines on the Method of Calculation of the Attained Energy Efficiency Design Index (EEDI) For New Ships (Resolution MEPC.245(66), as Amended by Resolution MEPC.263(68))-(Adopted on 28 October 2016)," 2016)
12Source: ("MAN B&W ME-LGIP, " 2020)
13Consistent with (Nikolaou et al., 2017)
14Source: (Fridell et al., 2021)
15Source: (Gilbert et al., 2018; Lindstad et al., 2021)
16Source: (Gilbert et al., 2018)
17Source: (Herdzik, 2021; Lindstad et al., 2021)
18Source: (Zincir, 2022)Table 3 Emission factors (WtT, TtW and WtW) of different shipping fuels (g CO2e/MJ of fuel) and comparison to HFO/MGO (conventional shipping fuels) (GWP100)
Supply chain HFO MGO LPG LNG NG Methanol NG Hydrogen Ammonia Renewable NG Renewable NG Well-to-Tank (WtT) 9.01 12.82 7.23 9.74 20.45 4.56 1597 9.78 12110 WtT Difference to HFO - +42.2% -20.6% +7.6% +126.7% -50.0% 1 667.7% +7.8% 1 244.4% Tank-to-Wake(TtW) 78.7 75.0 65.5 70.3 79.3 13.1 13.1 15.7 – 89.59 15.7 – 89.59 TtW Difference to HFO - -4.7% -16.8% -10.7% 0.71% -83.4% -83.4% -80.0% – +13.7% -80.0% – +13.7% Well-to-Wake (WtW) 87.7 87.8 72.7 80.0 99.7 17.6 172.1 25.4 – 99.2 25.4 – 210.5 WtW Difference to HFO - +0.1% -17.2% -8.8% +13.6% -79.9% +96.2% -71.0%–+13.1% +55.9%–+140.0% Notes:
1Source: (Al-Aboosi et al., 2021) = 9.0; (Nikolaou et al., 2017) = 9.8; (Comer, 2021) = 10.8
2Source: (Al-Aboosi et al., 2021) = 12.8; (Nikolaou et al., 2017) = 12.7; (Comer, 2021) = 13.6
3Source: (Nikolaou et al., 2017)
4Source: (Comer, 2021); consistent with (Brynolf et al., 2014a) = 9.3
5Source: (Brynolf et al., 2014a)
6Source: (Ozawa et al., 2017)
7Source: Calculated from (Lindstad et al., 2021): WtT (g/kWh) = 1 086; consistent with (Ozawa et al., 2017)
8Source: (Al-Aboosi et al., 2021); consistent with (Lindstad et al., 2021)
9Range reported for 0 g/kWh and 1.95 g/kWh (Table 1) N2O emissions, respectively
10Source: Calculated from (Lindstad et al., 2021): WtT (g/kWh) = 874; consistent with (Al-Aboosi et al., 2021)Table 4 Key challenges for the uptake of alternative fuels for shipping
Category LNG LPG Ammonia Methanol Hydrogen Retrofit Cost (LR1) (in $m)1 26.5 18.5 20 15 Unknown Engine Availability Yes Yes 2024 Yes 2030+ Technology Maturity Mature Mature Immature Immature Immature Fuel Price ($/mt)2 1 200 590 Natural Gas: 770
Renewable: 700Grey: 470
Green: 650Natural Gas: 2 000
Renewable: 3 500 – 7000Bunkering and Tank Infrastructure Existing Only LPG carriers use cargo for fuel Not established (ability to piggyback on LPG infrastructure) Not established (technically feasible to piggyback on liquid infrastructure) Not established Tank Capacity3 1.6× 1.5× 3.1× 2.3× 4.2× Safety and Handling Considerations Liquefaction @ -160 ℃ Liquefaction @ -33 ℃ Liquefaction @ -33 ℃(safety Ignition fuel required) Liquid at ambient temp and pressure; inert nitrogen gas needed requires very clean tanks as it is colorless 4.2× Liquefaction @ −253 ℃ Notes:
1Retrofit costs are based on American Bureau of Shipping (ABS) MarE-fuel study, link: https://orbit.dtu.dk/en/projects/electro-fuels-for-long-range-maritime-transport
2Prices for green methanol, green ammonia and green hydrogen are based on Trafigura market analysis and project reviews. All prices used in this table are indicative (https://www.methanol.org/wp-content/uploads/2020/04/Nitrogen-Blanketing-for-Ships.pdf). Pricing assumptions: Natural Gas and Renewable – determine feedstocks used in the process, agnostic of technology (SMR, ATR, Alkaline, PEM…); LNG Singapore cal 2023; LPG Singapore cal 2023; Methanol – grey spot Singapore and green is based on production cost modelling; Ammonia Far East cal 2023 is 700 vs. USG is 240 for cal 2023 (green based on production cost modelling); Hydrogen – grey USG today, green based on production cost modelling
3Tank Capacity is based on low heating values in MJ/L vs. VLSF – share valuesTable 5 Alternative marine fuel prices in $/mt and $/1000 MJ (June 2022)
Marine Fuel Price VLSF LNG LPG Ammonia Methanol Hydrogen Fuel price ($/mt) 700 1 200 590 Natural Gas: 770
Renewable: 700Natural Gas: 470
Renewable: 650Natural Gas: 2, 000
Renewable: 3 500–7000Fuel price ($/1 000 MJ) 16.4 24 12.8 Natural Gas: 41.4
Renewable: 37.6Natural Gas: 23.6
Renewable: 32.7Natural Gas: 16.7
Renewable: 29.2–8.3 -
Al-Aboosi FY, El-Halwagi MM, Moore M, Nielsen RB (2021) Renewable ammonia as an alternative fuel for the shipping industry. Current Opinion in Chemical Engineering 31, 100670. https://doi.org/10.1016/j.coche.2021.100670 Altosole M, Benvenuto G, Campora U, Laviola M, Zaccone R (2017) Simulation and performance comparison between diesel and natural gas engines for marine applications. Proceedings of the Institution of Mechanical Engineers, Part M: Journal of Engineering for the Maritime Environment 231, 690-704. https://doi.org/10.1177/1475090217690964 Anner N (2022) Making the maritime energy transition [WWW Document]. MAN Energy Solutions. URL https://www.man-es.com/discover/making-the-maritime-energy-transition [accessed 8.3.22] Barbir F, Basile A, Veziroǧlu TN (2016) Compendium of Hydrogen Energy. Woodhead Publishing Bicer Y, Dincer I (2018) Clean fuel options with hydrogen for sea transportation: A life cycle approach. International Journal of Hydrogen Energy 43, 1179-1193. https://doi.org/10.1016/j.ijhydene.2017.10.157 Bose PK, Maji D (2009) An experimental investigation on engine performance and emissions of a single cylinder diesel engine using hydrogen as inducted fuel and diesel as injected fuel with exhaust gas recirculation. International Journal of Hydrogen Energy, 2nd International Workshop on Hydrogen 34: 4847-4854. https://doi.org/10.1016/j.ijhydene.2008.10.077 Bouman EA, Lindstad E, Rialland AI, Stromman AH (2017) State-of-the-art technologies, measures, and potential for reducing GHG emissions from shipping-A review. Transportation Research Part D: Transport and Environment 52: 408-421. https://doi.org/10.1016/j.trd.2017.03.022 BP (2021) Energy Outlook 2020 Edition. https://www.bp.com/content/dam/bp/business-sites/en/global/corporate/pdfs/energy-economics/energy-outlook/bp-energy-outlook-2020.pdf Brinks H, Chryssakis C (2022) Harnessing ammonia as ship fuel - DNV DNV GL. https://www.dnv.com/expert-story/DigitalMagazineDefault [accessed 8.3.22] Bro K, Pedersen PS (1977) Alternative diesel engine fuels: an experimental investigation of methanol, ethanol, methane and ammonia in a D.I. diesel engine with pilot injection (SAE Technical Paper No. 770794). SAE International, Warrendale, PA. https://doi.org/10.4271/770794 Brynolf S, Fridell E, Andersson K (2014a) Environmental assessment of marine fuels: liquefied natural gas, liquefied biogas, methanol and bio-methanol. Journal of Cleaner Production 74: 86-95. https://doi.org/10.1016/j.jclepro.2014.03.052 Brynolf S, Magnusson M, Fridell E, Andersson K (2014b) Compliance possibilities for the future ECA regulations through the use of abatement technologies or change of fuels. Transportation Research Part D: Transport and Environment, Emission Control Areas and their Impact on Maritime Transport 28: 6-18. https://doi.org/10.1016/j.trd.2013.12.001 Buhaug Ø, Corbett Endresen Ø, Eyring V, Faber J, Hanayama S, Lee DS, Lee D, Lindstad H, Markowska AZ, Mjelde A, Nelissen D, Nilsen J, Pålsson C, Winebrake JJ, Wu W-Q, Yoshida K (2009) Second IMO GHG study 2009 [WWW Document]. http://www.imo.org/ (accessed 4.20.22) Burel F, Taccani R, Zuliani N (2013) Improving sustainability of maritime transport through utilization of Liquefied Natural Gas (LNG) for propulsion. Energy 57: 412-420. https://doi.org/10.1016/j.energy.2013.05.002 Bush D (2022) More countries back net-zero target at IMO [WWW Document]. Lloyd's List. URL https://lloydslist.maritimeintelligence.informa.com/LL1141205/More-countries-back-net-zero-target-at-IMO. [accessed 6.14.22] Cecil W (1822) On the application of hydrogen gas to produce a moving power in machinery; with a description of an engine which is moved by the pressure of the atmosphere, upon a vacuum caused by explosions of hydrogen and atmospheric air. Trans. Cambridge Philos. Soc 1, 217 Comer B (2021) Accounting for well-to-wake carbon dioxide equivalent emissions in maritime transportation climate policies. International Council on Clean Transportation. URL https://theicct.org/publication/accounting-for-well-to-wake-carbon-dioxide-equivalent-emissions-in-maritime-transportation-climate-policies/ [accessed 4.20.22] Cooper D, Gustafsson T (2004) Methodology for calculating emissions from ships: 1. Update of emission factors Dimitriou P, Kumar M, Tsujimura T, Suzuki Y (2018) Combustion and emission characteristics of a hydrogen-diesel dual-fuel engine. International Journal of Hydrogen Energy 43: 13605-13617. https://doi.org/10.1016/j.ijhydene.2018.05.062 Dimitriou P, Tsujimura T (2017) A review of hydrogen as a compression ignition engine fuel. International Journal of Hydrogen Energy 42: 24470-24486. https://doi.org/10.1016/j.ijhydene.2017.07.232 DNV (2021) Maritime forecast to 2050 [WWW Document]. https://eto.dnv.com/2021/maritime-forecast-2050/about (accessed 4.20.22) European Parliament, Council of the European Union (2018) Directive (EU) 2018/2001 of the European Parliament and of the Council of 11 December 2018 on the promotion of the use of energy from renewable sources. Official Journal of the European Union. https://eu-lex.euopa.eu/legal-content/EN/ALL/?uri=CELEX:32018L2001 Faber J, Hanayama S, Zhang S, Pereda P, Comer B, Hauerhof E, van der Loeff WS, Smith T, Zhang Y, Kosaka HK, Adachi M, Bonello J-M, Galbraith C, Gong Z, Hirata K, Hummels D, Kleijn A, Lee DS, Liu Y, Lucchesi A, Mao X, Muraoka E, Osipova L, Qian H, Rutherford D, Suárez de la Fuente S, Yuan H, Perico CV, Wu L, Sun D, Yoo D-H, Xing H (2020) Fourth Greenhouse Gas Study 2020-Final Report, International Maritime Organization (IMO). London, UK Fridell E, Salberg H, Salo K (2021) Measurements of Emissions to Air from a Marine Engine Fueled by Methanol. J. Marine. Sci. Appl. 20: 138-143. https://doi.org/10.1007/s11804-020-00150-6 Fridell E, Salo K (2016) Measurements of abatement of particles and exhaust gases in a marine gas scrubber. Proceedings of the Institution of Mechanical Engineers, Part M: Journal of Engineering for the Maritime Environment 230: 154-162. https://doi.org/10.1177/1475090214543716 Frigo S, Gentili R (2013) Analysis of the behaviour of a 4-stroke Si engine fuelled with ammonia and hydrogen. International Journal of Hydrogen Energy, 2011 Zing International Hydrogen and Fuel Cells Conference: from Nanomaterials to Demonstrators 38: 1607-1615. https://doi.org/10.1016/j.ijhydene.2012.10.114 Gilbert P, Walsh C, Traut M, Kesieme U, Pazouki K, Murphy A (2018) Assessment of full life-cycle air emissions of alternative shipping fuels. Journal of Cleaner Production 172: 855-866. https://doi.org/10.1016/j.jclepro.2017.10.165 Gomes Antunes JM, Mikalsen R, Roskilly AP (2009) An experimental study of a direct injection compression ignition hydrogen engine. International Journal of Hydrogen Energy 34: 6516-6522. https://doi.org/10.1016/j.ijhydene.2009.05.142 Gray JT, Dimitroff E, Meckel NT, Quillian RD (1966) Ammonia fuel-engine compatibility and combustion (SAE Technical Paper No. 660156). SAE International, Warrendale, PA. https://doi.org/10.4271/660156 Gross CW, Kong S-C (2013) Performance characteristics of a compression-ignition engine using direct-injection ammonia-DME mixtures. Fuel 103: 1069-1079. https://doi.org/10.1016/j.fuel.2012.08.026 Hansson J, Brynolf S, Fridell E, Lehtveer M (2020a) The potential role of ammonia as marine fuel—based on energy systems modeling and multi-criteria decision analysis. Sustainability 12: 3265. https://doi.org/10.3390/su12083265 Hansson J, Fridell E, Brynolf S (2020b) On the potential of ammonia as fuel for shipping: a synthesis of knowledge. Lighthouse Haragopala Rao B, Shrivastava KN, Bhakta HN (1983) Hydrogen for dual fuel engine operation. International Journal of Hydrogen Energy 8: 381-384. https://doi.org/10.1016/0360-3199(83)90054-X Hauschild MZ, Goedkoop M, Guinée J, Heijungs R, Huijbregts M, Jolliet O, Margni M, De Schryver A, Humbert S, Laurent A, Sala S, Pant R (2013) Identifying best existing practice for characterization modeling in life cycle impact assessment. Int J Life Cycle Assess 18: 683-697. https://doi.org/10.1007/s11367-012-0489-5 Herdzik J (2021) Decarbonization of marine fuels—the future of shipping. Energies 14: 4311. https://doi.org/10.3390/en14144311 Holladay JD, Hu J, King DL, Wang Y (2009) An overview of hydrogen production technologies. Catalysis Today 139(4): 244-260. https://doi.org/10.1016/j.cattod.2008.08.039 IMO (2018) Adoption of the initial IMO strategy on reduction of GHG emissions from ships and existing IMO activity related to reducing GHG emissions in the shipping sector. London, UK IPCC (2022) Climate Change 2022: Impacts, Adaptation, and Vulnerability. Contribution of Working Group II to the Sixth Assessment Report of the Intergovernmental Panel on Climate Change [H. -O. Pörtner, D.C. Roberts, M. Tignor, E.S. Poloczanska, K. Mintenbeck, A. Alegría, M. Craig, S. Langsdorf, S. Löschke, V. Möller, A. Okem, B. Rama (eds.)]. Cambridge University Press. Cambridge University Press, Cambridge, UK and New York, NY, USA, 3056 pp., doi: https://doi.org/10.1017/9781009325844 Jamrozik A, Grab-Rogaliński K, Tutak W (2020) Hydrogen effects on combustion stability, performance and emission of diesel engine. International Journal of Hydrogen Energy 45: 19936-19947. https://doi.org/10.1016/j.ijhydene.2020.05.049 Kristenen HO (2015) Energy demand and exhaust gas emissions of marine engines. Lilik GK, Zhang H, Herreros JM, Haworth DC, Boehman AL (2010) Hydrogen assisted diesel combustion. International Journal of Hydrogen Energy 35: 4382-4398. https://doi.org/10.1016/j.ijhydene.2010.01.105 Lindstad E (2019) Increased use of LNG might not reduce maritime GHG emissions at all. Transport & Environment (T&E). Lindstad E, Eskeland GS, Rialland A, Valland A (2020) Decarbonizing maritime transport: the importance of engine technology and regulations for LNG to serve as a transition fuel. Sustainability 12: 8793. https://doi.org/10.3390/su12218793 Lindstad E, Lagemann B, Rialland A, Gamlem GM, Valland A (2021) Reduction of maritime GHG emissions and the potential role of E-fuels. Transportation Research Part D: Transport and Environment 101, 103075. https://doi.org/10.1016/j.trd.2021.103075 Lindstad E, Rialland A (2020) LNG and cruise ships, an easy way to fulfil regulations—versus the need for reducing GHG emissions. Sustainability 12: 2080. https://doi.org/10.3390/su12052080 Lu D, Theotokatos G, Zhang J, Zeng H, Cui K (2022) Comparative assessment and parametric optimisation of large marine two-stroke engines with exhaust gas recirculation and alternative turbocharging systems. Journal of Marine Science and Engineering 10, 351. https://doi.org/10.3390/jmse10030351 MAN B&W ME-LGIP (2020) MAN Energy Solutions. https://www.man-es.com/marine/products/lgip [accessed 4.22.22] Masood M, Ishrat MM, Reddy AS (2007) Computational combustion and emission analysis of hydrogen-diesel blends with experimental verification. International Journal of Hydrogen Energy, ICHS-2005 32: 2539-2547. https://doi.org/10.1016/j.ijhydene.2006.11.008 Morch CS, Bjerre A, Gøttrup MP, Sorenson SC, Schramm J (2011) Ammonia/hydrogen mixtures in an SI-engine: Engine performance and analysis of a proposed fuel system. Fuel 90: 854-864. https://doi.org/10.1016/j.fuel.2010.09.042 Navarro RM, Peña MA, Fierro JLG (2007) Hydrogen production reactions from carbon feedstocks: fossil fuels and biomass. Chem. Rev. 107: 3952-3991. https://doi.org/10.1021/cr0501994 Nikolaou G, Herzer B, Ure C, Tyler D, Arahata M, Frederiksen N, Hadjipateras P, Solem O, Basaglia R, Hamaguchi T, Perkins T, Neilsen W (2017) LPG for Marine Engines: The Marine Alternative Fuel Ozawa A, Inoue M, Kitagawa N, Muramatsu R, Anzai Y, Genchi Y, Kudoh Y (2017) Assessing uncertainties of well-to-tank greenhouse gas emissions from hydrogen supply chains. Sustainability 9: 1101. https://doi.org/10.3390/su9071101 Pan H, Pournazeri S, Princevac M, Miller JW, Mahalingam S, Khan MY, Jayaram V, Welch WA (2014) Effect of hydrogen addition on criteria and greenhouse gas emissions for a marine diesel engine. International Journal of Hydrogen Energy 39: 11336-11345. https://doi.org/10.1016/j.ijhydene.2014.05.010 Pavlenko N (2020) The climate implications of using LNG as a marine fuel. International Council on Clean Transportation. https://theicct.org/publication/the-climate-implications-of-using-lng-as-a-marine-fuel/ [accessed 4.7.22] Pearsall TJ, Garabedian CG (1968) Combustion of anhydrous ammonia in diesel engines. SAE Transactions 76, 3213-3221 Pochet M, Truedsson I, Foucher F, Jeanmart H, Contino F (2017) Ammonia-Hydrogen Blends in Homogeneous-Charge Compression-Ignition Engine (SAE Technical Paper No. 2017-24-0087). SAE International, Warrendale, PA. https://doi.org/10.4271/2017-24-0087 Rehbein MC, Meier C, Eilts P, Scholl S (2019) Mixtures of ammonia and organic solvents as alternative fuel for internal combustion engines. Energy Fuels 33: 10331-10342. https://doi.org/10.1021/acs.energyfuels.9b01450 Reiter AJ, Kong S-C (2011) Combustion and emissions characteristics of compression-ignition engine using dual ammonia-diesel fuel. Fuel 90: 87-97. https://doi.org/10.1016/j.fuel.2010.07.055 Reiter AJ, Kong S-C (2008) Demonstration of compression-ignition engine combustion using ammonia in reducing greenhouse gas emissions. Energy Fuels 22: 2963-2971. https://doi.org/10.1021/ef800140f Resolution MEPC. 281(70) (2016)-Amendments to the 2014 Guidelines on the Method of Calculation of the Attained Energy Efficiency Design Index (EEDI) For New Ships (Resolution MEPC. 245(66), as Amended by Resolution MEPC. 263(68)) - (Adopted on 28 October 2016). https://imorules.com/MEPCRES_281.70.html [accessed 4.22.22] Riaz A, Zahedi G, Klemeš JJ (2013) A review of cleaner production methods for the manufacture of methanol. Journal of Cleaner Production 57, 19-37. https://doi.org/10.1016/j.jclepro.2013.06.017 Ryu KH, Zacharakis-Jutz G, Kong S-C (2013) Effects of fuel compositions on diesel engine performance using ammonia-DME mixtures (SAE Technical Paper No. 2013- 01-1133). SAE International, Warrendale, PA. https://doi.org/10.4271/2013-01-1133 Shine KP (2009) The global warming potential—the need for an interdisciplinary retrial. Climatic Change 96: 467-472. https://doi.org/10.1007/s10584-009-9647-6 Smith T, Jalkanen J, Anderson B, Corbett J, Faber J, Hanayama S, O'Keeffe E, Parker S, Johansson L, Aldous L, Raucci C, Traut M, Ettinger S, Nelissen D, Lee D, Ng S, Agrawal A, Winebrake J, Hoen M, Pandey A (2014) Third IMO GHG Study 2014: Executive Summary and Final Report Stenersen D, Thonstad O (2017) GHG and NOx emissions from gas fueled engines Tadros M, Ventura M, Guedes Soares C (2019) Optimization procedure to minimize fuel consumption of a four-stroke marine turbocharged diesel engine. Energy 168: 897-908. https://doi.org/10.1016/j.energy.2018.11.146 Trivyza NL, Rentizelas A, Theotokatos G, Boulougouris E (2022) Decision support methods for sustainable ship energy systems: A state-of-the-art review. Energy 239: 122288. https://doi.org/10.1016/j.energy.2021.122288 UN (2015) United Nations Framework Convention on Climate Change: Paris Agreement: FCCC/CP/2015/L. 9/Rev. 1. New York, USA UNCTAD (2021). Review of Maritime Transport 2021 [WWW Document]. URL https://unctad.org/system/files/official-document/rmt2021_en_0.pdf US EPA O (2020) AP 42, Fifth Edition, Volume I Chapter 1: External Combustion Sources. https://www.epa.gov/air-emissions-factors-and-quantification/ap-42-fifth-edition-volume-i-chapter-1-external-0 [accessed 4.22.22] Ushakov S, Stenersen D, Einang PM (2019) Methane slip from gas fuelled ships: a comprehensive summary based on measurement data. J Mar Sci Technol 24: 1308-1325. https://doi.org/10.1007/s00773-018-00622-z Verhelst S, Sierens R, Verstraeten S (2006) A critical review of experimental research on hydrogen fueled SI engines. SAE Transactions 115, 264-274. Wagemakers A, Leermakers C (2012) Review on the effects of dual-fuel operation, using diesel and gaseous fuels, on emissions and performance. SAE technical paper 01-0869. Warwick N, Griffiths P, Keeble J, Archibald A, Pyle J (2022) Atmospheric implications of increased hydrogen use. Department for Business, Energy & Industrial Strategy White CM, Steeper RR, Lutz AE (2006) The hydrogen-fueled internal combustion engine: a technical review. International Journal of Hydrogen Energy 31, 1292-1305. https://doi.org/10.1016/j.ijhydene.2005.12.001 White J (2022) How fuel-agnostic engine platforms can reduce carbon emissions of commercial transportation. Cummins Inc. https://www.cummins.com/news/2022/03/11/how-fuel-agnostic-engine-platforms-can-reduce-carbon-emissions-commercial [accessed 8.3.22] Winnes H, Fridell E, Ellis J, Forsman B, Ramsay W, Westermark H (2020) Aftertreatment of methane slip from marine gas engines. Lighthouse Winnes H, Moldanová J, Anderson M, Fridell E (2016) On-board measurements of particle emissions from marine engines using fuels with different sulphur content. Proceedings of the Institution of Mechanical Engineers, Part M: Journal of Engineering for the Maritime Environment 230: 45-54. https://doi.org/10.1177/1475090214530877 Woodyard D (2009) Pounder's Marine Diesel Engines and Gas Turbines - 9th Edition. World Economic Forum (2022) Fuel of the future: How to realize the potential of hydrogen. https://www.weforum.org/agenda/2022/03/hydrogen-decarbonization-climate-change-energy/ Worldwide Emissions Standards (2016) Heavy Duty and Off-Highway Vehicles Yousefi A, Guo H, Dev S, Liko B, Lafrance S (2022) Effects of ammonia energy fraction and diesel injection timing on combustion and emissions of an ammonia/diesel dual-fuel engine. Fuel 314, 122723. https://doi.org/10.1016/j.fuel.2021.122723 Zincir B (2022) Environmental and economic evaluation of ammonia as a fuel for short-sea shipping: A case study. International Journal of Hydrogen Energy. https://doi.org/10.1016/j.ijhydene.2022.03.281
