Submerged Geosynthetic Reef as Shore Protection Measure for Islands
https://doi.org/10.1007/s11804-022-00256-z
-
Abstract
The Sagar Island, located north of the Bay of Bengal, intercepts the flow in the Hoogly estuary that comprises a network of several estuarine distributaries and creeks, which is considered to be one of the largest estuarine systems in the world. The Hooghly River experiences a tidal range in the order of about 4 m, due to which the tide-generated currents drive the sediments which are continuously set in motion. The temple, Kapil Muni (21°38′15.35″N, 88°4′30.56″E) is located on the south-western side of Sagar Island, where an annual religious festival and rituals with about a million pilgrims is conducted. The pertinent erosion problem at a rate of about 5 m/year is prevalent at the site has considerably reduced the beach width, thereby, resulting in reduced space for religious as well as recreational activities along the coast. A novel cross-section for the proposed submerged reef using geosynthetic materials is designed considering the different site-specific, environmental, and socio-economic conditions. The submerged reef can effectively be devised to redistribute the current circulation pattern and trap the sediment for beach restoration. The performance of such a structure depends on its geometrical and structural characteristics, the location of the reef (i. e.) the water depth at the toe, distance from the coastline, wave-structure interaction, sediment transport and local morpho dynamics. The aforesaid criteria were optimized using a numerical model which predicted the average residual velocity in the site to be in the order of about 1 m/s. Owing to logistical constraints geosynthetic materials had to be employed. The detailed design of such a system arrived through numerical modelling and field measurements are presented and discussed in this paper.Article Highlights• The design criteria to suit the site conditions alongside the stability factors are discussed.• Numerous limitations which includes logistics, cost-effectiveness, environmental impact, tourism etc. are addressed.• Coastal protection measure for a remote island exposed to high tidal range and strong currents.• Numerical modeling of the tide-induced currents executed through TELEMAC 2D. -
1 Introduction
The conventional approach to a persistent erosion problem is the construction of shore connected structures such as groynes, seawalls, revetments, etc. From literature and global experience, it is inferred that non-shore connected structures such as offshore breakwaters and submerged reefs can eminently be employed to combat erosion as well as aid in beach restoration. Therefore, the construction of non-shore connected structures such as offshore emerging breakwaters or submerged reefs/breakwater is preferred.
The phenomenon of wave damping or wave attenuation can be achieved effectively on the lee side of a submerged breakwater (Hunt 1959; Homma and Horikawa 1961). Although Black and Andrews (2001) reported several natural reefs which have potentially enhanced the beach formation, the emerging offshore breakwater structures are ascertained to result in salient formation. Ranasinghe and Turner (2006) compared the field performance of about ten submerged structures constructed till the early 2000s and claimed that only 3 out of the 10 cases resulted in an accreting shoreline. Thus, meticulously engineered structures and a detailed investigation of the nearshore current circulation pattern has to be performed prior to the adoption of a submerged breakwater for beach protection. In an attempt to overcome the sediment deficit along the downdrift side, structural alterations such as reducing offshore-breakwater crest elevation, increasing the number of segments or the width of the existing segment gaps or opening have been implemented to reinstate more natural circulation patterns (Aminti et al. 2004; Cammelli et al. 2006; Gomes and da Silva 2014). Stauble and Tabar (2003) suggested the construction of groynes on either end of the submerged breakwater to retain sediments landward of the submerged breakwater. Formation of accreting salient leeward of the structure and eroding bays in the downdrift side is the characteristic of emergent segmented breakwaters (Thomalla and Vincent 2003; Fairley et al. 2009). In the case of submerged segmented breakwaters, the deeper water depths in the segmented gaps could accelerate offshore driven rip currents which creates a safety hazard (Cappietti et al. 2013). The mean velocities of rip currents vary between 0.2 m/s and 0.7 m/s (Aagaard et al. 1997; Bowman et al. 1988; MacMahan et al. 2005; Sonu 1972); however, it rarely achieves velocities up to 1 m/s (Brander and Short 2000; Shepard and Inman 1950; Short and Hogan 1994).
An extensive literature of experimental investigations on the hydrodynamics of wave propagation over submerged structures to optimize the geometrical parameters are available (Johnson et al. 1951; Dattatri et al. 1978; Abdul Khader and Rai 1980; Cornett et al. 1993; Twu et al. 2001; Lokesha et al. 2018). Nevertheless, it is not true for morphodynamic changes. Three-dimensional wave basin studies have been carried out by Groenewoud et al. (1996) to examine the effect of segment spacing of submerged breakwaters. Turner et al. (2001) investigated the performance of the Gold Coast artificial reef system. Further, Ranasinghe et al. (2006) studied the morphodynamic effects through a physical model study. Klonaris et al. (2019) examined the morphodynamic changes on the lee side of a porous submerged breakwater through experimental and numerical model studies. An empirical relation for predicting the shoreline changes on the shoreward side of a submerged breakwater is governed by the parameters such as wave incidence angle, submergence depth, positioning of the structure in relevance to the distance from the shoreline and surf zone width.
An accurate and suitable design of a system of submerged breakwaters generates an accretive circulation pattern, whereas, a poorly designed system leads to the formation of an erosive circulation pattern (Gallerano et al. 2019). The converging currents on the lee of the submerged structure result in accretion and the diverging currents result in erosion. A schematic representation of accretive and erosive currents as described by Gallerano et al. (2019) is shown in Figure 1.
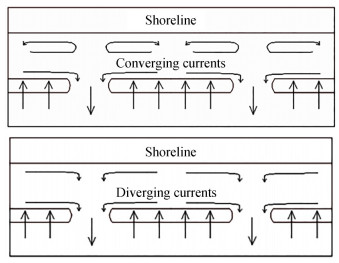 Figure 1 Accretive and erosive circulation pattern in the lee side of submerged breakwaters (Gallerano et al. 2019)
2 Geosynthetics in coastal protection
The most commonly cited disadvantage for using geo-synthetic materials in coastal protection measures is its failure on prolonged exposure to UV radiation, whereas, Heerten (1980) highlights that thick nonwoven geosynthetic materials are proven to be resistant against ultraviolet radiation and saltwater. The second concern would be the long-term stability/integrity of the coastal work, which is inferred to often corresponds to the planned design life as pointed out by Kohlhase (1997). Heibaum (2004) has presented several case studies on the application of geosynthetic containers as armour, ballast, filter, storage, core for hydraulic structures, flood protection, scour repair and protection, and improvement of the earth dam. The geotextile tube technology is mainly used for flood and water control, but they are also used to prevent beach erosion and for shore protection and environmental applications (Koerner and Koerner 2006).
The Gold Coast beach in Australia experienced severe erosion attributed due to the massive extent of longshore sediment transport at a rate as high as 500000 m3/year (Lenze et al. 2002). A novel solution for the commissioning of a submerged reef using geosynthetic sand-filled containers was proposed by the Northern Gold Coast protection strategy in 1997. The coast has since been successfully stabilized with additional beach width acquired and a 52 km long stretch of beach was protected for various recreational activities; it is most typically suited for surfing. The use of geosynthetic materials has resulted in the development of a new marine ecosystem and the accreted salient is prominent on the lee side of the submerged reef, which is also resistant/resilient to eroding storm events (Jackson et al. 2002). The coast of Young-Jin beach along the Eastern Korean shoreline was stabilized by the installation of the submerged two-layer geo-tubes with a scour apron mat (Shin and Oh 2007). Dune stabilization at Sylt, Germany was achieved by laying a pile of sand filled geosynthetic containers stacked up at 1:2 and 1:4 slopes.
Table 1 highlights the literature corresponding to the hydraulic stability of sand container units. The performance of geosynthetic materials across the Australian shoreline was discussed by Hornsey et al. (2011) and it is reported that many geo-tubes performed well beyond desired design requirements even during extreme events.
Table 1 Literature on hydraulic stabilityAuthors/ Structures Formulae/Nomograms Remarks Hudson (1956)/ Rubble mound structures ${N_s} = \frac{H}{{\Delta {D_n}}}{\rm{ = }}{\left({{K_D}\cot \alpha } \right)^{1/3}}$ Formula based on geometrical considerations of the balance of wave generated flow forces acting on an armour stone in a slope of a breakwater ${W_{50}} = \frac{{{\rho _s}g{H^3}}}{{{K_D}{{\left({\frac{{{\rho _s}}}{{{\rho _w}}} - 1} \right)}^3}\cot \alpha }}$ Wouters (1998)/GSC-revetments ${N_s} = \frac{{{H_s}}}{{\left({\frac{{{\rho _E}}}{{{\rho _w}}} - 1} \right)D}} = \frac{{{C_w}}}{{\sqrt {{\xi _o}} }}$ Stability number expressed in terms of surf similarity parameter based on experimental data. Instead of the required weight of the armour unit, thickness D of the cover layer is defined by D=lc sinα D=l sinα ${l_c} = \frac{{{H_s}\sqrt {{\xi _o}} }}{{\left({\frac{{{\rho _E}}}{{{\rho _w}}} - 1} \right)\sin \alpha {C_w}}}$ Oumeraci et al.(2002b, 2002c, 2003)/GSC-revetments and low crested structures ${N_{s, {\rm{slope}}}} = \frac{{{H_s}}}{{\left({\frac{{{\rho _E}}}{{{\rho _w}}} - 1} \right)D}} < \frac{{{C_w}}}{{\sqrt {{\xi _o}} }}$ The stability number is formulated and postulated to be a function of the surf similarity parameter. Two different formulae for slope and crest GSCs for high overtopping revetments and low crested structures based on small and large scale experiments ${l_c} = \frac{{H_s^{3/4}\sqrt T }}{{{C_w}\left({\frac{{2{\rm{ \mathsf{ π} }}}}{{\rm{g}}}} \right)\left({\frac{{{\rho _{{\rm{GSC}}}}}}{{{\rho _w}}} - 1} \right)\sqrt {\frac{{\sin \left({2\alpha } \right)}}{2}} }}$ ${N_{s, {\rm{crest}}}}{\rm{ = }}\frac{{{H_s}}}{{\left({\frac{{{\rho _{{\rm{GSC}}}}}}{{{\rho _w}}} - 1} \right)D}} < 0.79 + 0.09\frac{{{R_c}}}{{{H_s}}}$ ${l_c} = \frac{{{H_s}}}{{\left({\frac{{{\rho _{{\rm{GSC}}}}}}{{{\rho _w}}} - 1} \right)\left({0.79 + 0.09\frac{{{R_c}}}{{{H_s}}}} \right)\sin \alpha }}$ Recio (2007)/ GSC-revetments and submerged GSC-structures ${l_{c\left({{\rm{sliding}}} \right)}} \ge {u^2}\frac{{\left[ {0.5{\rm{K}}{{\rm{S}}_{{\rm{CD}}}}{C_D} + 2.5{\rm{K}}{{\rm{S}}_{{\rm{CL}}}}{C_L}\mu } \right]}}{{\left[ {\mu {\rm{K}}{{\rm{S}}_R}\Delta g - {\rm{K}}{{\rm{S}}_{{\rm{CM}}}}{C_M}\frac{{\partial u}}{{\partial t}}} \right]}}$ Process-based stability formulae for different types of GSC structures considering two key hydraulic failure modes: overturning and sliding. Force coefficients were found by conducting several small scale experiments. ${l_{c\left({{\rm{overurning}}} \right)}} \ge {u^2}\frac{{\left[ {0.05{\rm{K}}{{\rm{O}}_{{\rm{CD}}}}{C_D} + 1.25{\rm{K}}{{\rm{O}}_{{\rm{CL}}}}{C_L}} \right]}}{{\left[ {0.5\Delta {\rm{K}}{{\rm{O}}_R}g - 0.1{\rm{K}}{{\rm{O}}_{{\rm{CM}}}}{C_M}\frac{{\partial u}}{{\partial t}}} \right]}}$ Stability nomograms to be used for feasibility studies based on Recio (2007) Mori et al. (2008)/ Submerged GSC breakwater ${N_s}\frac{{{H_s}}}{{\left({\frac{{{\rho _E}}}{{{\rho _w}}} - 1} \right)D}} < \frac{{{C_w}}}{{\sqrt {{\xi _o}} }}$ Showcased the applicability of Oumeraci et al. (2003) to estimate the stability of the crest of submerged GSC structure studied through experiments Recio et al. (2010)/Submerged GSC Stability nomograms to be used for feasibility studies based on Recio (2007) Discuss the extension of Recio (2007) formulae to design prototype structures and provides nomograms for different GSC applications Coghlan et al. (2009) and Hornsey et al. (2011)/Non-overtopping GSC revetments Stability nomograms were developed for two specific GSC geometries by using the data from tests Nomograms indicate the design wave height at the structure to be used for an Initial damage criterion for structure slope. GSC-Geosynthetic sand filled container Rc – crest freeboard CD, CL, CM – drag, lift and inertia co-efficient Lo=gT2/2π – deepwater wavelength Cw – empirical parameter derived from Ns u – horizontal velocity g – acceleration due to gravity α – slope angle of structure slope Hs – incident significant wave height ξo = tanα/(Hs/Lo)1/2 – Surf similarity parameter KD – stability coefficient Δ=(ρs/ρw-1) KO – the coefficient for deformation due to overturning $\frac{{\partial u}}{{\partial t}}$ – horizontal acceleration KS – the coefficient for deformation due to sliding lc – length of the container ρs – density of armour unit Ns – stability number ρw – density of water ρE – density of GSC *Source: Dassanayake and Oumeraci (2013) In the present paper, the details of the site conditions and the proposed solution are discussed in detail. The data on the topography, bathymetry, sediment grain size, sediment concentration etc. collected from the coastline adjoining the Kapil Muni temple is briefly discussed.
3 Sagar Island, India
Sagar Island resembles a triangular wedge situated on the northern frontier of the Bay of Bengal. Owing to its proximity near the Hoogly river mouth, it actively intercepts the flow from the tidal inlet of a perennial river as shown in Figure 2. From detailed shoreline mapping studies through remote sensing tools, it is inferred that the south-eastern and south-western parts of the Island experiences severe erosion as can be seen in Figure 3(a), where the inner and outer band denotes the short term and long term shoreline dynamics respectively. The continued erosion near Kapil Muni temple at a rate of about 5m/year is observed as shown in Figure 3(b). To combat erosion, a comprehensive study to propose coastal protection is mandated, the details of which are presented and discussed in this paper.
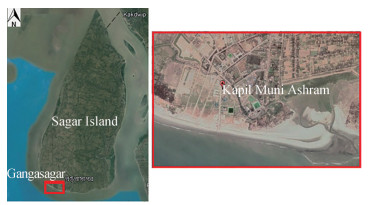 Figure 2 Location map of Sagar Island (L) and Kapil Muni (R)
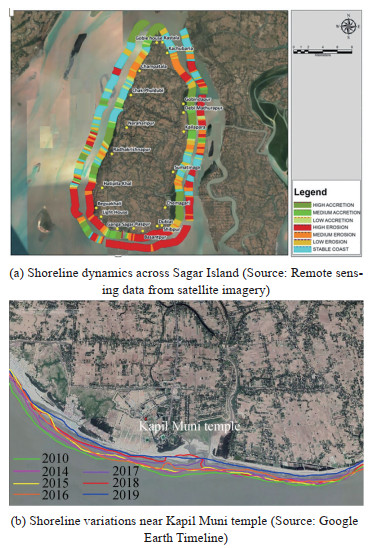 Figure 3 Assessment of shoreline dynamics through satellite imagery
The southwestern coast of Sagar island is vastly a tide dominant region, with a tidal range in the order of about 3-4 m on average. The coast is exposed to ocean waves from the Bay of Bengal, often in combination with high tide or seasonally in combination with storm surge. In the event of a rise in the water level, the waves tend to break near the sandy beach and the dissipated energy induces strong current circulation, which erodes the sediments from the coast.
The local site conditions and parameters have to be meticulously measured before solving a long term erosion problem. This data would facilitate the decision making regarding the choice of materials for construction and design limitations. From the reconnaissance survey, the effect of the variation in the tidal range was witnessed. The average tidal range varies between 3 m and 4 m and the horizontal distance between the HTL and LTL over each tidal cycle is about 200m to 250 m, and thus, the construction of shore connected protection structures would pose great difficulty in its execution and maintenance. It was also observed that the cross-shore current is more predominant than the longshore current.
A series of detailed site investigations including topographic and bathymetric surveys, bore-hole tests, beach profiling, water sampling, grain size distribution, concentration of suspended sediments and shoreline mapping was carried out. The results from field observations also enhanced the results on the flow field output from the numerical model through well-defined environmental parameters. The measured bathymetry in the vicinity of the Kapil Muni temple, since it dictates the nearshore process is used for the study.
The three water sample locations WS1, WS2 and WS3 shown in Figure 4 were chosen for the collection of water samples to quantify the total suspended solids and total bed load. At each of the locations, two samples have been collected covering one in mid-depth and, one just above the seabed.
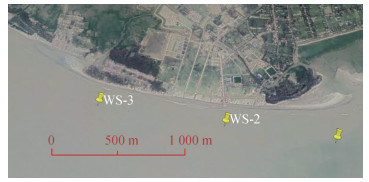 Figure 4 Location points of water sampling
To assess the siltation, knowledge of the total suspended solids present in the water column in the vicinity of the affected stretch of the coast is essential. In this study, the total suspended solids and bedload were quantified. The term total suspended solids can be referred to materials that are not dissolved in water and are non-filterable. It is defined as residue upon evaporation of a non-filterable sample on a filter paper.
A well-mixed sample is filtered through a weighed standard glass fibre filter and the residue retained on the filter is dried to a constant weight at a temperature of 103-105 ℃. An increase in the weight of the filter represents the total suspended solids. The results on the suspended solids analyzed from the water sampler are shown in Tables 2 and 3, respectively. This information facilitates arriving at the sediment concentration and thereby, the net sediment transport rate could be derived from the hydrodynamic modeling output.
Table 2 Total suspended solids in the water sampleSample location Tide Depth Suspended solids (mg/L) WS-1 HTL Middle 141 LTL Middle 24 WS-2 HTL Middle 73 LTL Middle 298 WS-3 HTL Middle 170 LTL Middle 400 Table 3 Total bedload in the water sampleSample Location Tide Depth Bedload (mg/L) WS-1 HTL Bottom 152 LTL Bottom 48 WS-2 HTL Bottom 142 LTL Bottom 432 WS-3 HTL Middle 216 LTL Middle 436 The sediment size governs the transport of the same under the estimated local current velocities. Thus, soil samples were collected to assess the grain size distribution. A total of 6 samples were collected along the beach/shoreline front (3 along the Low Tide line and 3 along the High Tide line). These samples were subjected to grain size analysis through standard sieve tests and the distribution of grain size dia in a logarithmic graph is shown in Figure 5. It is mostly comprised of fine sand.
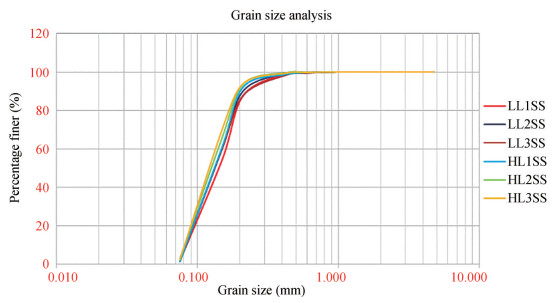 Figure 5 Grain size distribution curve
4 Geo-synthetic submerged reef
Based on the extensive literature review and data obtained from the site, a continuous submerged offshore reef is proposed to be constructed, since, submerged structures are effective in damping the incident wave energy and wave height attenuation by facilitating premature wave breaking and bypassing circulation currents for an even distribution of sediments along the curvilinear shore. Besides, the submerged breakwaters serve the purpose of beach restoration without inducing any damage to the aesthetics of the local beachfront. A stretch of about 2.3 km long is to be protected with a submerged structure in the vicinity of Kapil Muni temple and the submerged structure is designed in 2.3 m water depth from the low tide level as shown in Figure 6. A continuous submerged structure is preferred over the segmented one since the latter might drive strong offshore driven rip currents which poses a huge threat for the pilgrims taking a holy dip in the waters. Owing to the higher tidal range prevalent in the site, precaution has been taken to ensure that the structure remains submerged at the lowest low tide water level. The proposed solution is arrived at based on the detailed hydrodynamic and morphodynamic modeling as detailed in the next section.
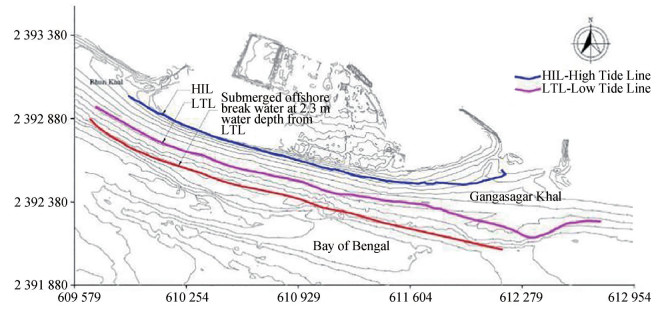 Figure 6 Layout of Continuous submerged offshore breakwater
5 Hydrodynamic modelling
A model to compute the currents generated at the study area was developed with adequate field observed data such as topographic, bathymetric and tidal charts, soil sampling and testing, water sampling and testing, beach profiling and shoreline mapping. The pattern of the flow field ultimately dictates the sedimentation in the location, thereby, yielding a reliable prediction of the fate of the proposed protection measure.
The flow field and corresponding sediment movement near the stretch of the Kapil Muni temple in Sagar Island were carried out for the proposed layout. The river and tidal flow environment are predominant in the northern part of Sagar Island, whereas, the tidal flow and wave action are predominant along the southern stretch of the Island. The natural system of the Island was replicated using numerical modelling with the input of forcing parameters. Numerical modelling of the environmental flow field (currents) was carried out along the southeastern coastal region of Sagar Island.
Navier-Stokes equations (N-S equations) are the fundamental mathematical framework for any fluid dynamics process. In the context of tides, storm surges and tsunamis, the N-S equations simplify to the "vertically integrated shallow water equations (SWE)" that govern the ocean flow field with main momentum transport occurring in the horizontal directions only. The SWE without the non-linear inertial terms, in a Cartesian coordinate frame fixed to the rotating earth, are,
$$ \begin{array}{l} {q_{x, t}} + \frac{{{q_x}}}{H}{q_{x, x}} + \frac{{{q_y}}}{H}{q_{x, y}} - f{q_y} = - {\rho ^{ - 1}}H{p_{a, x}} - gH{\eta _{, x}} + {\rho ^{ - 1}}\left({{\tau _{ax}} - {\tau _{bx}}} \right)\\ {q_{y, t}} + \frac{{{q_y}}}{H}{q_{y, z}} + \frac{{{q_y}}}{H}{q_{y, y}} - f{q_x} = - {\rho ^{ - 1}}H{p_{a, y}} - gH{\eta _{, y}} + {\rho ^{ - 1}}\left({{\tau _{ay}} - {\tau _{by}}} \right) \end{array} $$ (1) where the origin of the coordinate system is chosen at the undisturbed sea surface with 'z' measured positive upwards. (qx, qy) is the volume transport vector in the (x, y) plane and t is the time. The suffixes preceded by ', ' indicate partial derivatives. H = h+η is the total depth of water, h is the undisturbed depth of water at z=0, η is the sea surface elevation measured from the undisturbed sea surface, f is the Coriolis parameter, ρ is the density of water and g is the acceleration due to gravity. (τax, τay) and (τbx, τby) are the stresses at the air-sea interface and bottom surface respectively. They are evaluated using the conventional quadratic law as follows:
$$ {\tau _a} = {K_a}{\rho _a}\left| W \right|W, \;{\tau _b} = {K_b}\rho {H^{ - 2}}\left| q \right|q $$ (2) where Ka and Kb are the wind and bottom stress coefficients respectively, ρa is the air density, W is the wind velocity measured 10m above the sea level and the volume transport q ≡ (qx, qy). Appropriate water levels and wind velocities have to be specified in Equation (2) for the simulation of tides.
TELEMAC-2D is the numerical modelling software developed to study the hydrodynamic and water quality processes of free surface transient flows. The software is developed by the National Hydraulics and Environmental Laboratory (Hervouet and Ata 2017). The TELEMAC-2D model solves the depth-integrated shallow water equations (SWEs), where it is assumed that the horizontal length scale of flow being much greater than the vertical. The TELEMAC-2D solves the SWEs using the finite element method with domain discretization on a mesh of irregular triangular elements. The governing SWEs solved numerically by TELEMAC-2D include:
1) Continuity
$$ \frac{{\partial h}}{{\partial t}} + \mathit{\boldsymbol{u}}{\mathit{\nabla}}\left(h \right) + h \cdot {\rm{div}}\left(\mathit{\boldsymbol{u}} \right) = {S_h} $$ (3) 2) x-momentum
$$ \frac{{\partial u}}{{\partial t}} + \mathit{\boldsymbol{u}}\nabla \left(u \right) = - g\frac{{\partial Z}}{{\partial x}} + {S_x} + \frac{1}{h}{\rm{div}}\left({h{v_t}\nabla u} \right) $$ (4) 3) y-momentum
$$ \frac{{\partial v}}{{\partial t}} + \mathit{\boldsymbol{u}}\nabla \left(v \right) = - g\frac{{\partial Z}}{{\partial y}} + {S_y} + \frac{1}{h}{\rm{div}}\left({h{v_t}\nabla v} \right) $$ (5) 4) Conservative tracer
$$ \frac{{\partial T}}{{\partial t}} + \mathit{\boldsymbol{u}}\nabla \left(T \right) = {S_T} + \frac{1}{h}{\rm{div}}\left({h{v_T}\nabla T} \right) $$ (6) where h is depth of water (m); u, v velocity components (m/s); vT velocity components of tracer (m/s); T passive (non-buoyant) tracer (℃); g gravity acceleration (m/s2); Z free surface elevation (m); t time (s); x, y horizontal space coordinates (m); Sh source or sink of fluid (m/s); Sx, Sy source or sink terms in dynamic equations (m/s2); ST source or sink of tracer (g/Ls).
TELEMAC-2D solves the SWEs using the Finite Element Method, across an unstructured triangular mesh. The SWEs govern each node of the computational model, and they comprise the continuity equation which reflects the conservation of water mass, and the dynamic equations which demonstrate the conservation of momentum in both the x and y directions. The primary benefit of unstructured triangular mesh is its flexibility in defining complicated geometries within the model domain. In flood inundation modelling of a large river basin, this capability is essential since the channel geometry can be discretized by smaller size elements while the flood plains can be discretized by larger size elements. Also, TELEMAC-2D supports parallel processing which can be performed on a multi-core workstation for model speed-up. The parallel processing in TELEMAC-2D is based on the model domain decomposition method combined with the message passing interface protocol. The domain decomposition method follows the "divide and conquer" strategy where the entire model domain is split into several sub-domains. The massive computation for the entire domain, thus, can be distributed to many processors to be processed concurrently. The processing for each sub-domain is performed in an individual processor in the same way as defined by the original serial code. The message passing interface protocol handles the cross-boundary communications i. e., the exchange of hydraulic variables for the interface elements between sub-domains.
As an industry-standard software, TELEMAC 2D will be used for any simulations of the tide, storm surge and tsunami that may be conducted under this project. Domain-specific calibration could be carried out for Sagar island based on data availability. The proposed submerged structure across the site is incorporated within the domain, and a test was conducted for a 15 days tidal cycle, which accounts for the tidal fluctuations from the Bay of Bengal in the south and also the discharge from the river Ganges in the north.
The hydrodynamic parameters such as the depth-averaged current velocities are computed over the entire domain area in 2D, thus we arrive at the velocities u and v in x and y direction respectively. Figure 7(a) and 7(b) shows the scalar current velocity (u-v averaged) variations during the typical flooding and ebbing time step. Based on these results the residual velocity (with magnitude and direction) is computed, which in turn is crucial in computing the volume of sediments. The residual velocity computed is 0.99 m/ s averaged (weighted average) over an area of about 3.57 km2 for flooding and ebbing conditions across 15 days.
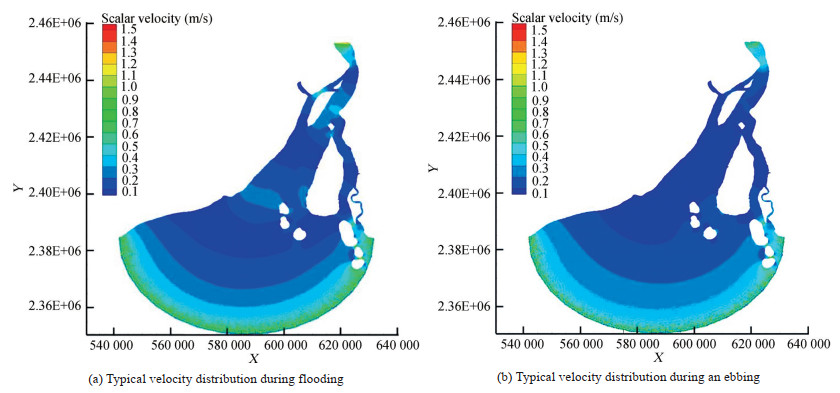 Figure 7 Tide induced current velocities
6 Sediment transport modelling
The transport equations are solved in conjunction with the Sediment transport models found in the Coastal Engineering Manual (2006) to compute the morphological changes concerning time.
Ackers and White formula: This formula proposed by Ackers and White (1973) is the most suitable one for the present situation as it directly computes, mostly overestimates, the total load of sediment transport. The overland flow will be mostly shallow in the present scenario. An average flow depth reported by field officers at the site is about 30 cm. Hence, this formula is expected to give a more appropriate estimate of the sediment load.
Van Rijn formula: This formula of Van Rijn (1989) is another favoured formula in the field by many engineers for total load estimates. However, the limitations of this approach (flow depth, h > 1.0 m and D50 > 0.5 mm) will dictate the use of the formula for the specific application.
Bed & Suspended load estimates: Traditionally, sediment transport has been considered to be of mainly 2 forms: Bedload and Suspended load. In this approach, the load estimates will be combined to give the total load. It is usually observed that (U.S. Army Corps of Engineers Manual 2006) this formula will give the lower bounds of the total load.
According to Ackers and White formula, the sediment transport is related to
$$ {G_{{\rm{gr}}}} = {q_t}{\left({u*/U} \right)^n}/UD = C{\left[ {\left({{F_{{\rm{gr}}}}/{A_{{\rm{gr}}}}} \right) - 1} \right]^m} $$ (7) The above relationship is used to estimate qt (m3/s for per meter length) from U (Mean flow), D (D35), u* (friction velocity), C (Chezy coefficient) and parameters n, m, Agr and Fgr. More information can be found in Coastal Engineering (2004).
Estimation of total load from Bed and Suspended loads: The bed load is calculated from the fundamental relationship,
$$ {q_b} = x.{\tau _b}\left({{\tau _b} - {\tau _{cr}}} \right) $$ (8) where x is a non-dimensional parameter and τb is bed shear and τcr is critical shear for sediments to be displaced. The suspended load is estimated using a factor A defined as,
$$ {q_s} = A\;{q_b} $$ (9) Using (8) and (9), the total load is given as,
$$ {q_t} = {q_s} + {q_b} $$ (10) The factor A and the other stresses may be evaluated from relationships in Koutitas (1988) or any other standard formula.
The formulas are also capable of computation of combined transport due to current and waves. The transport equation governing the sediment flow and bed level change will be used to estimate the rate of sedimentation in the intake basin.
By formulation of Ackers and White (1973), the total quantity of sediments computed was found to be 8.2×10⁻³ m3/s for per meter length of the structure, since the structure span is about 2.3 km along the coast, the quantity is 24.6 m3/s along the coast. The hydrodynamic model to compute the current velocities were performed for 15 days and hence, a direct estimate of the quantity of sediments accumulated over the domain area is 0.3×10⁸ m3/15 days, extending the same the sediment quantity computed for a year is 0.776×10⁹ m3. Accounting for the spatial distribution growth of 21.719 m/year is arrived at, including a factor of safety for expected abnormalities a growth of 13.03 m/year is an expected outcome post the construction of the proposed protection measure.
7 Design of submerged reef
Geosynthetic materials are being extensively used for the construction of sea walls, groynes or breakwaters. They are placed in the required position and filled with soil slurry using a slurry pump to the designed height. Unlike conventional methods using hard materials, geosynthetic containers can be easily removed in case of any adverse impact of the structure on the shoreline. It can adjust according to the bed profile during filling and stabilize, once the excess water flows out because of the flexibility of the material.
A wide array of geosynthetic materials are commercially available which finds an extensive application in numerous civil and coastal engineering works. Geo-synthetic sand-filled containers, geosynthetic tubes, geosynthetic mattresses etc. are a few of the most commonly used materials. Geotextile-tubes are eco-friendly and are widely adopted for coastal protection/harbour formation, the likely problems being encountered in employing them under the present site conditions are preparation of the seabed; if not done properly may lead to unequal settlements, thereby, leading to the failure of the tube and improper anchoring of the tube may lead to its rolling down towards offshore. Thus, a geotextile container is preferred over geotextile tubes for the present site, it possesses similar advantages of employing geotextile tubes while minimizing the liabilities incurred in the event of employing the former measures. The geotextile containers are dimensionally smaller are prone to disturbances due to wave and tidal currents, to enhance the stability of geotextile containers in the submerged state, a weighted geotextile mattress is to be positioned over the containers. These mattresses are extended over a distance of about 3 m on either (lee or sea) sides, to provide sufficient anchorage, also, to combat scour. A combination of geotextile containers and mattresses is employed to design a stable cross-section of the submerged reef as shown in Figure 8(a). The 3D view of the cross-section is presented in Figure 8(b). From the grain size distribution, it is understood that the local beach sediments are primarily fine sand and it is well suited/ appropriate fill material for geosynthetic sand-filled containers with suitable AOS (apparent opening size).
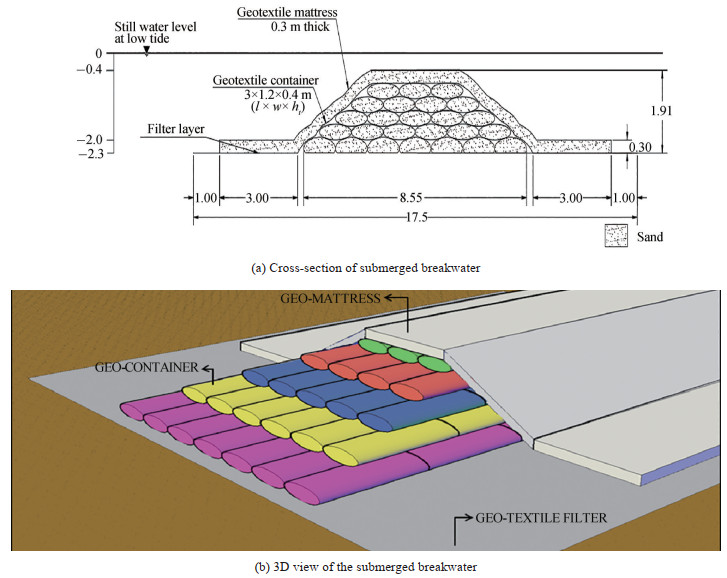 Figure 8 Proposed submerged reef breakwater
7.1 Filter layer
Geosynthetics are widely used as filter layer materials in numerous civil engineering applications such as separation, filtration, drainage, reinforcement etc. In comparison to granular filters, geosynthetic filters possess porosity about 3 times greater than the former with a limited thickness of the geotextile material. For the present study, a geometrically soil tight filter is designed, where, the GSM is 300 g/m2.
The thickness of the filter layer is determined using the following expressions
For one-way flow condition
Thickness of Geotextile Filter Layer < (1.7 to 2.7 × D50) For two-way flow condition
Thickness of Geotextile Filter Layer < (0.5 to 1 × D50)
For clayey soil with one and two-way flow condition
Thickness of Geotextile Filter Layer < (25 to 37 × D50)
7.2 Geotextile container
Geosynthetic containers are designed to withstand stresses developed while filling (placing) and under the marine loadings expected on the structure. The aperture opening should be selected such that soil is retained and water is drained out during filling. The geosynthetic containers placed underwater are little affected by UV radiations. In the intertidal zone, the geosynthetics are covered very soon by algae which provide sufficient UV protection. Geotextile containers are generally manufactured using polypropylene or polyester fabric.
The dimension of the designed geotextile container at 80% volume fill condition should remain stable against sliding, overturning and overburden pressures, it was tested for the same and the cross-section which has been found to satisfy the stability should weigh a minimum of 1 800 kg/ 1.8 T above the water and a minimum of 1 000 kg/1 T in the submerged state. The stability calculation for submerged geotextile sand-filled containers was reported by Mori et al. (2008) and Recio et al. (2010). The former arrived at an expression for the stability number (Ns) and the latter proposed a geometric conditional expression for stability against sliding as shown in Equation (11).
$$ {l_{c\left({{\rm{sliding}}} \right)}} \ge {u^2}\frac{{\left[ {0.5{\rm{K}}{{\rm{S}}_{{\rm{CD}}}}{C_D} + 2.5{\rm{K}}{{\rm{S}}_{{\rm{CL}}}}{C_L}\mu } \right]}}{{\left[ {\mu {\rm{K}}{{\rm{S}}_R}\Delta g - {\rm{K}}{{\rm{S}}_{{\rm{CM}}}}{C_M}\frac{{\partial u}}{{\partial t}}} \right]}}\\{l_{c\left({{\rm{overurning}}} \right)}} \ge {u^2}\frac{{\left[ {0.05{\rm{K}}{{\rm{O}}_{{\rm{CD}}}}{C_D} + 1.25{\rm{K}}{{\rm{O}}_{{\rm{CL}}}}{C_L}} \right]}}{{\left[ {0.5\Delta {\rm{K}}{{\rm{O}}_R}g - 0.1{\rm{K}}{{\rm{O}}_{{\rm{CM}}}}{C_M}\frac{{\partial u}}{{\partial t}}} \right]}} $$ (11) The properties of the materials used and the prevailing site conditions are highlighted in Table 4. The stability checks calculations against sliding and overturning as proposed by Recio et al. (2010) are projected in Table 5. It is inferred that a minimum length of 2.5 m should be maintained for the geotextile container. Hence, the section with dimensions 3 m×1.2 m×0.4 m (l×w× h) is adopted for the geotextile container.
Table 4 Materials properties and forcing conditionsParameter Symbol Value Depth d (m) 2.30 Max wave height Hmax (m) 1.79 Significant wave height Hs (m) 1.12 Max wave elevation (m) 0.89 Accleration due to gravity g (m/s2) 9.81 Density of the sand fill ρs(kg/m3) 1 650 Density of the geotextile container ρE(kg/m3) 800 Density of water ρw(kg/m3) 1 029 Container length lc (m) 2.30 Slope α (rad) 0.61 Thickness of armour layer D (m) 1.31 Time period T (s) 5 Deep water wavelength Lo (m) 39 Friction factor betnween geotextiles μ 0.50 Horizontal velocity u (m/s) 0.80 Horizontal acceleration ∂u/∂t (m/s2) 0.50 Specific gravity Δ 0.60 Stability factor (Leakage) F 4 Table 5 Estimation of minimum lc for stability against sliding and overturningStability coefficients Submerged geotextile containers(artificial reef) drag coefficient Cd 9 4≤Cd≤15 lift coefficient Cl 0.90 0.30≤Cl≤1.20 inertia co-efficient Cm 0.30 Co-efficient for deformation against sliding KSCD 1.40 KSCM 1 KSCL 0.94 KSR 0.70 Co-efficient for deformation against Overturning KOCD 1.54 KOCM 1.10 KOCL 0.80 KOR 0.92 Length of container required to sustain sliding failure lc, s 2.45 Length of container required to sustain overturning failure lc, o 0.38 For this material, the tensile strength, specific density and GSM are of a minimum value of 65 kN/m, 950 kg/m3 and 800 kg/m2 respectively. The apparent opening size is set at 70 microns and it possesses a puncture resistance of 1 000 N. The elongation capacity can be up to 25% and the strain is at 10%. Each geotextile container is to be filled in-situ with locally available sand slurry or other materials and sealed at the open end, which is then to be deployed at -2.3 m water depth, roughly 80 to 90 m away from the low tide line.
7.3 Geotextile mattress
A geotextile sand mattress is employed to provide additional slope stability as well as scour protection on either side of the submerged structure. The GSM for the upper and lower layers are 650 and 400 g/m2 respectively, while the tensile strength for the same is equal to or above 40 and 75 kN/m respectively. The geotextile mattress with filled in slurry pockets is blanketed over the arrangement of geotextile containers and anchored to a length of 3 m on either side. The maximum scour depth owing to the breaking waves is computed to be 0.17 m during LTL and 0.27 m during HTL.
The scour depth is computed using the formula
$$ \frac{{{S_m}}}{{{H_S}}} = 0.01{\left({\frac{{{T_P}\sqrt {g{H_S}} }}{d}} \right)^{\frac{3}{2}}} $$ (12) where Sm is the scour depth, Hs is the significant wave height, Tp is the time period and d is the water depth.
The maximum height of the container fills 0.3 m and the dia of the slurry pocket should be 0.45-0.5 m at 90% fill condition, which is computed using the formula
$$ 100\% \;{\rm{fill}} \to \frac{D}{{{D_d}}} = 0.7\;{\rm{to}}\;0.8;90\% \;{\rm{fill}} \to \frac{D}{{{D_d}}} = 0.6\;{\rm{to}}\;0.7 $$ where D is the maximum height of the mattress, and Dd is the maximum diameter of slurry pockets.
8 Summary
This paper encourages the means for adopting novel, ecological friendly coastal protection measure by employing unconventional materials in extreme environmental and geomorphological conditions. The location of Sagar island is a remote hinterland where the existing connectivity is not feasible for the transportation of conventional materials and since the site is of religious importance, off which thousands of pilgrims take a sacred bath, the protection measure had to be also eco-friendly and should be hidden away from plain sight in general.
A submerged reef cross-section primarily using Geosynthetic products was designed considering the flow dynamics off the coast; the critical design parameters were computed after extensive literature review and the proposed section was analytically proven to be safe against failure due to sliding and overtopping. Adopting a submerged structure to combat erosion is a viable option for beach restoration without non-aesthetic emergent structures.
-
Figure 1 Accretive and erosive circulation pattern in the lee side of submerged breakwaters (Gallerano et al. 2019)
Figure 2 Location map of Sagar Island (L) and Kapil Muni (R)
Figure 3 Assessment of shoreline dynamics through satellite imagery
Figure 4 Location points of water sampling
Figure 5 Grain size distribution curve
Figure 6 Layout of Continuous submerged offshore breakwater
Figure 7 Tide induced current velocities
Figure 8 Proposed submerged reef breakwater
Table 1 Literature on hydraulic stability
Authors/ Structures Formulae/Nomograms Remarks Hudson (1956)/ Rubble mound structures ${N_s} = \frac{H}{{\Delta {D_n}}}{\rm{ = }}{\left({{K_D}\cot \alpha } \right)^{1/3}}$ Formula based on geometrical considerations of the balance of wave generated flow forces acting on an armour stone in a slope of a breakwater ${W_{50}} = \frac{{{\rho _s}g{H^3}}}{{{K_D}{{\left({\frac{{{\rho _s}}}{{{\rho _w}}} - 1} \right)}^3}\cot \alpha }}$ Wouters (1998)/GSC-revetments ${N_s} = \frac{{{H_s}}}{{\left({\frac{{{\rho _E}}}{{{\rho _w}}} - 1} \right)D}} = \frac{{{C_w}}}{{\sqrt {{\xi _o}} }}$ Stability number expressed in terms of surf similarity parameter based on experimental data. Instead of the required weight of the armour unit, thickness D of the cover layer is defined by D=lc sinα D=l sinα ${l_c} = \frac{{{H_s}\sqrt {{\xi _o}} }}{{\left({\frac{{{\rho _E}}}{{{\rho _w}}} - 1} \right)\sin \alpha {C_w}}}$ Oumeraci et al.(2002b, 2002c, 2003)/GSC-revetments and low crested structures ${N_{s, {\rm{slope}}}} = \frac{{{H_s}}}{{\left({\frac{{{\rho _E}}}{{{\rho _w}}} - 1} \right)D}} < \frac{{{C_w}}}{{\sqrt {{\xi _o}} }}$ The stability number is formulated and postulated to be a function of the surf similarity parameter. Two different formulae for slope and crest GSCs for high overtopping revetments and low crested structures based on small and large scale experiments ${l_c} = \frac{{H_s^{3/4}\sqrt T }}{{{C_w}\left({\frac{{2{\rm{ \mathsf{ π} }}}}{{\rm{g}}}} \right)\left({\frac{{{\rho _{{\rm{GSC}}}}}}{{{\rho _w}}} - 1} \right)\sqrt {\frac{{\sin \left({2\alpha } \right)}}{2}} }}$ ${N_{s, {\rm{crest}}}}{\rm{ = }}\frac{{{H_s}}}{{\left({\frac{{{\rho _{{\rm{GSC}}}}}}{{{\rho _w}}} - 1} \right)D}} < 0.79 + 0.09\frac{{{R_c}}}{{{H_s}}}$ ${l_c} = \frac{{{H_s}}}{{\left({\frac{{{\rho _{{\rm{GSC}}}}}}{{{\rho _w}}} - 1} \right)\left({0.79 + 0.09\frac{{{R_c}}}{{{H_s}}}} \right)\sin \alpha }}$ Recio (2007)/ GSC-revetments and submerged GSC-structures ${l_{c\left({{\rm{sliding}}} \right)}} \ge {u^2}\frac{{\left[ {0.5{\rm{K}}{{\rm{S}}_{{\rm{CD}}}}{C_D} + 2.5{\rm{K}}{{\rm{S}}_{{\rm{CL}}}}{C_L}\mu } \right]}}{{\left[ {\mu {\rm{K}}{{\rm{S}}_R}\Delta g - {\rm{K}}{{\rm{S}}_{{\rm{CM}}}}{C_M}\frac{{\partial u}}{{\partial t}}} \right]}}$ Process-based stability formulae for different types of GSC structures considering two key hydraulic failure modes: overturning and sliding. Force coefficients were found by conducting several small scale experiments. ${l_{c\left({{\rm{overurning}}} \right)}} \ge {u^2}\frac{{\left[ {0.05{\rm{K}}{{\rm{O}}_{{\rm{CD}}}}{C_D} + 1.25{\rm{K}}{{\rm{O}}_{{\rm{CL}}}}{C_L}} \right]}}{{\left[ {0.5\Delta {\rm{K}}{{\rm{O}}_R}g - 0.1{\rm{K}}{{\rm{O}}_{{\rm{CM}}}}{C_M}\frac{{\partial u}}{{\partial t}}} \right]}}$ Stability nomograms to be used for feasibility studies based on Recio (2007) Mori et al. (2008)/ Submerged GSC breakwater ${N_s}\frac{{{H_s}}}{{\left({\frac{{{\rho _E}}}{{{\rho _w}}} - 1} \right)D}} < \frac{{{C_w}}}{{\sqrt {{\xi _o}} }}$ Showcased the applicability of Oumeraci et al. (2003) to estimate the stability of the crest of submerged GSC structure studied through experiments Recio et al. (2010)/Submerged GSC Stability nomograms to be used for feasibility studies based on Recio (2007) Discuss the extension of Recio (2007) formulae to design prototype structures and provides nomograms for different GSC applications Coghlan et al. (2009) and Hornsey et al. (2011)/Non-overtopping GSC revetments Stability nomograms were developed for two specific GSC geometries by using the data from tests Nomograms indicate the design wave height at the structure to be used for an Initial damage criterion for structure slope. GSC-Geosynthetic sand filled container Rc – crest freeboard CD, CL, CM – drag, lift and inertia co-efficient Lo=gT2/2π – deepwater wavelength Cw – empirical parameter derived from Ns u – horizontal velocity g – acceleration due to gravity α – slope angle of structure slope Hs – incident significant wave height ξo = tanα/(Hs/Lo)1/2 – Surf similarity parameter KD – stability coefficient Δ=(ρs/ρw-1) KO – the coefficient for deformation due to overturning $\frac{{\partial u}}{{\partial t}}$ – horizontal acceleration KS – the coefficient for deformation due to sliding lc – length of the container ρs – density of armour unit Ns – stability number ρw – density of water ρE – density of GSC *Source: Dassanayake and Oumeraci (2013) Table 2 Total suspended solids in the water sample
Sample location Tide Depth Suspended solids (mg/L) WS-1 HTL Middle 141 LTL Middle 24 WS-2 HTL Middle 73 LTL Middle 298 WS-3 HTL Middle 170 LTL Middle 400 Table 3 Total bedload in the water sample
Sample Location Tide Depth Bedload (mg/L) WS-1 HTL Bottom 152 LTL Bottom 48 WS-2 HTL Bottom 142 LTL Bottom 432 WS-3 HTL Middle 216 LTL Middle 436 Table 4 Materials properties and forcing conditions
Parameter Symbol Value Depth d (m) 2.30 Max wave height Hmax (m) 1.79 Significant wave height Hs (m) 1.12 Max wave elevation (m) 0.89 Accleration due to gravity g (m/s2) 9.81 Density of the sand fill ρs(kg/m3) 1 650 Density of the geotextile container ρE(kg/m3) 800 Density of water ρw(kg/m3) 1 029 Container length lc (m) 2.30 Slope α (rad) 0.61 Thickness of armour layer D (m) 1.31 Time period T (s) 5 Deep water wavelength Lo (m) 39 Friction factor betnween geotextiles μ 0.50 Horizontal velocity u (m/s) 0.80 Horizontal acceleration ∂u/∂t (m/s2) 0.50 Specific gravity Δ 0.60 Stability factor (Leakage) F 4 Table 5 Estimation of minimum lc for stability against sliding and overturning
Stability coefficients Submerged geotextile containers(artificial reef) drag coefficient Cd 9 4≤Cd≤15 lift coefficient Cl 0.90 0.30≤Cl≤1.20 inertia co-efficient Cm 0.30 Co-efficient for deformation against sliding KSCD 1.40 KSCM 1 KSCL 0.94 KSR 0.70 Co-efficient for deformation against Overturning KOCD 1.54 KOCM 1.10 KOCL 0.80 KOR 0.92 Length of container required to sustain sliding failure lc, s 2.45 Length of container required to sustain overturning failure lc, o 0.38 -
Aagaard T, Greenwood B, Nielsen J (1997) Mean currents and sediment transport in a rip channel. Marine Geology 140(1–2): 25–45. https://doi.org/10.1016/S0025-3227(97)00025-X Abdul Khader MI, Rai SP (1980) A study of submerged breakwaters. Journal of Hydraulic Research 18(2): 113–121. https://doi.org/10.1080/00221688009499555 Ackers P, White WR (1973) Sediment transport, new approach and analysis. Journal of the Hydraulic Division 99(11): 2041–2060. https://doi.org/10.1061/JYCEAJ.0003791 Aminti P, Cammelli C, Cappietti C, Jackson NL, Nordstrom KF, Pranzini E (2004) Evaluation of beach response to submerged groin construction at Marina di Ronchi, Italy using field data and a numerical simulation model. Journal of Coastal Research (33): 99–120. https://www.jstor.org/stable/25736248 https://www.jstor.org/stable/25736248 Black K, Andrews C (2001) Sandy shoreline response to offshore obstacles: Part 1. Salient and tombolo geometry and shape. Journal of Coastal Research, Special Issue 29 Natural and Artificial Reefs for Surfing and Coastal Protection, (29), 82–93. https://www.jstor.org/stable/25736207 Bowman D, Arad D, Rosen DS, Kit E, Goldbery R, Slavicz A (1988) Flow characteristics along the rip current system under low-energy conditions. Marine Geology 82(3–4): 149–167. https://doi.org/10.1016/0025-3227(88)90138-7 Brander RW, Short AD (2000) Morphodynamics of a large-scale rip current system at Muriwai Beach, New Zealand. Marine Geology 165(1–4): 27–39. https://doi.org/10.1016/S0025-3227(00)00004-9 Cammelli C, Jackson NL, Nordstrom KF, Pranzini E (2006) Assessment of a gravel nourishment project fronting a seawall at Marina di Pisa, Italy. Journal of Coastal Research (39): 770–775. https://www.jstor.org/stable/2574168 https://www.jstor.org/stable/2574168 Cappietti L, Sherman DJ, Ellis JT (2013) Wave transmission and water setup behind an emergent rubble-mound breakwater. Journal of Coastal Research 29(3): 694–705. https://doi.org/10.2112/JCOASTRES-D-12-00166.1 Cornett A, Mansard E, Funke E (1993) Wave transformation and load reduction using a small tandem reef breakwater—physical model tests. Ocean wave Measurement and Analysis, Proceedings of the International Conference on Waves-93, New Orleans, 1008–1023 Coghlan IR, Carley JT, Cox RJ, Blacka MJ, Mariani A, Restall S, Hornsey W, Sheldrick S (2009) Two-dimensional physical modelling of sand filled Geocontainers for coastal protection. Proceedings of Australasian Coasts and Ports Conference, Wellington, 295–301. https://doi.org/10.3316/informit.862603013166460 Dattatri J, Sankar NJ, Raman H (1978) Performance characteristics of submerged breakwaters. Proceedings of the 16th Coastal Engineering Conference, Hamburg, Germany, 2153–2171. https://doi.org/10.1061/9780872621909.132 Dassanayake DT, Oumeraci H (2013) Hydraulic stability formulae and nomograms for coastal structures made of geotextile sand containers. Proceedings of the 7th International Conference on Asian and Pacific Coasts, Bali, Indonedia, 24–26. DOI: https://doi.org/10.1142/9789914277426_0315 Fairley I, Davidson M, Kingston K (2009) The morpho-dynamics of a beach protected by detached breakwaters in a high energy tidal environment. Journal of Coastal Research, SI 56 (Proceedings of the 10th International Coastal Symposium): 607–611. Gallerano F, Cannata G, Palleschi F (2019) Hydrodynamic effects produced by submerged breakwaters in coastal area with a curvilinear shoreline. Journal of Marine Science and Engineering, 7(10): 337. https://doi.org/10.3390/jmse7100337. Gomes G, da Silva AC (2014) Coastal erosion case at Candeia Beach (NE-Brazil). Journal of Coastal Research 71(10071), 30–40. https://doi.org/10.2112/SI71-004.1 Groenewoud M, Van der Graaff J, Claessen E, Van der Beizen S (1996) Effect of submerged breakwater on profile development. Proceedings 25th International Confernce on Coastal Engineering, Orlando, 2428–2441. https://doi.org/10.1061/9780784402429.188 Heerten G (1980) Long-term experiences with the use of synthetic filter fabrics in coastal Engineering. Proceedings of 17th International Conference on Coastal Engineering (ICCE), Sydney, Australia, 2174–2193. https://doi.org/10.1061/9780872622647.131 Heibaum M (2004) Cost effective construction methods using geosynthetic containers. Proceedings EuroGeo3-3rd European Geosynthetics Conference, München, 1–3. Hervouet JM, Ata R (2017) User manual of open source software TELEMAC-2D. Technical Report, EDF-R & D. http://www.opentelemac.org/ Homma M, Horikawa K (1961) A study on submerged breakwaters. Coastal Engineering in Japan 4(1): 85–102. https://doi.org/10.1080/05785634.1961.11924610 Hornsey WP, Carley JT, Coghlan IR, Cox RJ (2011) Geotextile sand container shoreline protection systems: Design and application. Geotextiles and Geomembranes 29(4): 425–439. https://doi.org/10.1016/j.geotexmem.2011.01.009 Hudson RY (1956) Laboratory investigation of rubble-mound breakwaters. Journal of the Waterways and Harbors Division 85(3): 93–118. https://doi.org/10.1061/JWHEAU.0000142 Hunt Jr IA (1959) Design of seawalls and breakwaters. ASCE Journal of the Waterway and Harbours Division 85(3): 123–152. https://doi.org/10.1061/JWHEAU.0000129 Jackson LA, Tomlinson R, McGrath J, Turner I (2002) Monitoring of a multi-functional submerged geotextile reef breakwater. Proceedings of 28th International Conference on Coastal Engineering, Cardiff, Wales, UK, 1923–1935. https://doi.org/10.1142/9789812791306_0162 Johnson JW, Fuchs RA, Morison JR (1951) The damping action of submerged breakwaters. Eos, Transactions American Geophysical Union 32(5): 704–718. DOI: https://doi.org/ 10.1029/TR032i005p00704 Klonaris GT, Metallinos AS, Memos CD, Galani KA (2019) Experimental and numerical investigation of bed morphology in the lee of porous submerged breakwaters. Coastal Engineering 155: 103591. https://doi.org/10.1016/j.coastaleng.2019.103591 Koerner G, Koerner R (2006) Geotextile tube assessment using a hanging bag test. Geotextiles and Geomembranes 24(2): 129–137. https://doi.org/10.10167/j.geotexmem.2005.02.006 https://doi.org/10.1016/j.geotexmem.2005.02.006 Kohlhase S (1997) Some aspects of the use of geotextiles in the field of coastal engineering. Proceedings of the first German-Chinese Joint Seminar — Recent Developments in Coastal Engineering, Hasenwinkel, Germany, 235–265 Lenze B, Heerten G, Saathoff F, Stelljes K (2002) Geotextile sand containers — Successful solutions against beach erosion at sandy coastsand scour problems under hydrodynamic loads. Proceedings of the Sixth International Conference Littoral 2002, The Changing Coast. EUROCOAST/EUCC, Porto, Portugal, 375–381 Lokesha, Sannasiraj SA, Sundar V (2018) Experimental studies on hydrodynamic performance of an artificial reef. Proceedings of the Fourth International Conference in Ocean Engineering (ICOE2018), Singapore, 23, 549–558. https://doi.org/10.1007/978-981-13-3134-3_41 MacMahan J, Thornton EB, Stanton TP, Reniers AJHM (2005) RIPEX: —rip currents on a shore-connected shoal beach. Marine Geology, 218(1): 113–134. DOI: https://doi.org/ 10.1016/j.margeo.2005.03.019 Mori E, D'eliso C, Aminti PL (2008) Physical modelling on geotextile sand container used for submerged breakwater. Proceedings of 2nd international Conference on the Application of Physical Modelling to Port and Coastal Protection, Coastlab08, Bari, Italy Oumeraci H, Bleck M, Hinz M, Kübler S (2002b) Large-scale investigations into the hydraulic stability of geotextile sand containers under wave loading. Leichweiss-Institute for Hydraulic Engineering and Water Resources, Report Nr. 878, Braunschweig, Germany (in German) Oumeraci H, Bleck M, Hinz M, Möller J (2002c) Theoretische Unter suchungenzur Anwendung geotextiler Sand containerim Küstenschutz ("Theoretical studies on the use of geotextile sand containers in coastal protection"). Leichweiss-Institute for Hydraulic Engineering and Water Resources, Report Nr. 866, Braunschweig, Germany (in German) Oumeraci H, Hinz M, Bleck M, Kortenhaus A (2003) Sand-filled geotextile containers for shore protection. Proceedings of 6th conference of Coastal and port Engineering in Developing Countries. COPEDEC VI, Colombo, Sri Lanka, 1–15 Ranasinghe R, Turner IL (2006) Shoreline response to submerged structures: A review. Coastal Engineering 53(1): 65–79. https://doi.org/10.1016/j.coastaleng.2005.08.003 Ranasinghe R, Turner IL, Symonds G (2006) Shoreline response to multi-functional artificial surfing reefs: A numerical and physical modelling study Coastal Engineering 53(7): 589–611. https://doi.org/10.1016/j.coastaleng.2005.12.004 Recio J (2007) Hydraulic stability of geotextile sand containers for coastal structures-effect of deformations and stability formulae. PhD thesis, Leichweiss-Institute for Hydraulic Engineering Water Resources, Braunschweig, Germany, 167–174. DOI: https://doi.org/10.24355/dbbs.084-200802050100-0 Recio J, Oumeraci H, Mocke G (2010) Stability formula and numerical model for structures made with geotextile sand containers used for coastal stabilization. 2nd International Conference on Coastal Zone Engineering and Management (Arabian Coast 2010), Muscat, Oman Shepard FP, Inman DL (1950) Nearshore circulation. Proceedings of the 1st Coastal Engineering Conference, New York, 50–59 Shin EC, Oh YI (2007). Coastal erosion prevention by geotextile tube technology. Geotextiles and Geomembranes 25(4–5): 264–277. https://doi.org/10.1016/j.geotexmem.2007.02.003 Short AD, Hogan CL (1994) Rip current and beach hazards: their impact on public safety and implications for coastal management. Journal of Coastal Research, Special Issue 12, 197–209. https://www.jstor.org/stable/25735599 Sonu CJ (1972) Field observation of nearshore circulation and meandering currents. Journal of Geophysical Research 77(18): 3232–3247. https://doi.org/10.1029/JC077i018p03232 Stauble DK, Tabar JT (2003) The use of submerged narrow-crested breakwaters for shoreline erosion control. Journal of Coastal. Research 19(3): 684–722. https://www.jstor.org/stable/4299207 https://www.jstor.org/stable/4299207 Thomalla F, Vincent CE (2003) Beach response to shore-parallel breakwaters at Sea Palling, Norfolk, U.K. Estuarine, Coastal and Shelf Science 56(2): 203–212. https://doi.org/10.1016/S0272-7714(02)00157-9 Turner IL, Leyden VM, Cox RJ, Jackson LA, McGrath J (2001) Physical model study of the Gold Coast artificial reef. Journal of Coastal Research Special Issue 29: 131–146. https://www.jstor.org/stable/25736211 https://www.jstor.org/stable/25736211 Twu SW, Liu CC, Hsu WH (2001) Wave damping characteristics of deeply submerged breakwaters. ASCE Journal of Waterway, Port, Coastal, and Ocean Engineering 127(2): 97–105. https://doi.org/10.1061/(ASCE)0733-950X(2001)127:2(97) Van Rijn LC (1989) Handbook: sediment transport by currents and waves Tech. Report H 461, Delft Hydraulics Laboratory, The Netherlands U. S. Army Corps of Engineers (2006) Coastal engineering manual. U.S. Army Corps of Engineers, Washington, D.C. Wouters J (1998) Open Taludbekleidingen; Stabiliteit van Geosystems (Stability of Geosystems). Delft Hydraulics Report, No. H1930, Delft, The Netherlands