Wave Energy Potential Analysis in the Casablanca-Mohammedia Coastal Area (Morocco)
https://doi.org/10.1007/s11804-022-00261-2
-
Abstract
In the last two decades, the exploitation of marine renewable energies (70% of the globe is made up of oceans), especially wave energy, has attracted great interest, not only for their high potential, but also for their high energy density. The development of wave energy is suitable for countries or regions with extensive coastline and high waves approaching the shore. This paper focuses on the study of wave potential and wave energy distribution in the Casablanca-Mohammedia nearshore area (Moroccan Atlantic coast) in order to identify prospective wave energy hotspots. To achieve this purpose, the offshore wave potential was firstly estimated from a 20 years wave data provided by ECMWF (European Center for Medium range Weather Forecasts). In the second step, a numerical modeling of the wave propagation in the study area was performed using the SWAN model jointly with WAVEWATCHIII. The performance of the model to simulate accurately the wave field was evaluated in a real situation characterized by large waves. The model then was applied to determine the patterns of wave field in the Casablanca-Mohammedia nearshore area for a typical wave conditions (winter, summer and storm). The results of this study show the abundance of wave energy in the region with an average annual wave potential of about 22 kW/m. A seasonal variability of the wave resource was demonstrated, with values five times higher in winter than in summer. In addition, a major hotspot site was identified that should be considered when studying WEC implementation. This hotspot is located at the southern edge of the Casablanca-Mohammedia coast, near the coastal area of Sidi Rahal.Article Highlights• Wave model validation with buoy measurements.• The model was then used to identify wave energy hotspots in the area of interest.• Two third generation wave models (WAVEWATCHIII and SWAN) were used to study the evolution of the waves.• 20 years wave data, retrieved from ERA-5 dataset, and was used to draw up the wave climate in Casablanca-Mohammedia coast. -
1 Introduction
Electricity consumption in the world is mainly due to the growth of economic activity, industrialization and production techniques, increasing population, and welfare improvement. Morocco, like most countries in the word, is experiencing a significant growth in electricity consumption, with an average rate of 6.9% per year (Office National de l'Electricité. ONE 2010). This increase necessitates the exploitation of renewable and sustainable energy resources.
Nowadays, the energy sector in Morocco depends heavily on imports, about 90% of its energy needs are imported (Aparicio 2014). In this respect, the Moroccan government has put in place an ambitious energy plan, called the National Energy Strategy (NES) (Alhamwi et al. 2015). Its main objective is to increase the input of renewable energy resources into the national grid to 52% of electricity generated from renewable energy sources by 2030 (IRENA 2014; Alhamwi et al. 2015).
The NES has identified wind, hydro and solar as "high priority" resources to establish an ambitious renewable energy program. However, the presence of a coastline of 3 500 km, the country has a high potential of marine renewable energy (Alaoui 2019), which makes it a country with several sites for the exploitation of marine renewable energy (MRE).
Over the last few years, a big interest has been given to MRE (70% of the earth surface is covered by ocean). Among the potential sources of MRE, wave energy is considered as one of the energy sources with the greatest potential for development over the next few years (Iglesias et al. 2009). It may be seen as a condensed form of ocean wind energy (Akpinar et al. 2017). Wave energy development is suitable for countries or regions with extensive coastline and strong waves approaching the coast (Zhang et al. 2009).
According to (Sierra et al. 2016), the average wave power obtained along the Moroccan Atlantic coast is considerable (up to 30 kW/m, which is equivalent to annual wave energy of 262 MWh/m) and slightly lower than that of the neighboring Canary Islands. The spatial distribution of wave energy shows great variability, with a high energy stretch in the central part of this area (between latitudes 29.3° N and 34° N). The present work focuses on the anlysis of wave energy resource in the Casablanca-Mohammedia coast area (Moroccan Atlantic coast). The wave energy was characterized thoroughly in terms of wave directions, heights and periods based on numerical modeling, and using ECMWF (European Center for Medium range Weather Forecasts) ERA5 data-set.
Due to the advances in computer science, wave energy assessment uses numerical models capable of accounting for the physics of wave propagation in the deep and shallow waters. Within this context, spectral wave models such as Mike 21 (Vannucchi et al. 2012; Venugopa et al. 2017), SWAN (Simulating WAve Nearshore) (Bento et al. 2018; Carballo et al. 2014; Kamranzad et al. 2013; Amarouche et al. 2020), and WAVEWATCHIII (WWIII), WAM (WAve Model) (Rusu and Guedes Soares 2012; Zheng et al. 2013; Waters et al. 2009), and TOMAWAC (Dong et al. 2020; Guillou 2015), have been applied to assess and forecast global coastal wave resources at various locations.
To date, a very few studies explored the wave energy potential around the Moroccan waters.
As far as the authors know, the existing studies investigated the wave energy availability on a large scale using a deep water models (WAM and WAVEWATCHIII) (Bouhrim and El Marjani 2019; Sierra et al. 2016). The main novelty of this work is to study the wave energy on a local scale by the use of state-of-the-art coastal model SWAN. The studied area is the most important coastal stretch, in an economic view, and the most populated region of the kingdom. The main goal of the work is to prospect the most favorable areas (hotspots) for implementing wave energy farms.
To achieve this objective, the SWAN model was implemented to simulate the wave parameters during its propagation in the Casablanca-Mohammedia nearshore area. The SWAN model was previously used in many research studies in order to identify the wave energy hotspots sites (Iglesias and Carballo 2010; Lin et al. 2019; Majidi et al. 2020; Vannucchi and Cappietti 2016).
2 Wave models and data description
2.1 The study area
Morocco has an interesting geographical position. It is located at the crossroads between Africa and Europe (32°00'N 5°00'W). It is bordered by the Mediterranean and the Atlantic seas. The region concerned by the simulation includes the site of Casablanca-Mohammedia located at the northwest of Morocco on the Atlantic coastline. This coastal stretch has a NW-NE orientation, and is consequently exposed to waves coming from NW sector. The model zone extends longitudinally from 7° 2'W to 8° W, and at latitude from 33°45'N to 34°N. This area is characterized by a regular bathymetry showing a slope going down to the sea. The isobath is appreciably parallel to the coast, they vary from 5 m at the coast and 269 m offshore (Figure 1). This quasi-regular isobaths configuration is perturbed in the extreme south by the presence of submarine ridge extending about 11km from coastline. Moreover, we notice the presence of three very marked capes (Cap Dar Bouazza, cap Elhank, cap Fedala), these latter are elongated seawards by submarine ridges (D1, D2, D3 and D4). There exist also six shoals (H1, H2, H3, H4, H5, and H6) (Mouakkir et al. 2010) where water depth is nearly 28 m (Figure 1).
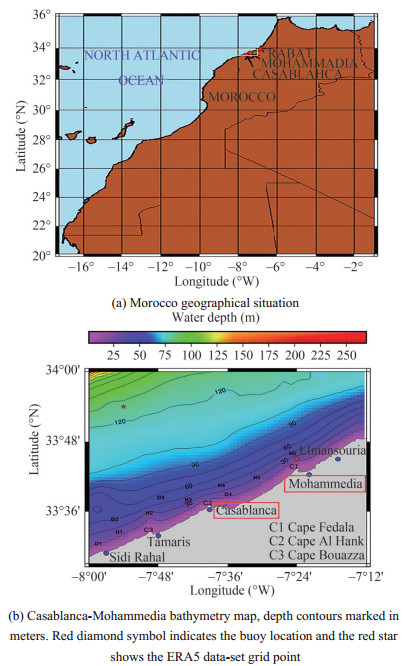 Figure 1 Study area location
2.2 Modeling tools
2.2.1 SWAN model description
In order to force SWAN with a real wave boundary conditions, WWIII model was set up for the north atlantic area (Figure 2). It is a third-generation wave model developed at NOAA/NCEP (National Oceanic and Atmospheric Administration/National Centers for Environmental Prediction)(The WAVEWATCHIII DevelopmentGroup, 2019).
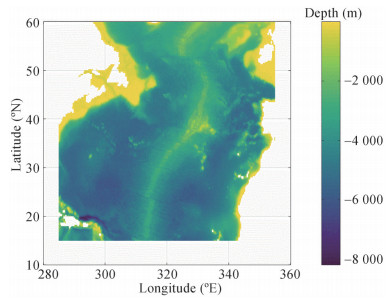 Figure 2 WAVEWATCHIII computational domain with ETOPO1 bathymetry used to force the model, water depths are in meter
The analysis of the wave energy potential in the present study was developed based on the third generation wind-wave model SWAN version 41.20 (Booij et al. 1999; Mouhid et al. 2020; SWAN Team 2018). It is a numerical wave model that provides realistic estimates of wave parameters in open seas, coastal areas, lakes, and estuaries from given wind, bottom, and current conditions (Booij et al. 1999). The SWAN model computes the development of a sea states by means of the wave action density N(σ, ϴ), which is defined by the ratio of the spectral energy density E(σ, ϴ) to the intrinsic representative wave frequency σ. In SWAN model, the evolution of the wave spectrum is described by the spectral action balance expressed by the following equation:
$$ \frac{\partial N}{\partial t}+\frac{\partial C_{x} N}{\partial x}+\frac{\partial C_{y} N}{\partial y}+\frac{\partial C_{\sigma} N}{\partial \sigma}+\frac{\partial C_{\theta} N}{\partial \theta}=\frac{S_{\text {tot }}}{\sigma} $$ (1) where x and y are horizontal Cartesian coordinates, t is the time, θ is the propagation direction of each wave component, Cx, Cy, Cσ, and Cθ are the propagation velocity in x-space, y-space, σ-space, and θ-space respectively, and Stot represents the energy source. The first term on the left-hand side of Equation (1) is the rate of change of action density in time, the second and third terms are the propagation of action in physical space. Term 4 represents the shifting of the relative frequency due to the variation of depth and current. Term (5) represents depth-induced and current-induced refraction.
The item Stot on the right side of this equation includes dissipations, quadruplet interaction, and triad interaction caused by wind input, white-capping, bottom friction, and depth-induced wave breaking. Details of these processes can be found in the SWAN technical documentation manual (SWAN Team 2018).
2.2.2 Wave energy flux
The deformation of the surface water caused by wind and the transmitted water particles, give the swell a mechanical Energy. This energy is the sum of the potential and kinetic energy; it is considered as the total energy Contained in a wavelength per linear meter of Crest (Bonnefille 1992; Holthuijsen 2007). This energy is expressed by:
$$ E=\frac{1}{8} \rho_{w} g H^{2} $$ (2) The wave power, flux of energy per unit crest, in terms of wave spectrum can be defined using the spectral output of the numerical wave model as energy flux per wave crest width unit in kW/m (Cornett et al. 2008; Sheng et al. 2017) as:
$$ P_{x}=\rho g \iint C_{x} E(\sigma, \theta) \mathrm{d} \sigma \mathrm{d} \theta $$ (3) $$ P_{y}=\rho g \iint C_{y} E(\sigma, \theta) \mathrm{d} \sigma \mathrm{d} \theta $$ (4) where x and y represent the problem coordinate system, Cx and Cy the propagation velocities of wave energy in the geographical space. The absolute value of energy transport (denoted also as wave power Pw) will be:
$$ P_{w}=\sqrt{P_{x}^{2}+P_{y}^{2}} $$ (5) In deep water condition (d > 0.5 L), the Equation (2) becomes (Cornett et al. 2008; Randi et al. 2012):
$$ P_{w}=\frac{\rho g^{2}}{64 \pi} H_{s}^{2} T_{e} \approx(0.49) H_{s}^{2} T_{e} $$ (6) The unit of wave power in Equation (6) is Kilowatts (kW) per meter (m) of wave front length as the significant wave height is given in meters and the wave period is in seconds. In this study, the Equation (6) is used to calculate the wave power.
ρ is the seawater density taken as 1 027 kg/m3, g is the acceleration of gravity, Hs is the significant wave height and Te is the wave energy period. Hs and Te are defined as:
$$ H_{s}=4 \sqrt{\int_{0}^{2 \pi} \int_{0}^{\infty} E(\omega, \theta) \mathrm{d} \omega \mathrm{d} \theta} $$ (7) $$ T_{e}=2 \pi \frac{\int_{0}^{2 \pi} \int_{0}^{\infty} E(\omega, \theta) \mathrm{d} \omega \mathrm{d} \theta}{\int_{0}^{2 \pi} \int_{0}^{\infty} \omega E(\omega, \theta) \mathrm{d} \omega \mathrm{d} \theta} $$ (8) The mean wave direction may be obtained from the directional wave energy spectrum through:
$$ \theta_{m}=\tan ^{-1}\left[\frac{\int_{0}^{2 \pi} \int_{0}^{\infty} \sin (\theta) E(\omega, \theta) \mathrm{d} \omega \mathrm{d} \theta}{\int_{0}^{2 \pi} \int_{0}^{\infty} \cos (\theta) E(\omega, \theta) \mathrm{d} \omega \mathrm{d} \theta}\right] $$ (9) where E(ω, θ) is the variance density spectrum and ω is the absolute radian frequency equaling to the relative frequency σ when no ambient currents are present, it can be determined by the Doppler-shifted dispersion relation in the presence of the ambient current.
2.3 Forcing data and models setup
The model bathymetry is based on the ETOPO (www.ngdc.noaa.gov/mgg/global) global bathymetric data. ETOPO are the digital terrain elevation data released by the United States NGDC, including data about land elevation and sea bottom topography.
Figure 1 shows also the ETOPO bathymetry of the considered area. The wave climate in the general area of Casablanca–Mohammedia was drawn up using ECMWF (European Center for Medium range Weather Forecasts) ERA5 data-set (Hersbach et al. 2020). This global dataset provides an accurate and reliable time series describing the past wave climate and used in many studies for wave energy assessment on the global and regional scales (Amrutha et al. 2020; Mahmoodi et al. 2019; Rusu and Rusu 2021).
The wave time series spans twenty years and covers the period 2001-2020. The wave climate analysis was based on a standard wave parameter (significant wave height Hs, peak wave period Te, and mean direction θm).
A Datawell buoy observations provided by Meteorological General Direction (MGD Morocco), were exploited to test the performance of SWAN model to simulate the propagation of waves in the nearshore area. The location of the buoy is indicated in the Figure 1 with a red diamond symbol.
In order to force SWAN with a real wave boundary conditions, WWIII model was set up for the north Atlantic area presented in the Figure 2. The source term physics package used in the present study is ST2 (Tolman and Chalikov 1996). Table 1 summarizes the main setting parameters of WWIII model. The weather forcing data of WWIII are extracted from ERA5 data-set with 0.25°×0.25° spatial resolution and 1 hour time step.
Table 1 Main settings of WWIII implemented in the present studySpatial resolution Frequency resolution Directional resolution Wind input source term Δx=0.5° 25 bin 24 bin ST2 Δy=0.5° Nx=281 fmin=0.041 18 Hz Ny=181 fmax=0.405 61 Hz In this study, the SWAN cycle Ⅲ version 41.20 was used for wave simulations. The model was executed in both stationary and non-stationary modes. The spectral directions cover the full circle. The resolution in θ-space is 10° for the variable θ and 32 frequencies. The lowest frequency is fixed at 0.052 1 Hz and the highest at 1 Hz. The non-stationary application of SWAN was forced by winds retrieved from ERA5 database. While in the stationary mode, it was implemented without considering the effect of winds on the incident waves as in (El Mekadem et al. 2011) and (Hemdane et al. 2016). The SWAN physical processes during the wave simulation are wave generation, quadruplet nonlinear interaction, dissipation by friction on the bottom. The parameterization of the friction used for our simulations is that of Madsen. The simulations also take into account the effects of diffraction as well as wavewave interactions.
3 Wave climate and wave simulations
3.1 Offshore wave climate and wave energy
The study of data on the wave climate in the general area of Casablanca was drawn up using ECMWF (European Center for Medium range Weather Forecasts) ERA5 dataset. The wave climate analysis was based on a standard wave parameter (significant wave height, peak wave period, and mean wave direction) covering the period 2001-2020.
Figure 3 depicts the wave-rose off Casablanca-Mohammedia coast. The deep-water waves reaching the area of interest come mainly from NW and NNW directions. The dominant heights are in the interval [1.0-2.0 m] with about 62% of probability. As far as wave periods concerning, the most frequent are in the interval [12-15 s] with about 35% of frequency, followed by those in the intervals [10-12 s] and [8-10 s] respectively (frequencies 27% and 20%). Table 2 summarizes the yearly and seasonal mean wave parameters in the study area. Both observed mean significant wave height and wave energy period are significantly higher during winter months (Hs= 2.3 m, Te= 11.8 s) than in summer period (Hs= 1.3 m, Te= 8 s).
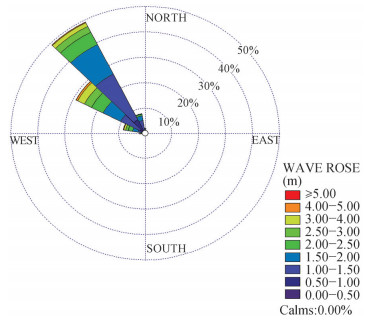 Figure 3 Wave-rose offshore the studied zoneTable 2 Annual and seasonal mean wave characteristics calculated at Casablanca-Mohammedia offshore area
Time Wave height Hs (m) Energy period Te (s) Mean wave direction θm (°) Wave power Pw (kW/m) Annual 1.8 10.7 310 22.4 Winter 2.3 12.4 304 38.5 Spring 1.8 10.8 305 22.3 Summer 1.3 8.5 321 8.0 Autumn 1.7 11.0 309 21.0 Based on the ERA5 wave data and using the Equation (6), the wave potential was calculated for the point (33.95° N8° W). The estimated wave energy potential in Casablanca provides a good resource for wave conversion with an estimated mean annual wave power of 22.4 kW/m with a maximum value of 37.1 kW/m in winter. The previous potential is characterized by a noticeable seasonal variability culminating at winter months (Table 2). The observed wave energy during winter months is five times higher than the quantity occurring during summer period. The corresponding theoretical annual wave energy is about 196 MWh/y. The results obtained in this study are in good agreement with those presented by Bouhrim and El Marjani (2019) and Sierra et al. (2016).
To design of a suitable WEC for a selected site, the so-called scatter diagram defined by wave height Hs and energy period Te bins is a fundamental tool. Figure 4 illustrates the wave energy scatter diagram of Casablanca-Mohammedia coast. Wave height bins have 0.5 m width and energy period bins 0.5 s width. We note the fact that wave energy is concentrated in wave with Hs between 2.0 and 3.0 m, and Te between 10.5 s and 12.0 s. The most energetic waves are those with 2.5 m of Hs and 11 s of Te.
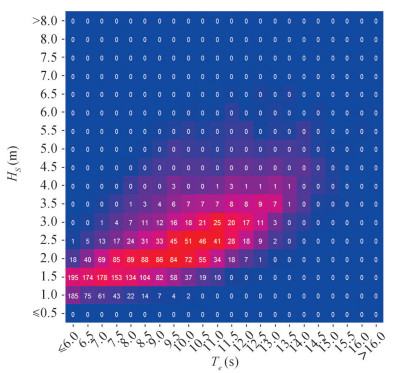 Figure 4 Wave energy Scatter diagram in terms of Hs and Te for Casablanca-Mohammedia coast
3.2 SWAN model simulations
In order to evaluate the SWAN model, a wave buoy is installed in the study area (33° 44'81"N – 7° 23'2"W) (Figure 1). For this purpose, a simulation covering a period of 8 days period was conducted. The selected period spans from 01/01/2008 to 08/01/2008 and includes a heavy storm on 04/01/2008, with a significant wave height culminating at 8 m. The numerical models were forced by the ERA5 reanalyzed wind field corresponding to 10 m wind components (U10 and V10). A six-day period, starting from 26/12/2007, to spin-up the wave models was firstly performed.
The values of significant wave height computed by the SWAN model for the location of the buoy are compared with the actual buoy measurements in Figure 5. We notice that there is a good agreement between the model results and measurements throughout the simulation period, including the build-up of the storm, its peak (around noon of 04/01/2008). The correlation coefficient between the buoy and the model data is 0.94 for the wave height and 0.90 for the wave energy flux. The Figure 5 shows a comparison graphs depicting the model wave height, and energy versus observed data. The graphs demonstrate that, in general, the large wave event is well captured by the simulation. However, the peak of the episode was slightly underestimated by SWAN by less than 1m with three hours delay.
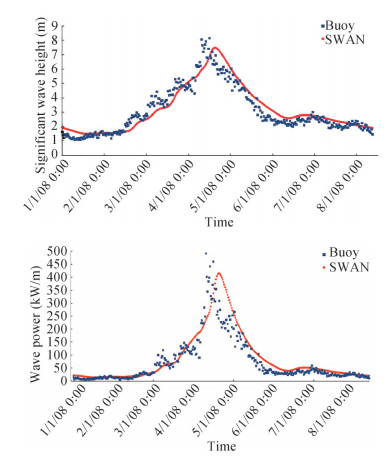 Figure 5 Significant wave height Hs and wave power Pw obtained with the SWAN model, and to buoy data observation from 01/01/08 at 0000GMT to 08/01/2008 at 0900GMT
The modeled wave parameters (significant height, period, direction) and wave energy flux fields were provided at thirty minutes time step. The figure 6 illustrates the spatial distribution of the significant height wave energy flux relative to the conditions at 15:00 GMT, on 04/01/2008 i.e. the peak of a strong storm recorded during 2008. The forecasted wave heights are between 8.0-8.5 m offshore and in the range 6.5-7.5 m nearshore (Figure 6(a)). The observed waves come mainly from NW direction.
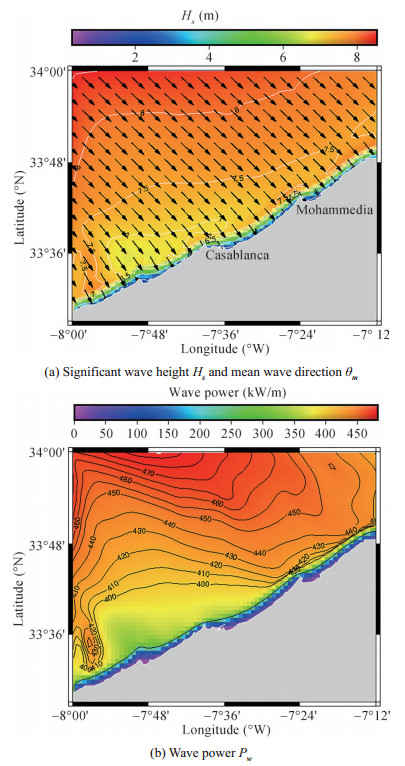 Figure 6 Spatial distribution of Hs and Pw simulated by SWAN on 04/01/08 at 1500UTC
In term of wave energy flux (Figure 6(b)), the values are more pronounced in deep waters and decrease towards the shore. The maximum energy flux is around 480 kW/m in the northern edge of the studied domain. We note a nearshore high energy area situated north of Cap Fedala with values between 400-440 kW/m. South of Cap Fedala, the wave energy is generally low except in Sidi Rehal nearshore area, where wave energy arises locally and reaches 440 kW/m. This area, as mentioned in the section 2.1, contains a pronounced submarine ridge that probably led to a local wave energy concentration.
Having tested the coastal wave model in real conditions, it was applied to identify the location of the nearshore hotspots in the Casablanca-Mohammedia coast. For this purpose, the nearshore wave patterns were computed in three case studies. The first two are representative of a characteristic winter and summer situations, and the third, of a heavy storm conditions. These synthetic wave conditions were selected based on the wave climate analysis done in the section 3.1.
For the simulation results, the first case study I, represents a typical winter wave condition (Hs=2.3 m, Te=12.4 s, θ0=304°). The Figures 7(a) and 7(b), show the wave field, and wave energy flux simulated by SWAN in Mohammedia-Casablanca for this first case study. The wave heights are generally in the interval 2-2.2 m. In the extreme south, nearshore Sidi Rahal, significant height exceeds 2.3 m. As far as the wave energy flux, in the nearshore area, the values are in the range 20- 25 kW/m. We note a remarkable area of energy concentration located in the southern part of the coast in front of Sidi Rahal area, where wave energy rises significantly to 30-35 kW/m. This increase is equivalent to about 17% of the offshore wave energy.
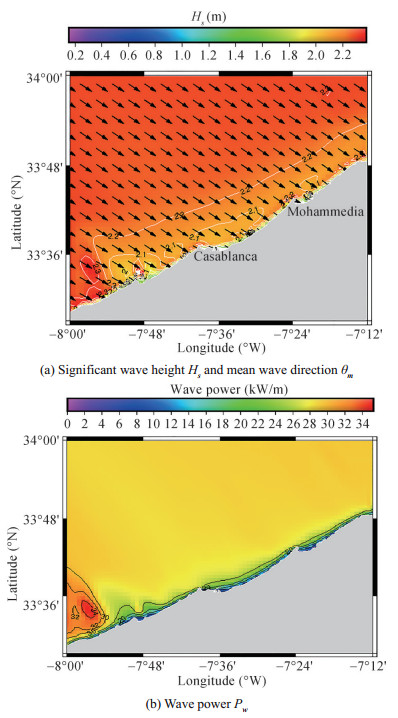 Figure 7 Spatial distribution of Hs and Pw for the case study I (Hs =2.3 m, Te=12.4 s, θ0=304°)
The second case study Ⅱ represents a typical summer wave condition (Hs =1.3 m, Te =8.5 s, θ0=321°). The wave height as well as wave flux in the nearshore region are significantly low (Figures 8(a) and 8(b)) with Hs between 1-1.2 m (4-6 kW/m), except in the southern extremity where Hs arises slightly above 1.2 m (about 7 kW/m).
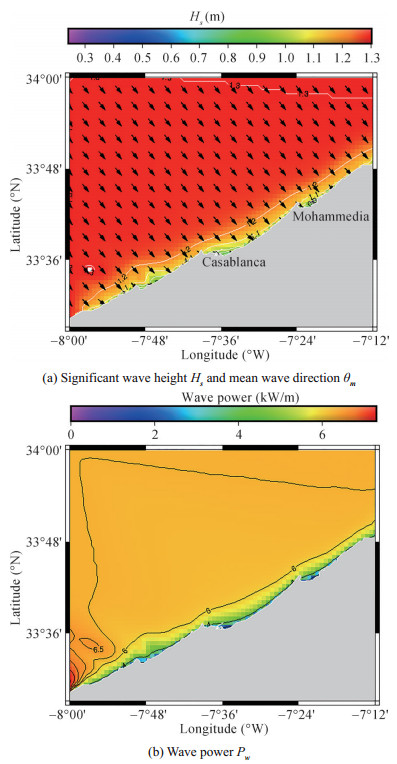 Figure 8 Spatial distribution of Hs and Pw for the case study Ⅱ (Hs =1.3 m, Te =8.5 s, θ0=321°)
Finally, the case study Ⅲ representing a typical storm waves (Hs =4.2 m, Te =17 s, θ0=259°) was considered. These conditions, extracted from ERA5 reanalysis, correspond to a real situation occurred on 28/02/18 at 15: 00 GMT. This situation is characterized by West-South Westerly (WSW) waves and was intentionally selected to study the WSW wave's transformation due to the local seabed. The simulation results of the last case study are given in Figures 9(a) and 9(b). The wave height, close to the shore, is between 3-3.6 m. We observe in the vicinity of the capes an increase of wave heights reaching 3.6-4 m. An area of wave accentuation is visible in the southernmost part of the coast.
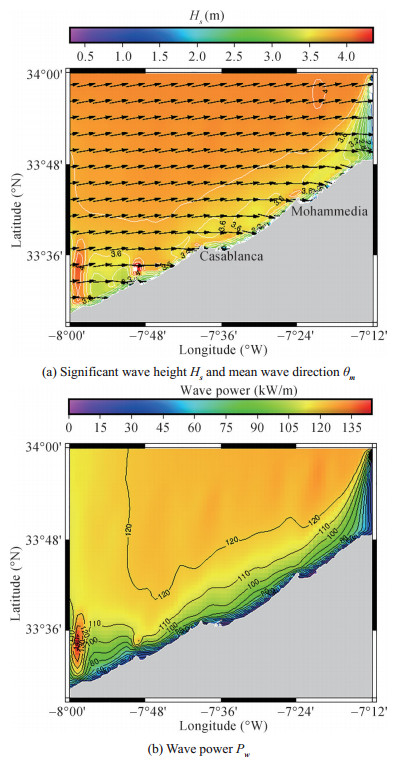 Figure 9 Spatial distribution of Hs and Pw for the case study Ⅲ (Hs =4.2 m, Te =17 s, θ0=259°)
The wave energy flux is mainly in the range 80-110 kW/m, except in the aforementioned area. In this zone, the wave potential amounts to 100-140 kW/m. This demonstrates that even WSW waves are affected by the submarine ridge D1. Thus, the wave transformation leads to wave energy concentration even in WSW wave condition.
In conclusion, it is apparent that as the waves propagate from the sea to the coast, the wave height gradually decreases, however, this general trend is not verified in some coastal areas where the bathymetry leads to a concentration of wave energy and therefore an increase in wave height. This remark is observed in the vicinity of the Cape Dar Bouazza, precisely around the ridges D1 and D2 as well as the shoals H1 and H2. This observation is clearly visible on the longitudinal sections that pass through the three graphical capes, i.e., an increase in height as it moves from the open sea to the coast (Figure 10). (Idrissi et al. 2004) previously studied the evolution of wave in the studied region using a computer code developed by (Nicholas and Germain 1993). Based on this code, which considers the refraction of the waves, the wave orthogonals were drawn up in the coastal area. The study revealed that the convergence of the wave orthogonals, producing a concentration of wave energy, is observed behind the submarine ridges (D) and at the shoals (H). This finding may explain the remarkable increase of wave energy in the aforementioned hotspot located in front of Sidi Rehal due to the presence of the large submarine ridge (D2).
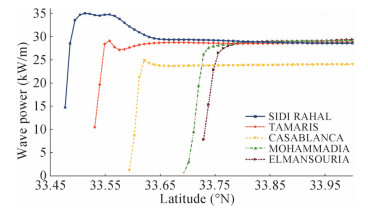 Figure 10 Wave power simulated by SWAN along five longitudinal sections for the first case study (winter)
4 Conclusion
Currently, only 10% of energy needs in Morocco are satisfied by renewable energy, mainly hydraulic, wind and solar energy. However, with its geographical position, bordered by two seas: the Atlantic Ocean and the Mediterranean Sea, Morocco has a great potential in marine energy.
The present study presents an assessment of the potential wave energy resource in Casablanca-Mohammedia nearshore area (Moroccan Atlantic coast), considered as the most populated region of the country. The wave climate has been presented based on 20 years wave data provided by ECMWF. Afterwards, the SWAN model was used to compute the wave propagation and transformation in the studied area under three typical wave scenarios. The modeling tool was validated with a buoy data, indicating a good agreement between the measurements and the simulations with regard to significant wave heights and wave energy.
The spatial distribution of wave energy in the study area is examined under different conditions (winter, summer, and storm conditions). The results of this study shown in term of wave energy power analysis confirm the abundance of wave energy in the area with an annual mean potential of about 22 kW/m. Moreover, the study demonstrated a clear seasonal variability of the wave resource and that wave power levels are five times higher in winter than in summer. The application of SWAN demonstrated that the wave energy is unequally distributed within the studied area and presents areas with energy concentration.
In addition, an important hotspot site was identified to be taken in consideration when investigating WEC implementation. The hotspot site is located in the southern limit of Casablanca-Mohammedia coast, nearshore Sidi Rahal area.
Acknowledegments: The authors are thankful to General Direction of Meteorology (GDM Morocco) for providing in-situ Buoy wave data in Mohammedia coast.The authors would like to thank the ECMWF (European Center for Medium range Weather Forecasts) ERA5 data-set, for providing the data on the wave climate, and NGDC/NOAA for providing the bathymetry data ETOPO 1 arc-minute. The authors also would like to express their gratitude to the SWAN group at Delft University of Technology for making the model freely available. -
Figure 1 Study area location
Figure 2 WAVEWATCHIII computational domain with ETOPO1 bathymetry used to force the model, water depths are in meter
Figure 3 Wave-rose offshore the studied zone
Figure 4 Wave energy Scatter diagram in terms of Hs and Te for Casablanca-Mohammedia coast
Figure 5 Significant wave height Hs and wave power Pw obtained with the SWAN model, and to buoy data observation from 01/01/08 at 0000GMT to 08/01/2008 at 0900GMT
Figure 6 Spatial distribution of Hs and Pw simulated by SWAN on 04/01/08 at 1500UTC
Figure 7 Spatial distribution of Hs and Pw for the case study I (Hs =2.3 m, Te=12.4 s, θ0=304°)
Figure 8 Spatial distribution of Hs and Pw for the case study Ⅱ (Hs =1.3 m, Te =8.5 s, θ0=321°)
Figure 9 Spatial distribution of Hs and Pw for the case study Ⅲ (Hs =4.2 m, Te =17 s, θ0=259°)
Figure 10 Wave power simulated by SWAN along five longitudinal sections for the first case study (winter)
Table 1 Main settings of WWIII implemented in the present study
Spatial resolution Frequency resolution Directional resolution Wind input source term Δx=0.5° 25 bin 24 bin ST2 Δy=0.5° Nx=281 fmin=0.041 18 Hz Ny=181 fmax=0.405 61 Hz Table 2 Annual and seasonal mean wave characteristics calculated at Casablanca-Mohammedia offshore area
Time Wave height Hs (m) Energy period Te (s) Mean wave direction θm (°) Wave power Pw (kW/m) Annual 1.8 10.7 310 22.4 Winter 2.3 12.4 304 38.5 Spring 1.8 10.8 305 22.3 Summer 1.3 8.5 321 8.0 Autumn 1.7 11.0 309 21.0 -
Akpınar A, Bingolbali B, Van Vledder GP (2017) Long-termanalysis of wave power potential in the Black Sea, based on 31-year SWAN simulations. Ocean Eng 130: 482–497. https://doi.org/10.1016/J.OCEANENG.2016.12.023 Alaoui C (2019) Review and assessment of offshore renewableenergy resources in Morocco'coast line. Cogent Engineering 6: 1–26. https://doi.org/10.1080/23311916.2019.1654659 Alhamwi A, Kleinhans D, Weitemeyer S, Vogt T (2015) Moroccan-National energy strategy reviewed from a meteorological perspective. Energy Strategy Reviews 6: 39–47. DOI: https://doi.org/ 10.1016/j.esr.2015.02.0027 Amarouche K, Akpınar A, Bachari NEI, Houma F (2020) Wave energy resource assessment along the Algerian coast based on 39-year wave hindcast. Renew Energy 153: 840–860 https://doi.org/10.1016/j.renene.2020.02.040 Amrutha MM, Sanil Kumar V (2020) Changes in wave energy in the Shelf Seas of India during the last 40 years based on ERA5 reanalysis data. Energies 13(1): 115. https://doi.org/10.3390/en13010115 Aparicio D (2014) ICEX: El Mercado de las energías renovables en Marruecos. Technical report, ICEX. Ministerio de Economía y Competitividad, Madrid Bento AR, Martinho P, Guedes Soares C (2018) Wave energy assessement for Northern Spain from a 33-year hindcast. Renewable Energy 127: 322–333. https://doi.org/10.1016/j.renene.2018.04.049 Bonnefille R (1992) Cours D'hydraulique Maritime, Masson, Paris. Available at https://infoscience.epfl.ch/record/25376/. Accessed October 2018 Booij N, Ris RC, Holthuijsen LH (1999) A third-generation wave model for coastal regions, part I, model description and validation. J Geophys Res Oceans 104(C4): 764–966. https://doi.org/10.1029/98JC02622 Bouhrim H, El Marjani A (2019) Wave energy assessment along the Moroccan Atlantic Coast. Journal of Marine Science and Application 18: 142–152. https://doi.org/10.1007/s11804-018-00060-8 Carballo R, Sánchez M, Ramos V, Taveira-Pinto F, Iglesias G (2014) A high resolution geospatial database for wave energy exp-loitation. Energy 68: 572–583. https://doi.org/10.1016/j.energy.2014.02.093 Cornett A (2008) A global wave energy resource assessment. Proceedings of the Eighteenth International Offshore and Polar Engineers. Available at https://www.onepetro.org/conference-paper/ISOPE-I-08-370 accessed 9 September 2020. Dong J, Shi J, Zhao J, Zhang C, Xu H (2020) Wave energy assessment in the Bohai Sea and the Yellow Sea based on a 40-Year Hindcast. Water 12: 2087. https://doi.org/10.3390/w12082087 El Mekadem N, Bernabeu Tello AM, El Moutchou B, El Hajjaji K (2011) Aplicación del modelo SWAN para caracterizar el impacto del oleaje sobre la costa: ejemplo para la costa atlántica entre Asilah y Larache (NO Marruecos). Avances en ciencias de latierra 2: 14–25 Guillou N (2015) Evaluation of wave energy potential in the Sea of Iroise with two spectral models. Ocean Engineering 106: 141–151. https://doi.org/10.1016/j.oceaneng.2015.06.033 Hemdane Y, Bouhmadouche M, Atroune F (2016) Identification des zones côtières à fort potentiel en énergie marine renouvelable vagues/houles à travers l'étude de la morphologie côtière et sousmarine et hydrodynamique. Revue des Energies Renouvelables 19(4): 543–552. Hersbach H, Bell B, Berrisford P, Hirahara S, Horányi A, Muñoz-Sabater J, Nicolas J, Peubey C, Radu R, Schepers D (2020) The ERA5 Global Reanalysis. Q. J. R. Meteorol. Soc. 146: 1999–2049. https://doi.org/10.1002/qj.3803 Holthuijsen LH (2007) Waves in oceanic and coastal waters. Cambridge University Press. Available at https://books.google.dz/books/about/Waves_in_Oceanic_and_Coastal_Waters.html?id=4mUsvgAACAAJ&source=kp_book_description&redir_esc=y. (Accessed 28 October 2018) Idrissi M, Ait Laamel M, Hourimeche A, Chagdali M (2004) Impact of the swell on the current morphological and sedimentary evolution of the coastal zone of Casablanca — Mohammedia (Morocco). Journal of African Earth Sciences 39: 541–548. https://doi.org/10.1016/j.jafrearsci.2004.07.009 Iglesias G, Carballo R (2010) Wave energy and nearshore hot spots: the case of the SE Bay of Biscay. Renew Energy 35(11): 2490–2500. https://doi.org/10.1016/j.renene.2010.03.016 IRENA (2014) PanArab renewable energy strategy 2030. International Renewable Energy Agency Available at http://www.irena.org Kamranzad B, Etemad-shahidi A, Chegini V (2013) Assessment of wave energy variation in the Persian Gulf. Ocean Engin-eering 70: 72–80. DOI: https://doi.org/ 10.1016/j.oceaneng.2013.05.027 Lin Y, Dong S, Wang Z, Guedes Soares C (2019) Wave energy assessment in the China adjacent Seas on the basis of a 20-year SWAN simulation with unstructured grids. Renew. Energ 136: 275–295. https://doi.org/10.1016/j.renene.2019.01.011 Mahmoodi K, Ghassemi H, Razminia A (2019) Temporal and spatial characteristics of wave energy in the Persian Gulf based on the ERA5 reanalysis dataset. Energy 187: 115991 Available at https://doi.org/10.1016/j.energy.2019.115991 Majidi AG, Bingölbali B, Akpınar A, Rusu E (2020) Dime-nsionless normalized wave power in the hot-spot areas of the Black Sea. E3S Web of Conferences, 173: 01001. https://doi.org/10.1051/e3sconf/202017301001 Mouakkir L, Smaoui H, Mordane S, Chagdali M (2010) Three-dimensional modeling of hydrodynamics with wave-current interaction: Application to the Casablanca- Mohammedia coast. Journal Physical and Chemical News 55: 74–80. Mouhid M, Mouakkir L, Mordane S, Loukili M, Chagdali M, El Bouni B (2020) Stability of a protection structure by stacking GSC Geosynthetics: Application to the Port of Corisco Equatorial Guinea. Proceeding 4th Computational Methods in Systems and Software, Vol. 1, Advances in Intelligent Systems and Computing, 1294, Springer, Cham Nicholas PH, Germain JP (1993) Etude théorique de la réfraction d'ondes de gravité 4éme journées de l'hydrodynamique, Nantes, France, 255–268 ONE (2010) Programme d'Electrification Rurale Global (PERG). Office National de l'Electricité Rapport Annuel. Maroc: ONE. Available at www.one.org.ma/FR/pages/interne.asp Randi AA, Kwok FC (2012) Atlas of global wave energy from 10 years of reanalysis and hindcast data. Renewable Energy 39: 49–64. https://doi.org/10.1016/j.renene.2011.06.039 Rusu L, Rusu E (2021) Evaluation of the worldwide wave energy distribution based on ERA5 data and altimeter measurements. Energies 14: 394. https://doi.org/10.3390/en14020394 Rusu L, Guedes Soares C (2012) Wave energy assessments in the Azores Islands. Renewable Energy 45: 183–196. https://doi.org/10.1016/j.renene.2012.02.027 Sheng W, Li H (2017) A method for energy and resource assessment of waves in finite water depths. Energies 10: 460. https://doi.org/10.3390/en10040460 Sierra JP, Martín C, Mösso C, Mestres M, Jebbad R (2016) Wave energy potential along the Atlantic coast of Morocco. Renewable Energy 96: 20–32. https://doi.org/10.1016/j.renene.2016.04.071 SWAN Team (2018) Technical Documentation Version 41.20A, Delft University of Technology, Netherlands, http://swanmodel.sourceforge.net/online_doc/swantech/swantech.html The WAVEWATCH IIIR©Development Group (WW3DG) (2019) User manual and system documentation of WAVEWATCH IIIR©version 6.07. Tech. Note 333, NOAA/NWS/NCEP/MMAB, College Park, MD, USA Tolman HL, Chalikov DV (1996) Source terms in a third-generation wind wave model. Journal of Physical Oceanography 6(11): 2497–2518. https://doi.org/10.1175/1520-0485(1996)026<2497:STIATG>2.0.CO;2 https://doi.org/10.1175/1520-0485(1996)026<2497:STIATG>2.0.CO;2 Vannucchi V, Cappietti L, Falcão AFO (2012) Estimation of offshore wave energy potential of the Mediterranean sea and propagation toward a nearshore area. 4th International Conference on Ocean Energy, Dublin Vannucchi V, Cappietti L (2016) Wave energy assessment and performance estimation of state of the art wave energy converters in Italian Hotspots. Sustainability 8: 1300. DOI: 3390/su8121300 Venugopal V, Nemalidinne R, Vögler A (2017) Numerical modelling of wave energy resources and assessment of wave energy extraction by large scale wave farms. Ocean & Coastal Management 147: 37–48. https://doi.org/10.1016/j.ocecoaman.2017.03.012 Waters R, Engstrom J, Isberg J, Leijon M (2009) Wave climate off the Swedish west coast. Renewable Energy 34: 1600–1606. DOI: https://doi.org/ 10.1016/j.renene.2008.11.016 Zheng CW, Pan J, Li JX (2013) Assessing the China Sea wind energy and wave energy resources from 1988 to 2009. Ocean Eng 65: 39–48. https://doi.org/10.1016/j.oceaneng.2013.03.006