Simulation Study of Disastrous Waves Along Indonesian Offshore and Coast Under Roaring Forties and Tropical Cyclones
https://doi.org/10.1007/s11804-022-00252-3
-
Abstract
Indonesian offshore and coastal areas are vulnerable to swells from Roaring Forties and cyclone disasters. However, the understanding of the characteristics and propagation mechanisms of local disastrous waves is insufficient, posing a threat to the construction, maintenance, and protection of coastal structures. This study establishes a multiple nested wave model based on the third-generation wave model WAVEWATCH Ⅲ. This model includes sole forcing of Roaring Forties and combined forcing of Roaring Forties and cyclone Ernie to simulate the influence of disastrous waves under the Roaring Forties and tropical cyclones in the Indonesian offshore zone and coasts. The following results are obtained. The Indonesian offshore is prevailed by relatively stable southern to southwestern dominant swells and small wind waves under the impacts of the Roaring Forties without cyclone winds. Long propagating swells originated from the Roaring Forties dominate in nearshore coastal waters with deformed directions and strength because of the shoaling effect.-
Keywords:
- WAVEWATCH Ⅲ ·
- Roaring Forties ·
- Cyclone Ernie ·
- Indonesian offshore and coast ·
- Wind sea ·
- Swell ·
- Wave spectrum
Article Highlights• Waves and detailed 2D wave spectral structure along Indonesian offshore and coast are simulated and studied, under conditions of Roaring Forties alone, combined influence of tropical cyclone Ernie and Roaring Forties.• Three-layer nesting wave model is applied from Indian Ocean to Indonesia coast, to ensure that all wave energy is not lost whether from Roaring Forties or local winds, also to ensure high resolution simulation from large domain to coastal waters.• Compared with cyclone generated waves, the Indonesian offshore and coast is prevailed by relatively stable southern – southwestern dominant swells, under the impacts of Roaring Forties. -
1 Introduction
Indonesia is the largest archipelago in the world, with a long narrow region and deep open coastal waters. It straddles the equator and borders the east of the Indian Ocean. Devastating waves frequently attack the Indonesian coasts due to Indian Ocean tropical cyclones and swells from the Southern Indian Ocean.
Studies on wave characteristics have been mostly conducted on local areas based on observations of coastal engineering constructions along Indonesia coastal waters (for example, the statistical analysis of wave components in the Adipala sea area of Indonesia (Chen et al. 2013; Wang et al. 2018), the study of wave characteristics in Java island (Zhou et al. 2014; Nugraheni et al. 2017), the spectral analysis of long-period waves at Adipala of Indonesia (Wu et al. 2018), and the study of wave characteristics under cyclones (Habibie and Permana 2013)).
Understanding waves in the Indian Ocean (especially the South Indian Ocean) is key to exploring wave properties along Indonesia coasts. Current research on large-scale ocean waves in the Indian Ocean is relatively mature because related studies have been conducted to use statistical and numerical simulation methods, examine the wave characteristics in the Indian Ocean by analyzing the statistical wave data, and simulate the temporal and spatial wave characteristics (Zieger et al. 2021). In the Roaring Forties zone, the propagation speed of the swells originated from the Indian Ocean reaches its peak in May and August (Zheng et al. 2018). The North Indian Ocean is dominated by swells with strong waves in the eastern areas (Anoop et al. 2015; Aboobacker 2017). The swell waves and monsoon wind-generated high waves overlapped with tropical cyclone-induced waves will lead to extreme waves in the Indian Ocean. The wave conditions in the Arabian Sea are mainly controlled by the SW/NE monsoon winds, the swells from the South Indian Ocean, and to some extent, by the regional/local wind systems (Aboobacker and Shanas 2018). The average significant wave heights of swells and mixed waves markedly increased, and a strong connection existed between the intensity of the Roaring Forties and the level of the northward swell propagation (Zheng et al. 2016). The swell energy in the Indian Ocean shows a significant northeastward propagation trend, with the propagation velocity reaching its peak during May and September (Zheng et al. 2017). The variabilities of wind speed and significant wave height and interdecadal scale wave period in the Roaring Forties are in good agreement with those in tropical waters of the Indian Ocean (Zheng et al. 2017).
The shortage in measured data of the Indonesian coast can be effectively mitigated by establishing a reasonable regional numerical wave model and developing a longtime wave hindcast and forecast system. Until now, the third-generation wave models have been widely used in the numerical simulation of ocean waves, such as the study of the influence of driving wind field in wave simulation (Kazeminezhad and Siadatmousavi 2017; Umesh et al. 2018), wave forecast and hindcast experiments (Sandhya et al. 2014; Amrutha et al. 2016), model performance study (Korres et al. 2011; Mentaschi et al. 2015), model parameter sensitivity test (Seemanth et al. 2016; Kong et al. 2017), and wave characteristic research (Habibie et al. 2013; Zheng et al. 2017). However, numerical simulation studies on ocean waves in Indonesian coastal areas are still lacking. Moreover, available research on waves along Indonesian coasts under the Roaring Forties and tropical cyclones is limited despite the frequent attacks of devastating waves caused by tropical cyclones and swells from the Southern Indian Ocean in this area. By contrast, the wave conditions along the Indonesian coasts are complicated because of the coexistence of wind sea due to tropical cyclones and long-period swells. Therefore, wave growth and propagation mechanisms in this area remain unclear, complicating the construction and protection of local coastal projects. Thus, under the joint influence of the Roaring Forties and tropical cyclones along the Indonesian coasts, maximizing the advantages of numerical wave models to simulate disastrous waves and study their mechanisms is of academic and practical significance considering local marine disaster prevention and mitigation.
A WWⅢ multiple nested model system is established in this paper to simulate the disastrous waves originating from the Indian Ocean to the Indonesian coasts under the joint effects of the Roaring Forties and tropical cyclones and analyze the related wave characteristics.
2 Wind climate
2.1 Driven wind
The North Indian Ocean has three wind seasons: southwest monsoon season (May – Sept.), northeast monsoon season (Nov.–Mar.), and monsoon conversion season (Apr. and Oct.) (Cui et al. 2013). The climate in the South Indian Ocean is complex; this area also has three seasons: 1) winter season is from Jun. to Sept., with the most frequent wind in SE, variation direction, and W direction within 0°S–30°S, 30°S–35°S, and 35°S range, respectively; 2) summer season is from Dec. to Mar., with the most frequent wind in NW–W, SE, variation direction, and W direction within 0°S–10°S, 10°S–30°S, 30°S–40°S, and 40°S range, respectively; 3) reversal seasons are Apr.–May and Oct.–Nov., with the most frequent wind in W (except in May), SE, variation direction, and W directions within 0°S–5°S, 5°S– 30°S, 30°S–40°S, and 40°S range, respectively (Tong et al. 2003). The northeast monsoon disappears in April, and the southwest monsoon is ready to start. The Indonesian coastal area (located near the equator) is also under equatorial westerlies. Therefore, April is selected to explore only the wave properties in the Indonesian offshore and coast under the coexistence of monsoon wind, Roaring Forties, and tropical cyclones.
2.2 Tropical cyclone Ernie
Cyclone Ernie is selected as the typical cyclone that attacked the Indonesia coast. Severe tropical cyclone Ernie was recorded as one of the fastest-growing tropical cyclones according to the cyclone position and intensity data provided by the Joint Typhoon Warning Center best-track dataset (http://www.metoc.navy.mil/jtwc.html) and the Australian Extreme Weather Forecast Center (http://australiasevereweather.com/cyclones/2017/tropical_cyclone_caleb.htm). Compared with the historical statistical data of typical tropical cyclones (Zieger et al. 2021), Ernie was also one of the strongest tropical cyclones in the Southeast Indian Ocean, with maximum wind speeds exceeding 60 m/s.
A tropical depression formed in southeast Jakarta and moved south-westward at 1200 UTC on April 5, 2017. This tropical depression grew into a category 1 cyclone and was named Ernie at 1200 UTC on April 6. Ernie continued to gain power in the southwest direction and rapidly grew into a category 5 severe cyclone at 1200 UTC on April 7. This cyclone then maintained its intensity at this level for more than 12 h, with a 220 km/h peak wind speed and a 922 hPa central pressure. Ernie later degraded into category 3 at 1200 UTC on April 8 while still shifting in the south-southwest direction. The cyclone eventually turned back into a tropical depression at 0600 UTC on April 10. The cyclone track is shown in Figure 1.
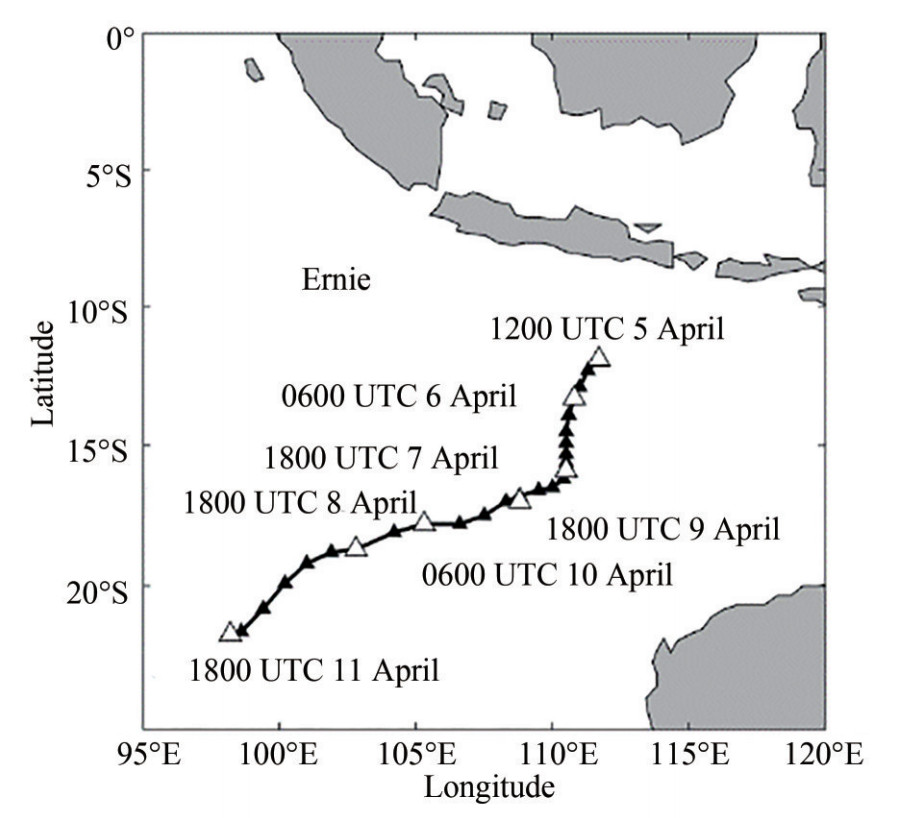 Figure 1 Track map of tropical cyclone Ernie
2.3 Roaring Forties
The Roaring Forties are the low-pressure regions encircling the earth in the southern sphere from 40°S to 60°S, where strong westerly winds rage throughout the entire year, as shown in Figure 2. These regions generate extreme local winds and frequent extreme storms. The peak value of the storm wind speed always appears in the central sea area of the Roaring Forties and the storms rolling toward the east direction with a clockwise rotating shape, and the generated big wind waves in the Roaring Forties zone propagated toward the northeast, proliferating over the entire Indian Ocean. In addition to local winds and extreme cyclone impacts, Indonesian coasts are facing the propagating swell originating from the Roaring Forties whole year-round, and waves in this area are complicated.
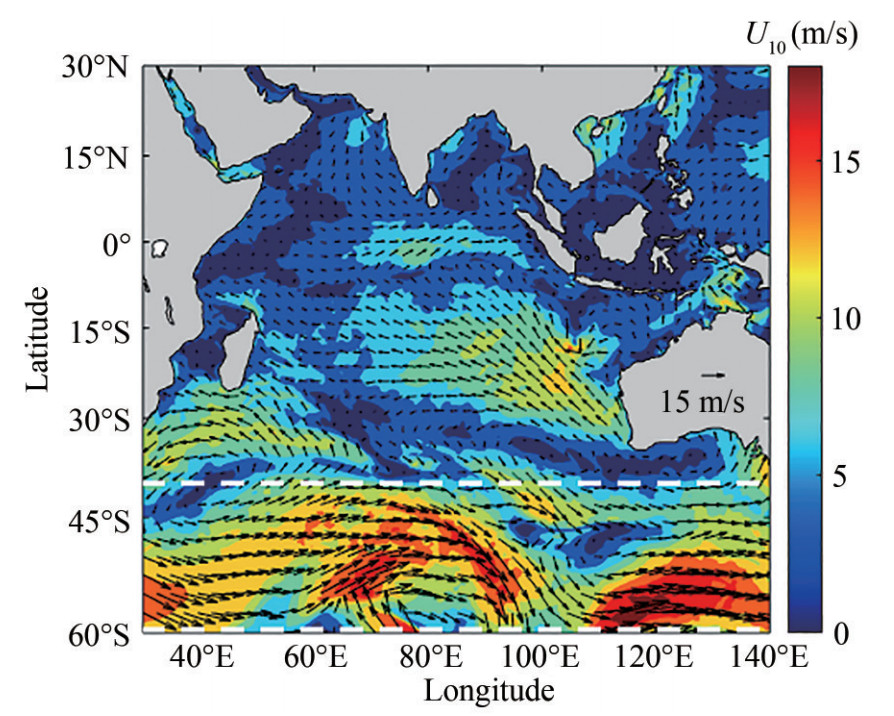 Figure 2 Wind map of Roaring Forties (between two white lines) in the Indian Ocean at 1200 UTC on April 8, 2017
3 Nesting model numerical simulation from Indian Ocean to Indonesian Coast
The state-of-the-art third-generation ocean wave numerical models include SWAN (Booij et al. 1999; SWAN Team 2019), WAVEWATCHⅢ (WWⅢ) (WAVEWATCH Ⅲ Development Group 2016), and WAM (Komen et al. 1994). Among these models, the WWⅢ model is frequently used in large-scale ocean and shallow water wave simulations and has been widely accepted due to its successful application in wave simulation, wave study, and wave forecasting and hindcasting operations (Xu et al. 2007; NOAA/ NWS Environment Modeling Center).
A three-layer nested wave model system was established in this study based on WWⅢ (version 5.16) to stimulate disastrous waves along Indonesia coasts under the Roaring Forties and tropical cyclones, and simulation results were validated by buoy and satellite wave data. The characteristics of disastrous waves along Indonesia coasts under the influence of Roaring Forties alone and the joint effects with tropical cyclones were then analyzed.
3.1 Wave model
The WWⅢ wave model is based on the energy equation. The control equation of this model is the random phase dynamic spectral density balance equation of the wavenumber direction spectrum. This control equation usually utilizes spherical coordinates for large-, meso-, and small-scale wave simulations.
$$\frac{{\partial N}}{{\partial t}} + \frac{1}{{\cos \varphi }}\frac{\partial }{{\partial \varphi }}\dot \varphi N\cos \theta + \frac{\partial }{{\partial \lambda }}\dot \lambda N + \frac{\partial }{{\partial k}}\dot kN + \frac{\partial }{{\partial \theta }}{\dot \theta _g}N = \frac{S}{\sigma }$$ (1) $$\dot \varphi = \left({{c_g}\cos \theta + {U_\varphi }} \right)/R$$ (2) $$\dot \lambda = \left({{c_g}\sin \theta + {U_\lambda }} \right)/R\cos \varphi $$ (3) $${{\dot \theta }_g} = \dot \theta - \left({{c_g}\tan \varphi \cos \theta } \right)/R$$ (4) where N is the wave action density spectrum, λ is longitude, Φ is latitude, k is the wavenumber, θ is the wave direction, t is time, cg is the wave group velocity, Uφ and Uλ are respectively the current components in the latitude and longitude directions, R is the radius of the earth, σ is the relative circular frequency, and S is the total source and sink term of the input. This term comprises three parts in deep water, namely atmosphere–wave interaction term Sin, nonlinear wave–wave interaction term Snl, and wave–ocean interaction term Sds, while that in shallow water includes wave–bottom interactions Sbot, depth-induced breaking Sdb, and triad wave–wave interactions Sdr, which are also added to S.
3.2 Model setup
A three-layer nesting technique is applied from the Indian Ocean to the Indonesian coast to prevent wave energy loss induced by the Roaring Forties and tropical cyclones. The WWⅢ model system comprises the following three nested domains: the entire Indian Ocean domain (D1) (Outer domain: 30°E–140°E, 60°S–30°N, 20′ × 20′ resolution), intermediate domain (D2) (60°E–130°E, 30°S–10°N, 5′ × 5′ resolution), and Indonesia coastal domain (D3) (94° E–114°E, 20°S–0°, 1′ × 1′ resolution). The wave spectrum is discretized with 32 frequencies ranging from 0.041 to 0.79 Hz and 36 directions with a 10° increment. Figure 3 shows the Indian Ocean topographies and the range of three domains. Bathymetry data are from the ETOPO1 (Amante and Eakins 2009) database.
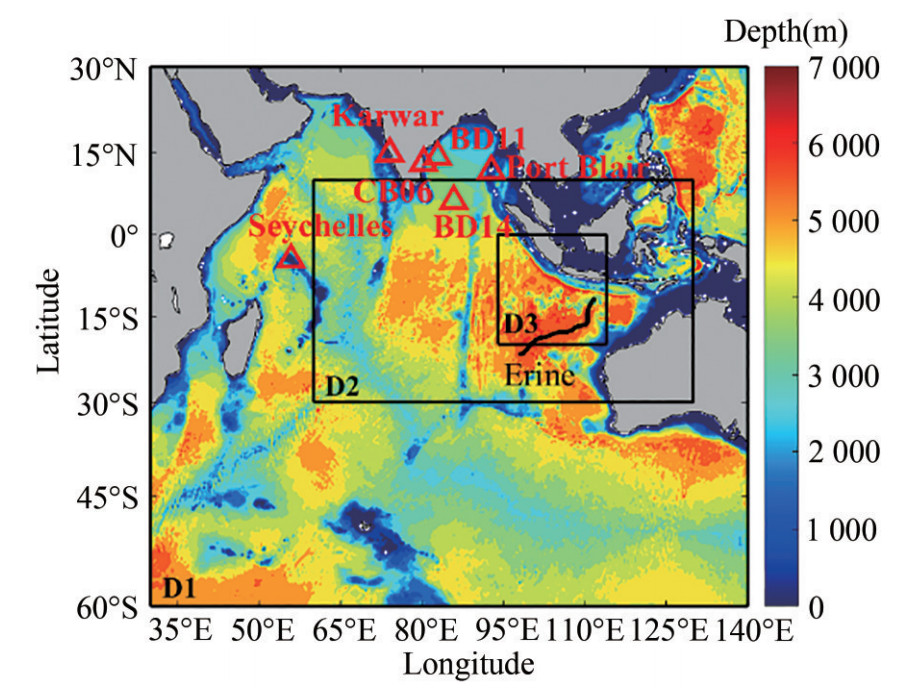 Figure 3 Topography of Indian Ocean, model nesting domains (Triangle mark as buoy and asterisks indicate the location)
Model physics is set such that discrete interaction approximation is applied to nonlinear wave – wave interactions (Ardhuin et al. 2010). Parameterization (ST4) is selected as the wind input and dissipation source term. Bottom friction is modeled using the Joint North Sea Wave Project parameterization with a default value. Depth-induced breaking is calculated using Battjes and Janssen's (1978) parameterization with a default value. Nonlinear triad interactions are modeled using the LTA model (Eldeberky, 1996).
The model calculation time lasts for 15 days from March 30 to April 13, 2017. The model is forced by sea surface wind velocities from the cross-calibrated multiplatform ocean surface wind velocity (Version 2). Waves along the Indonesian coasts were mainly controlled by the Roaring Forties from 0000 UTC on March 30 to 1200 UTC on April 5 and from 1800 UTC on April 11 to 1800 UTC on April 13 during the simulation period, while they were affected by the Roaring Forties and cyclone Ernie from 1200 UTC on April 5 to 1800 UTC on April 11.
The spectral segmentation technique is used to separate different wave components, analyze wave field and spectral energy distribution characteristics, and resolve the complex wave patterns under Roaring Forties and tropical cyclones in the Indian Ocean and along Indonesia coasts.
4 Nesting model validation
Buoy and satellite data have remarkable coverage and advantages in ocean wave research despite the difficulty in conducting field observations. Some scholars and organizations investigated ocean waves and achieved good results based on satellite data, such as JASON altimeter data (León et al. 2019; International Altimetry Team 2021).
4.1 Model validation with buoy data
Buoy and satellite data were used to validate the model in this paper. Buoy data are provided by the Earth System Science Organization-Indian National Center for Ocean Information Services. Observed buoy data are unavailable near the Indonesian offshore area, and three stations are selected in the North Indian Ocean (Figure 3). Buoy information is presented in Table 1.
Table 1 List of wave buoys in the Indian Ocean (observation data available during Ernie)Buoy name Longitude (°E) Latitude (°N) Water depth (m) BD11 82.90 14.20 3 291.9 BD14 85.87 6.19 3 875.1 Seychelles 55.872 -4.6 43.1 The modeled results used for the comparison of observed buoy data were taken from the nested grid D1. Figure 4 shows the comparison of the calculated model and observed buoy values.
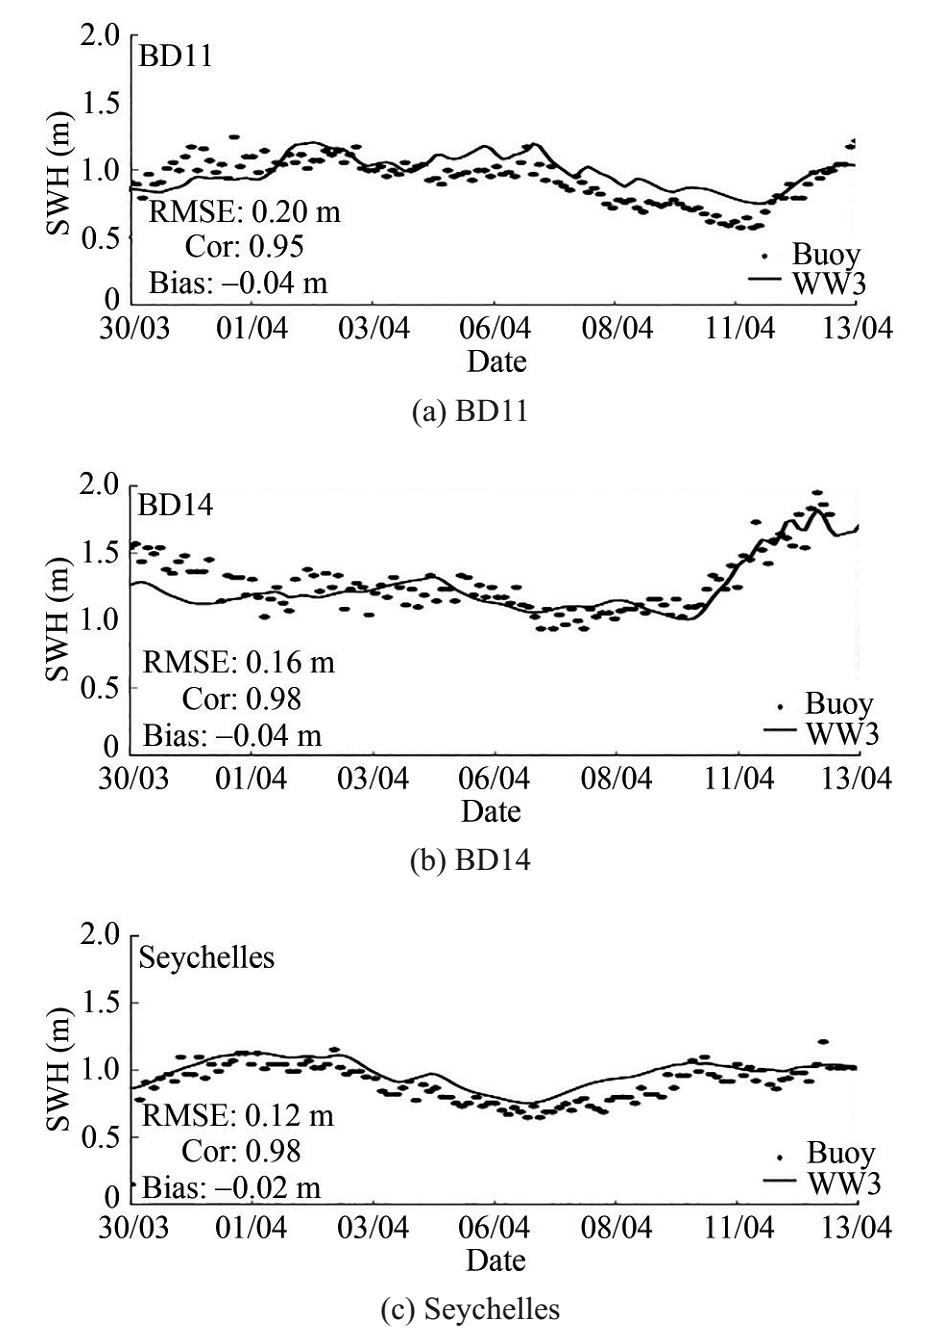 Figure 4 Comparison of WW Ⅲ stimulated significant wave heights (SWH) with buoy observations
Figure 4 shows the following: 1) the significant wave heights of WWⅢ simulation are in good agreement with those from buoy observations. The correlation coefficients are all above 0.95, and the maximum wave heights during the cyclone process are effectively described. 2) Buoys BD11 and BD14 are on the east of the Indian Peninsula and are large for the relative loss of waves propagated from the south. The overall significant wave height simulation is low, and the deviation value is negative. Wave propagation is blocked due to the cover of the island on the south of buoy BD11, resulting in minimal changes in the wave height of buoy BD11. The RMSE and absolute deviation of significant wave height simulation at buoy BD11 are both lower than those at buoy BD14. 3) Buoy Seychelles is located in shallow waters on the north of Madagascar Island. The fitting degree of wave simulation value is high, with the correlation coefficient reaching 0.977 1 and the RMSE only 0.120 6 m. This finding indicates that the model can reasonably simulate offshore waves.
4.2 Model validation with satellite data
Jason-3 satellite is a follow-on mission to Jason-2 by EUMESTAT and NOAA, and satellite tracks across the Indonesian coastal area are shown in Figure 5.
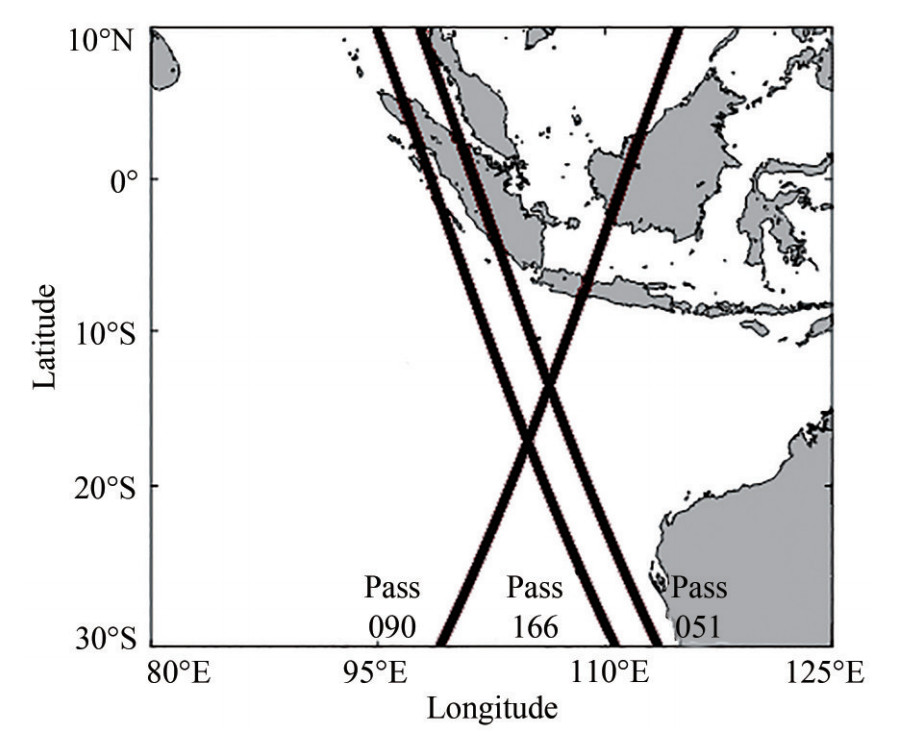 Figure 5 Satellite tracks across Indonesian coastal
The modeled results used for the comparison of satellite data were taken from the nested grid D2. The verification results are presented in Figure 6.
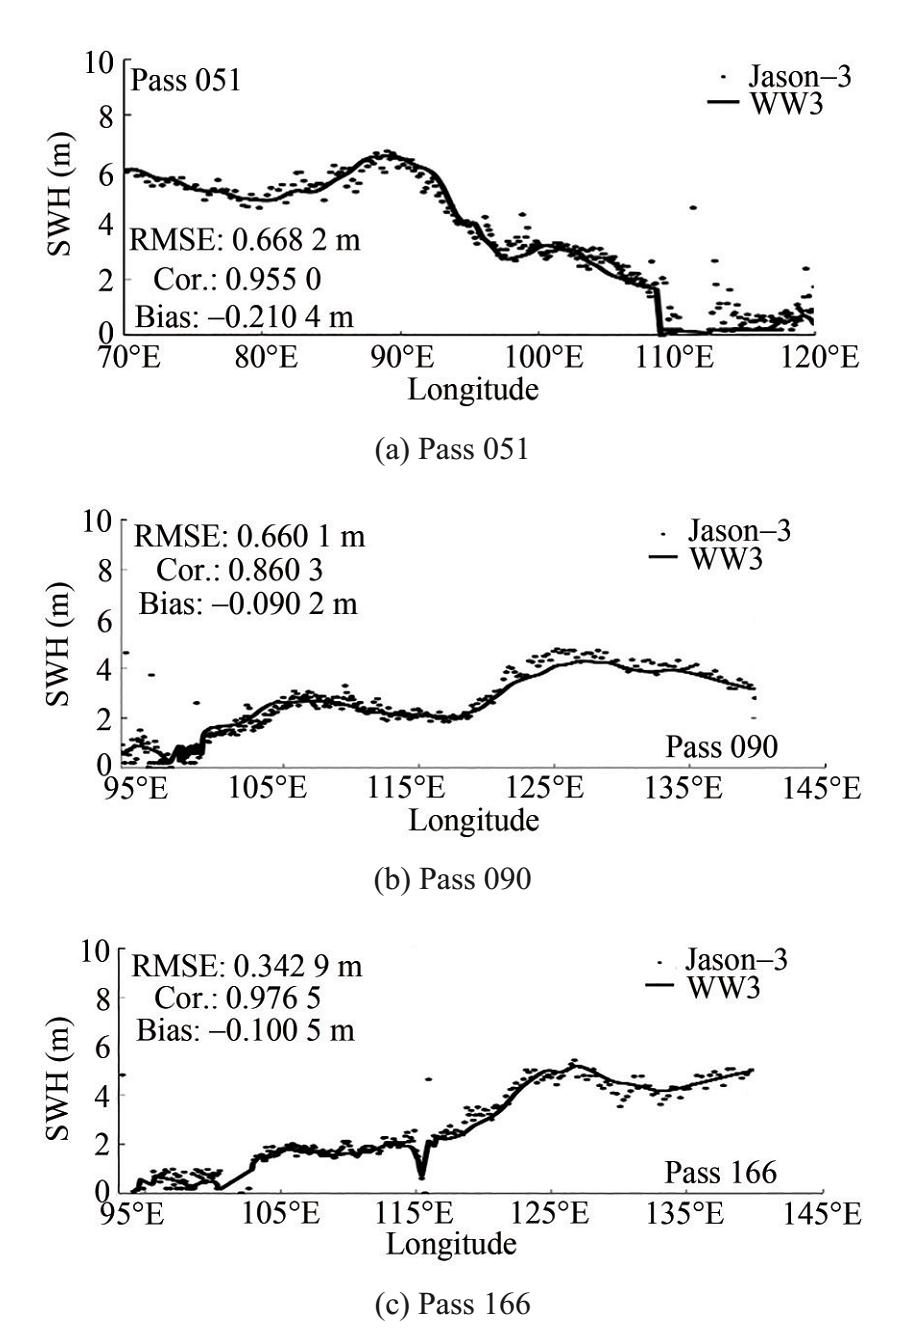 Figure 6 Comparison of WWⅢ stimulated SWH with Jason-3 data
Figure 6 shows the following: 1) the overall change trend of significant wave heights simulated by WWⅢ is consistent with the values of Jason-3 satellite observations. The data have a high degree of coincidence, which can effectively simulate the peak values of big waves. 2) The simulated significant wave heights of WWⅢ are generally lower than those of satellite observations. 3) Large deviations are found in the satellite altimeter measurement due to the satellite itself and the wave height outliers when the satellite is close to the land area.
Figures 4 and Figure 6 respectively show that the simulation results and measured values are successfully verified, and the WWⅢ model is reasonably set. The model can also be used to simulate the wave field in the Indian Ocean and further study wave characteristics.
5 Simulated wave characteristics
5.1 Waves under Roaring Forties
Figures 7(a) and 7(b) respectively show wind field and significant wave height along the coasts of Indonesia at 1200 UTC on April 2. Waves were induced by Roaring Forties and local background low winds at this time. The Indonesian coasts are dominated by southern waves, and the SWH decreases when propagating from the south toward the Indonesian offshore zone from 2.8 m to approximately 1 m near the coastal line. The analysis of 2D wave spectra and the relationship between wave direction and wind field revealed that the strength and directions of wave height had a poor correlation with that of the local winds. This finding implies that waves on the Indonesian coast are mostly generated by Roaring Forties of the southern sphere. Local winds affected wave strength only when the wind speed reached 10 m/s and above, as shown in the left-down corner of Figure 7.
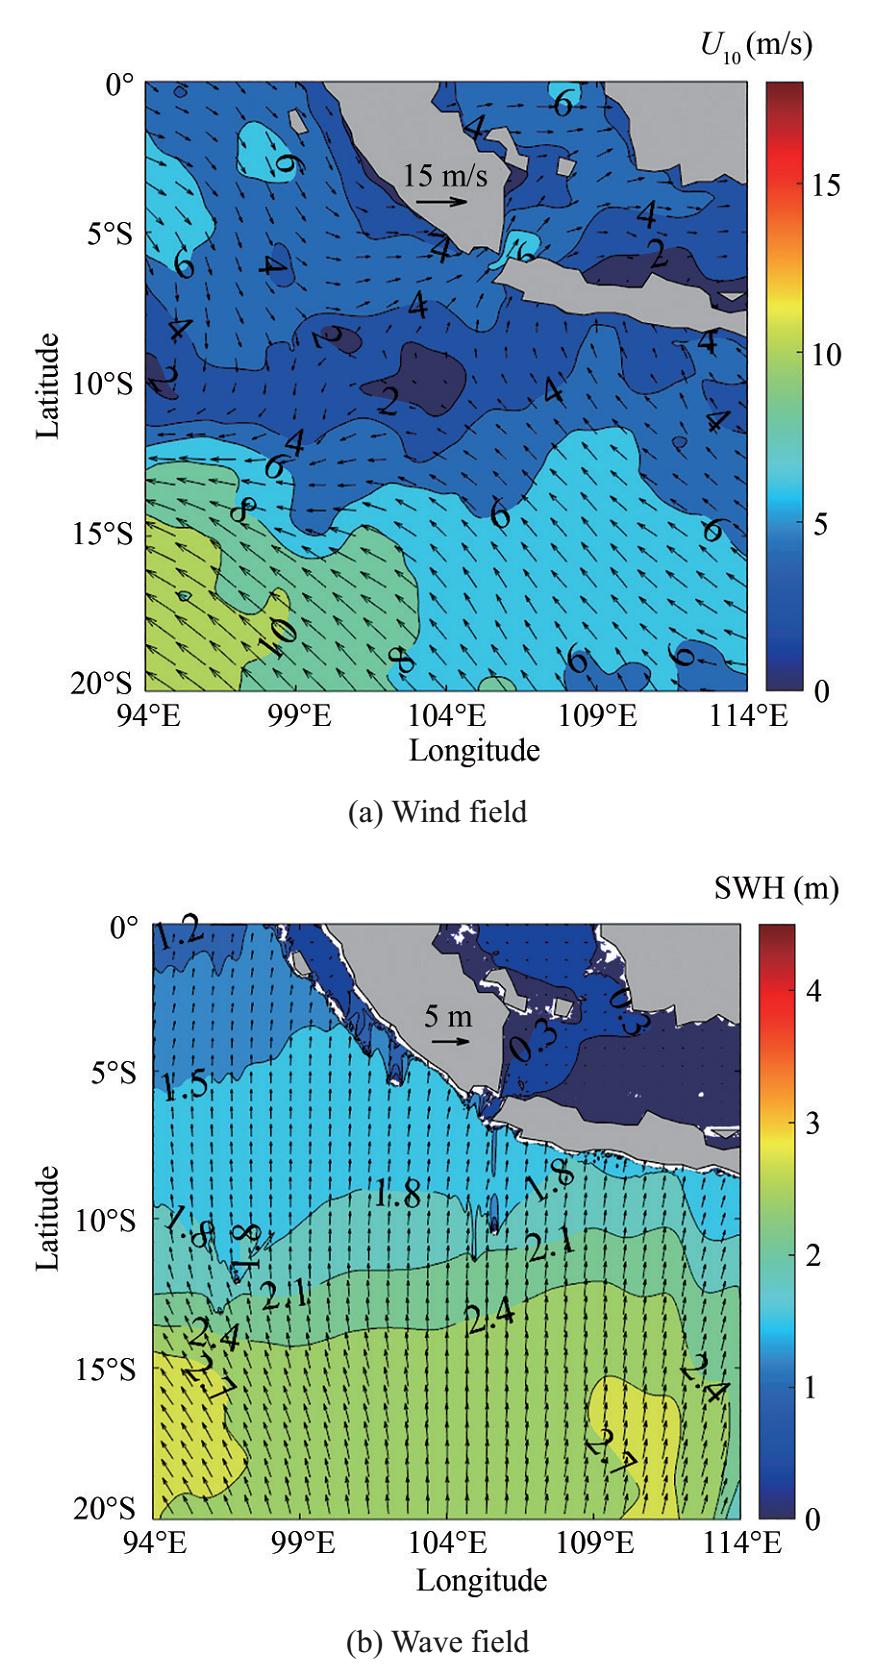 Figure 7 Field maps of wind and mixed wave along the coast of Indonesia at 1 200 UTC on April 2
5.2 Waves under the combined influence of tropical cyclone Ernie and Roaring Forties
Figures 8(a) and 8(b) respectively show the wind field and significant wave height along the coasts of Indonesia, wherein waves were induced by Roaring Forties and the winds of cyclone Ernie when it reached its maximum sustained intensity at 1200 UTC on April 8. 1) Maximum significant wave height reached 4 m within the range of the cyclone, and wave strength decreased outward in a radiation form. Waves and winds generally had a relatively strong relationship. 2) High winds show a clockwise direction around the track of Ernie, wind speed significantly increased under the influence of Ernie, and southeast waves dominated the area with high SWH. Wave directions along the Indonesian coastal zone are in the southwest, which is different from the cyclone wind direction herein. By contrast, wave directions around the tracks of Ernie were deviated by the cyclone, with wave directions changing to southeast within the range of Ernie when the wind speed was over 10 m/s. The cyclone enhanced the wave strength within its scope. However, compared with strong cyclonegenerated wind waves, the propagating waves induced by Roaring Forties were still important factors, even within the cyclone range during the cyclone process.
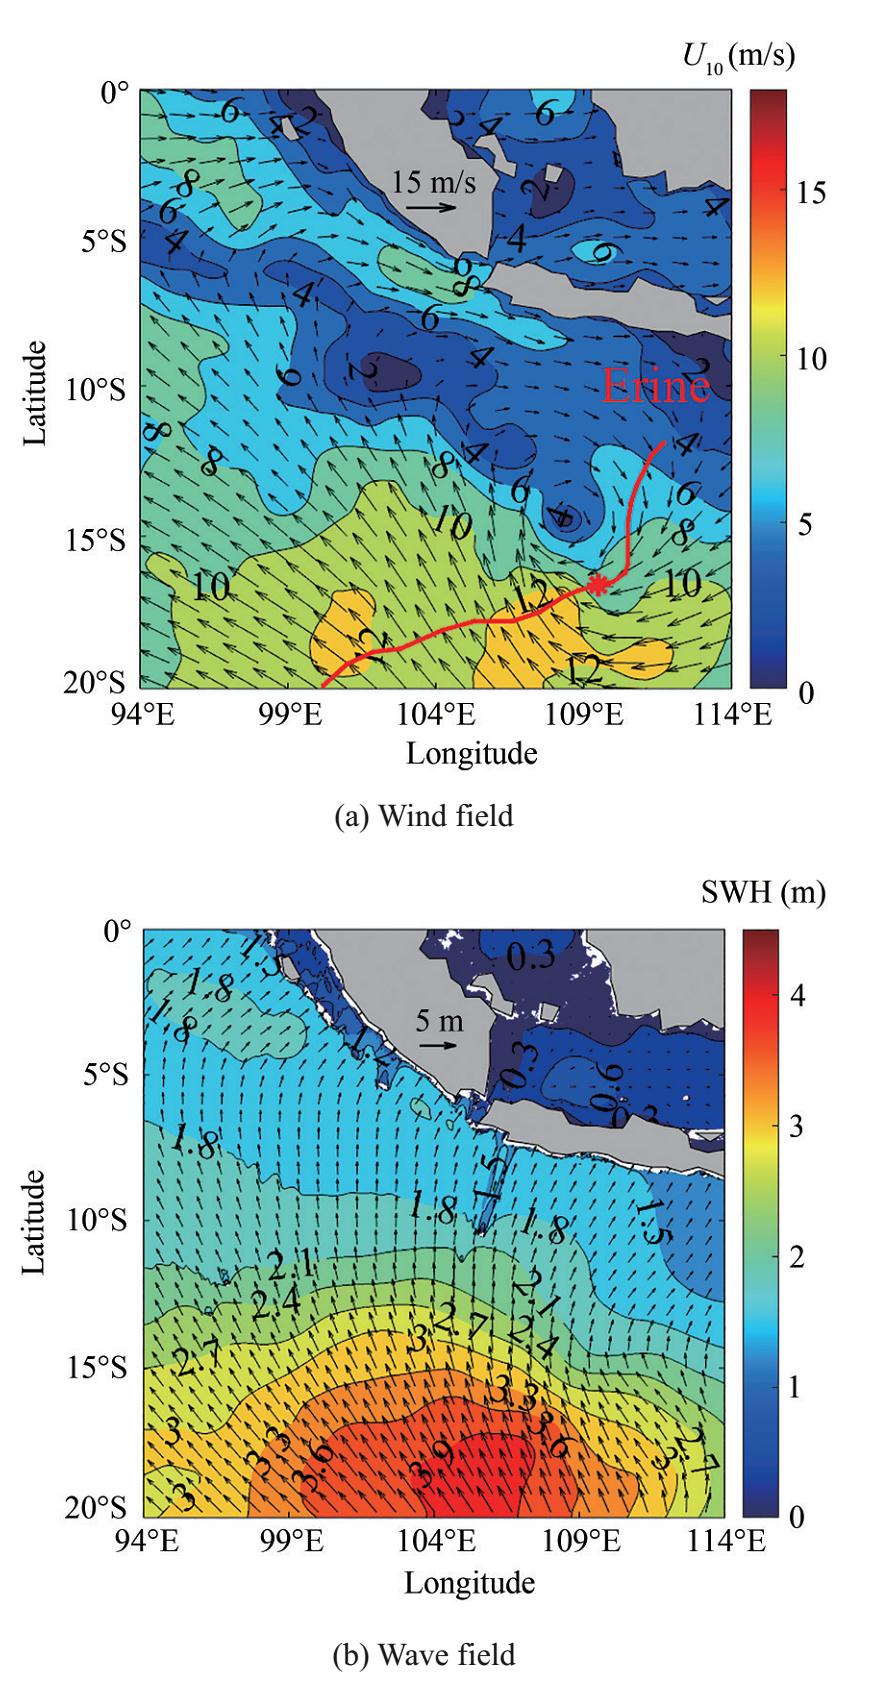 Figure 8 Field maps of wind and mixed wave along the coast of Indonesia at 1200 UTC on April 8
6 Spectral wave properties
Two-dimensional wave spectra provide detailed wave components along the Indonesian coasts under Roaring Forties, cyclones, and the background monsoon wind. Typical control points are chosen to explore the detailed wave pattern in this region: three points (A1, A2, and A3) are selected on the left (maximum wind radius) and right side (maximum wind radius) of Ernie's track, and four locations (a, b, c, and d) along the most developed coastal areas of Indonesia are chosen, as shown in Figure 9. Detailed location information is listed in Table 2.
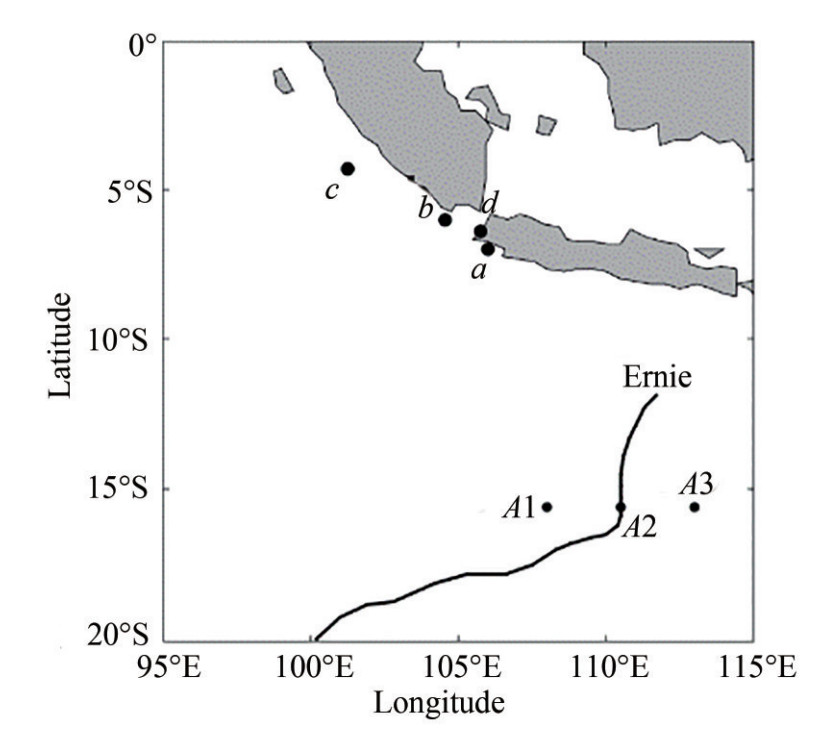 Figure 9 Locations of the control points in the Indonesian coast zoneTable 2 Information of the selected points
Control Points Longitude (°E) Latitude (°N) Water depth (m) A1 108.00 15.60 5 687.00 A2 110.50 15.60 5 620.00 A3 113.00 15.60 5 179.00 a 106.00 7.00 870.00 b 104.55 6.02 50.50 c 101.25 4.30 6.80 d 105.75 6.40 17.00 6.1 2D wave spectra within the range of Ernie
Figure 10 shows the 2D wave spectra at points A1, A2, and A3 at 1200 UTC on April 2 and at 1200 UTC on April 8. The three points were located in deep water off the Sunda Shelf at 1200 UTC on April 2. The waves at A1, A2, and A3 represent the combined effects from Roaring Forties and background monsoon wind at 1200 UTC on April 2 and those from Roaring Forties, background wind, and tropical cyclone Ernie at 1200 UTC on April 8.
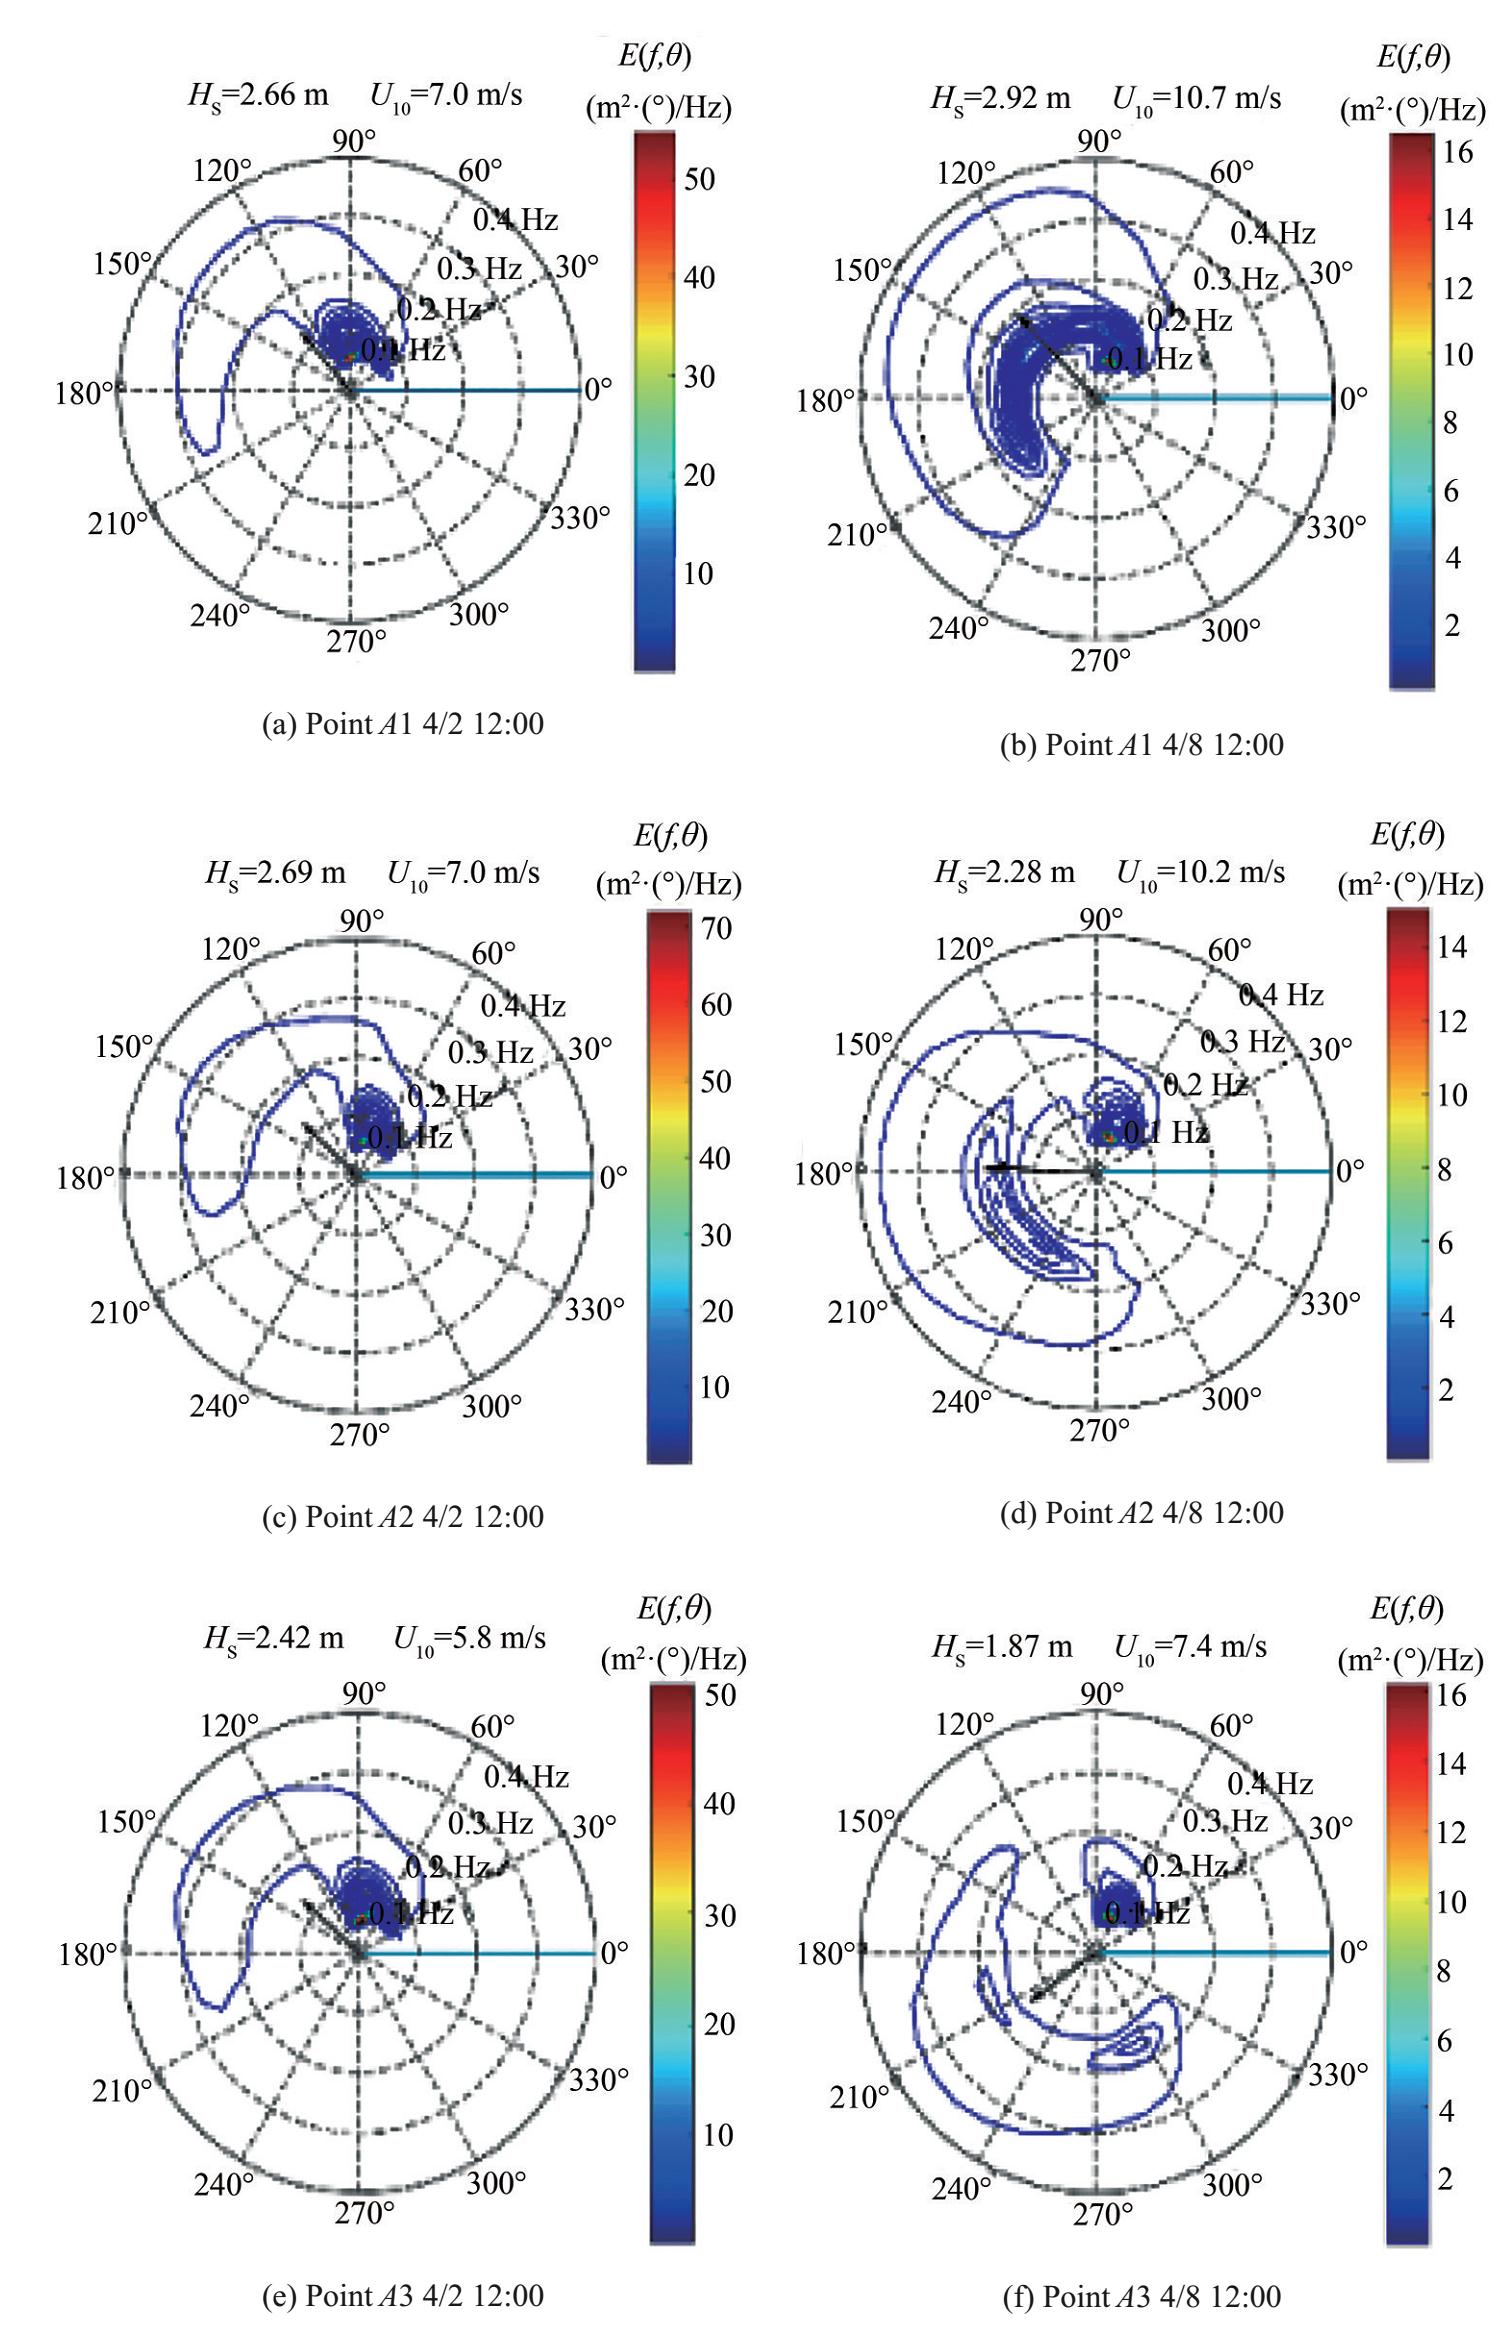 Figure 10 2D directional spectra of points A1, A2, and A3
At 1200 UTC on April 2, the wave spectral distributions at the three points (whether on the right side of Ernie's track at maximum radius (A1), on the track (A2), or the left side of Ernie's track on the maximum radius) were similar. The wave energy spectra were multimodal with 2–5 peaks. Most of the energy fluctuations originated from the first quadrant. Spectra energy accumulated within 60°–90° (southwest to south directions) with swell energy as the dominant component, which originated from the long propagating swell induced by Roaring Forties. The maximum SWH of the swell was 2.03 m, and the swell components demonstrated a small frequency (large wave period). The local wind wave energy was distributed within 45°–200° with northeast as the main direction, which corresponds to the northeast monsoon wind condition and has a large frequency (short wave period).
At 1200 UTC on April 8, the wave spectral pattern within Ernie's range showed different and complicated properties at A1, A2, and A3 locations. Energy spectra demonstrated several peaks, with peak frequencies ranging from 0.05 Hz to 0.2 Hz. The maximum energy peak remained in the first quadrant at A1, A2, and A3, showing stable properties as that before the arrival of Ernie at 1200 UTC on April 2. The long-period swell component was induced by the Roaring Forties, and this swell energy component concentrated within 60°–90° in the south to southwest directions. The large frequency of wind wave distributions showed a counterclockwise change from A1, A2 to A3, which corresponded to local wind directions, and the spectral energy decreased from A1, A2 to A3. The wind sea energy was enhanced and became the dominant component at point A1, with a maximum SWH reaching 2.34 m. Meanwhile, the energy of wind seas was nearly equal to the swell energy at A2 and A3.
The above phenomena can be interpreted as follows: wind wave energy components were related to the local wind of Ernie in the clockwise direction, and wind speeds at the right side of Ernie's track (A1) were enhanced due to its translation speed (toward the southwest direction).
The coordinate system is a Cartesian coordinate. The radial direction comprises frequencies in Hz with intervals of 0.1 Hz. The arrows in the circle center indicate wind direction, with lengths showing the wind speeds. The color scale and contour indicate the energy spectral density in m2· (°)/Hz. Hs is significant wave height, and U10 represents the wind speed at 10 m elevation.
6.2 2D Wave spectra along the Indonesian Coast within the Sunda Shelf
Points a, b, c, and d are located along the Indonesian coast within the Sunda Shelf. Points a and b are respectively located in the right (point a) and left (point b) sides of Sunda Strait, point b faces the Indian Ocean but is slightly sheltered by the protruding cape, point c is near the coastal line of Mentawai Islands of Indonesia, and point d is located in Sunda Strait. Waves are not only influenced by Roaring Forties, cyclone winds, and local monsoon wind but also experience the shoaling effect and the coastal line influence. Figure 11 shows the 2D wave spectra at points a and b in deep nearshore water at 1200 UTC on April 2 and at 1200 UTC on April 8, respectively.
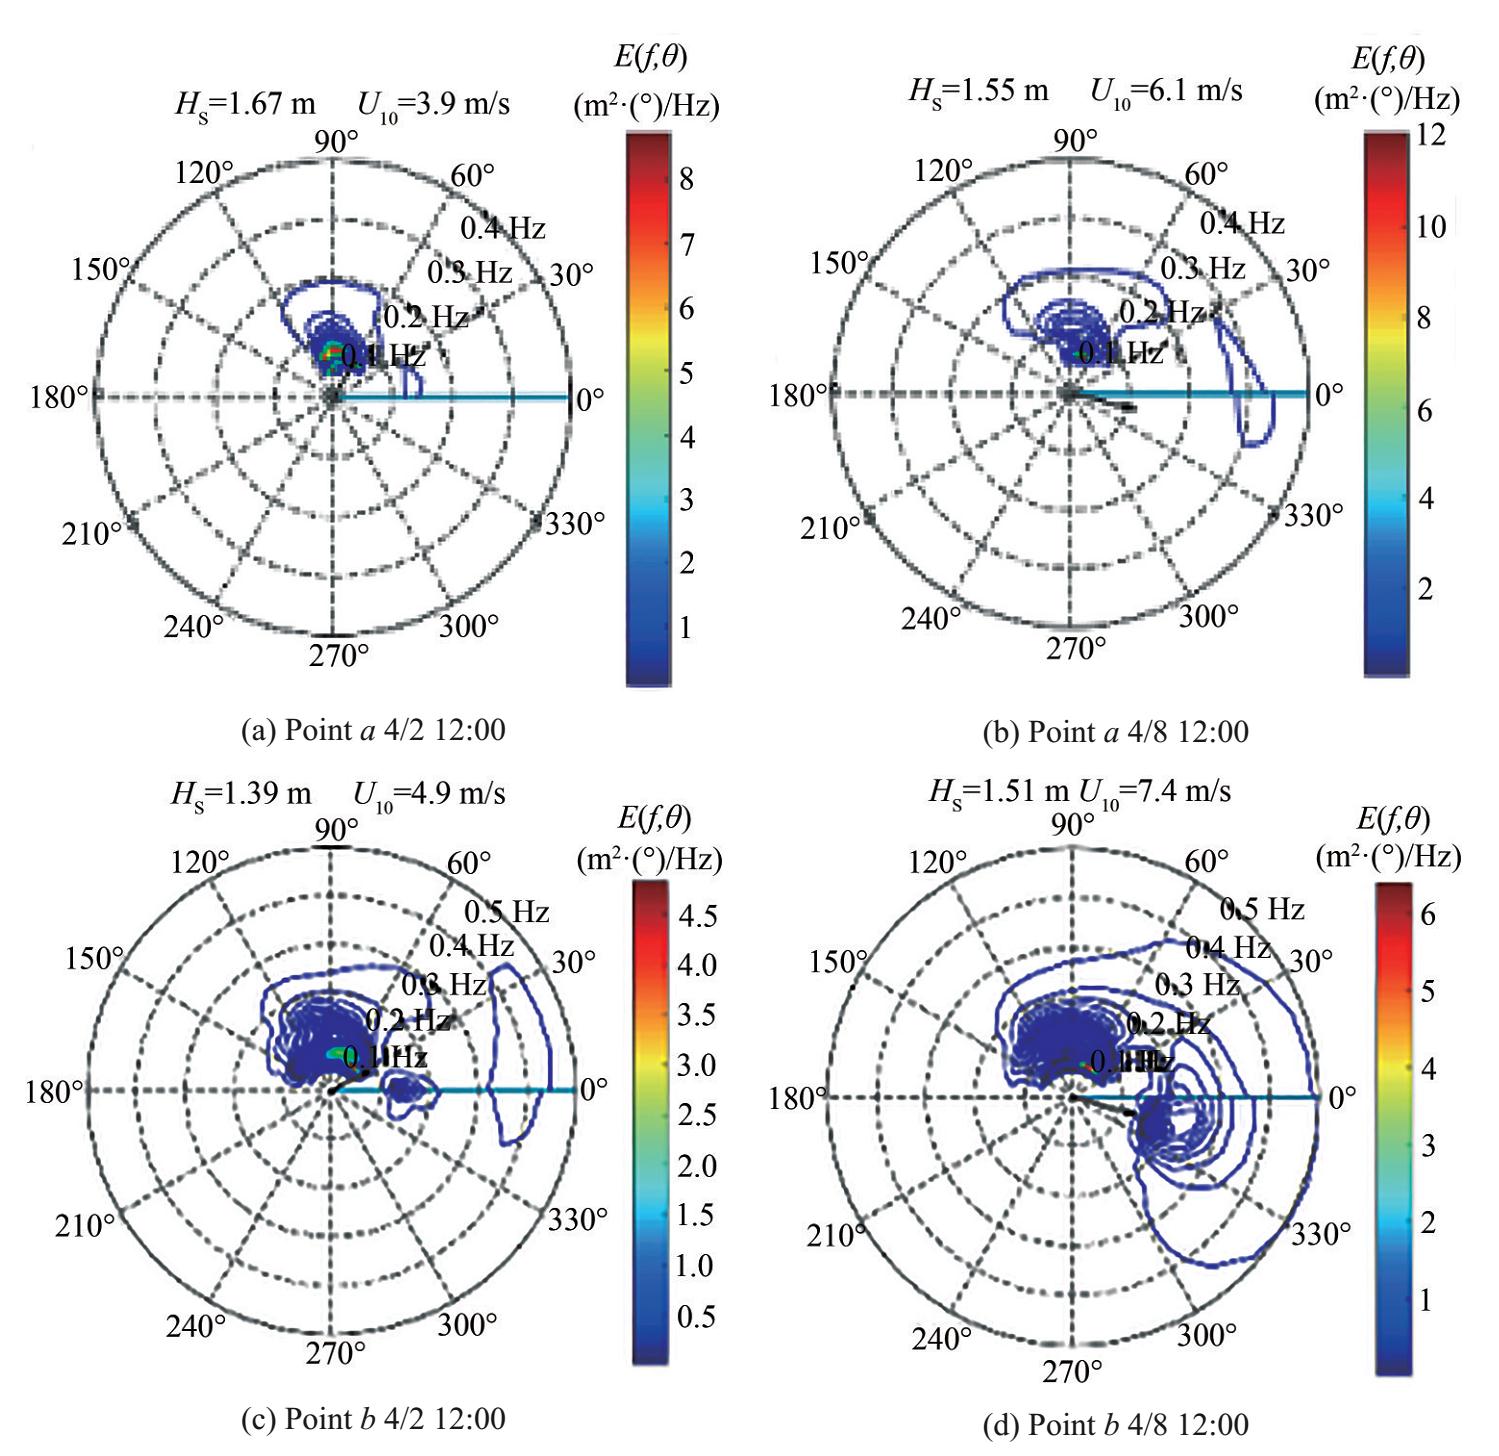 Figure 11 2D directional spectra of points a and b
The total spectral energy did not substantially vary at points a and b, whether under the coexistence of Roaring Forties and local winds at 1200 UTC on April 2 or under the coexistence of Roaring Forties, cyclone Ernie, and local winds at 1200 UTC on April 8. The low-frequency dominant swell energy distributions are not as stable as that of A1, A2, and A3 due to the deformed incoming swells by the shoaling effect near the coastal line. The spectral shape shows multipeaks at points a and b, wherein a separate wave energy system emerged from the west at point b. This phenomenon is due to the influence of the sustained equatorial westerlies on points a and b, while point a is sheltered by the cape of Sunda Strait. Thus, cyclone Ernie only had a small impact on waves at the two points.
Figure 12 shows the 2D energy density spectra at points c and d in nearshore waters at 0000 UTC on April 2 and 1200 UTC on April 8, and multipeak spectral patterns were observed in low- and high-frequency ranges at the two locations. The spectral energy at point c was concentrated around the south direction with low-frequency at 0000 UTC on April 2 and 1200 UTC on April 8. A northwest wind wave spectral component emerged with the increase in wind speed at 1200 UTC on April 8. Several swell components were also observed within 30° and 120° with low SWH, and these components had similar directions and different frequencies. The wind sea energy was almost equal to the swell energy.
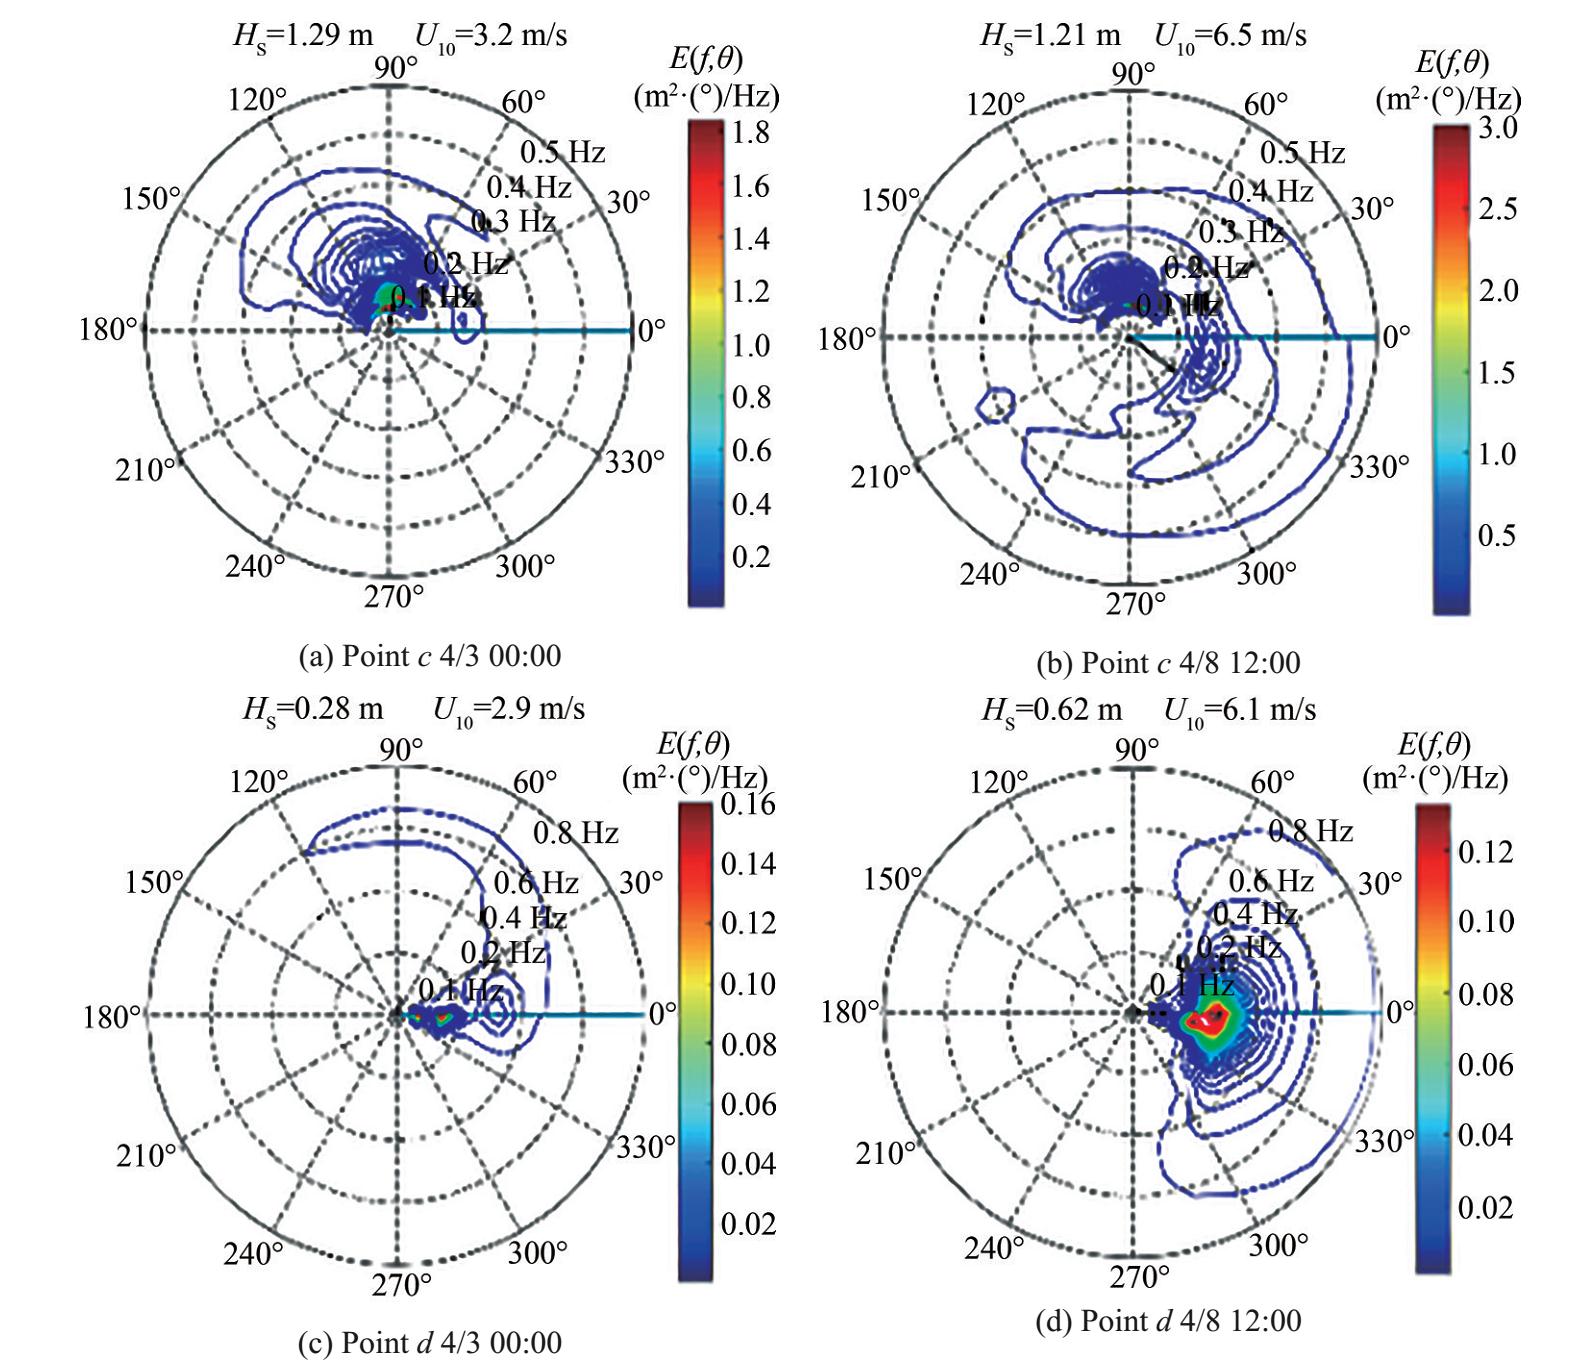 Figure 12 2D directional spectra of points c and d
Located within Sunda Strait, point d is exposed only to waves from west to south, and the spectral wave energy at this location was lower than that at point c. Low-frequency swell spectral energy was concentrated in the west. This concentration is due to the propagation of generated swell by the Roaring Forties to the shore of Indonesia from the southern sphere, and some of the swell experienced diffraction and propagated into the Sunda Strait. Equatorial westerlies also contribute to the components of wind waves. The directions of wind seas and swells were almost the same, and the wind sea energy was predominant.
7 Discussions
The Indonesian coasts are prevailed by swells traveling from the Southern Indian Ocean when solely affected by the Roaring Forties. SWH decreases in parallel in the northeast direction from 3 m (offshore), 1–2 m (open coastal area) to 0.5 m (sheltered coastal area). Compared with wave components and local wind wave energy, wave energy is mainly concentrated within the south to southwest (60° and 90°) direction distribution in the offshore zone with dominant swells. Waves experience the shoaling effect in nearshore coastal areas, and incoming swells from the Roaring Forties generated waves will be deformed in direction and strength. Equatorial westerlies also create wind waves because the Indonesia coast is only located within this sustained wind.
The northward propagating swell waves were still predominant under the impacts of Roaring Forties and tropical cyclones simultaneously, except for the cyclone range within 10 m/s velocity circle in the offshore area. Cyclonegenerated waves and the propagating swell from the Roaring Forties coexist, wind sea energy significantly enhances the total wave height and forms new high-frequency wind wave components, and SWH decreases from offshore toward north from 4 m (offshore), 1–2 m (open coastal area) to 0.5 m (sheltered coastal area). Wave compositions in nearshore waters are also complex due to the shoaling effect of topography and the coastal line shape. However, swell components remain important wave factors despite their deformation. Cyclone-induced waves have significant strength in the offshore zone. However, these waves have a slight impact near the Indonesian coastal area, and the equatorial westerlies contribute to some wind wave energy near the coastal area.
Wave compositions along Indonesian coasts are complex, and wave spectra are multimodal. Wave spectra at different locations can be divided into three types. 1) Multimodal spectra under the influence of cyclone wind in the Indonesian offshore zone. Relatively stable directional low-frequency swell spectral components and rapidly changing wind wave spectral components coexist. 2) Spatially stable multimodal spectra in the Indonesian offshore zone. Low-frequency swell spectral wave energy is mainly concentrated within the south to southwest directional scope, with relatively small and stable wind wave spectral components in the high-frequency range. 3) Multimodal type spectra along Indonesian coasts where cyclone influence is insignificant. The incoming low-frequency swell spectral components remain dominant but are deformed due to the shoaling effect, and wind wave spectral components are mostly induced by equatorial westerlies, which can be neglected if the location is blocked and sheltered by the complicated islands and coastal lines. Bimodal type spectra can be found near Indonesian coasts when the incoming low-frequency swells and wind waves (mostly generated by equatorial westerlies) have different directions.
8 Conclusions
This study establishes a multiple nested numerical wave model based on WWⅢ to examine the distributions and propagation characteristics of disastrous waves under the Roaring Forties and tropical cyclone Ernie in the offshore and coastal zone of Indonesia during the monsoon reversal period.
Roaring Forties induced swells and decreased from offshore to the coastal zone of Indonesia when solely under the effect of the Roaring Forties, and local wind wave spectral components distributed in relatively high frequencies from south to southwest directions. Spectral wave distributions are relatively stable offshore but are deformed near coastal zones because of the shoaling effect, especially in the sheltered waters.
Under the combined impacts of the Roaring Forties and tropical cyclones, total significant wave heights within the cyclone range are enhanced by cyclones in the offshore zone, while those near the coastal area only slightly varied. Wave spectra also show multimodal shapes in offshore and coastal areas, spectra patterns within the cyclone range rapidly change due to the rapid wind fluctuation in speed and direction, and spectral distributions are wide and complicated in frequency and directional scope, with coexisting relatively stable swell spectral components and rapidly changing wind wave components.
Local equatorial westerlies prevailing along the Indonesian coast in the monsoon reversal period contribute a high-frequency wind wave component, in addition to the prevailing swell and other wind systems. Wave systems in the Indian Ocean are complicated, especially in the Indonesian offshore and coastal zones. Thus, in-depth research must be conducted in different seasons to improve the understanding of wave mechanisms in this region. Studying high-precision and high-resolution numerical model simulation is necessary when high-resolution topography data are available.
-
Figure 1 Track map of tropical cyclone Ernie
Figure 2 Wind map of Roaring Forties (between two white lines) in the Indian Ocean at 1200 UTC on April 8, 2017
Figure 3 Topography of Indian Ocean, model nesting domains (Triangle mark as buoy and asterisks indicate the location)
Figure 4 Comparison of WW Ⅲ stimulated significant wave heights (SWH) with buoy observations
Figure 5 Satellite tracks across Indonesian coastal
Figure 6 Comparison of WWⅢ stimulated SWH with Jason-3 data
Figure 7 Field maps of wind and mixed wave along the coast of Indonesia at 1 200 UTC on April 2
Figure 8 Field maps of wind and mixed wave along the coast of Indonesia at 1200 UTC on April 8
Figure 9 Locations of the control points in the Indonesian coast zone
Figure 10 2D directional spectra of points A1, A2, and A3
Figure 11 2D directional spectra of points a and b
Figure 12 2D directional spectra of points c and d
Table 1 List of wave buoys in the Indian Ocean (observation data available during Ernie)
Buoy name Longitude (°E) Latitude (°N) Water depth (m) BD11 82.90 14.20 3 291.9 BD14 85.87 6.19 3 875.1 Seychelles 55.872 -4.6 43.1 Table 2 Information of the selected points
Control Points Longitude (°E) Latitude (°N) Water depth (m) A1 108.00 15.60 5 687.00 A2 110.50 15.60 5 620.00 A3 113.00 15.60 5 179.00 a 106.00 7.00 870.00 b 104.55 6.02 50.50 c 101.25 4.30 6.80 d 105.75 6.40 17.00 -
2021 International Altimetry Team (2021) Altimetry for the future: Building on 25 years of progress. Advances in Space Research 68: 319-363. DOI: 10.1016/j.asr.2021.01.022 Aboobacker VM (2017) Wave energy resource assessment for eastern Bay of Bengal and Malacca Strait. Renewable Energy 114: 72-84. DOI: 10.1016/j.renene.2016.09.016 Aboobacker VM, Shanas PR (2018) The climatology of shamals in the Arabian Sea-Part 2: Surface waves. International Journal of Climatology 38(12): 4417-4430. DOI: 10.1002/joc.5677 Anoop T, Kumar VS, Shanas PR, Johnson G (2015) Surface wave climatology and its variability in the North Indian Ocean based on ERA-Interim reanalysis. Journal of Atmospheric and Oceanic Technology 32(7): 1372-1385. DOI: 10.1175/JTECH-D-14-00212.1 Amante C, Eakins BW (2009) ETOPO1 1 Arc-Minute global relief model: procedures, data sources and analysis. Psychologist 16(3): 20-25. DOI: 10.7289/V5C8276M Amrutha MM, Kumar VS, Sandhya KG, Nair TMB, Rathod JL (2016) Wave hindcast studies using SWAN nested in WAVEWATCHⅢcomparison with measured nearshore buoy data off Karwar, eastern Arabian Sea. Ocean Engineering 119: 114-124. DOI: 10.1016/j.oceaneng.2016.04.032 Ardhuin F, Rogers E, Babanin AV, Filipot JF, Magne R, Roland A, Andre VDW, Queffeulou P, Lefevre JM, Aouf L (2010) Semi-empirical dissipation source functions for ocean waves: part Ⅰ: definition, calibration and validation. Journal of Physical Oceanography 40(9): 1917-1941. DOI: 10.1175/2010JPO4324.1 Booij N, Ris RC, Holthuijsen LH (1999) A third-generation wave model for coastal regions. 1. Model description and validation. J. Geophys. Res 104: 7649-7666. DOI: 10.1029/98JC02622 Chen HB, Zhang XW, Gao F (2013)Analysis on coastal hydrodynamics and sediment condition of ADIPALA Indonesia. Journal of Waterway and Harbor 34(5): 369-375. (in Chinese) Cui K, Sun J, Feng AX (2013) Analysis of the spatial and temporal characteristics of sea surface wind field in the north Indian ocean. Transactions of Oceanology and Limnology 44(4): 34-42. (in Chinese) DOI: 10.13984/j.cnki.cn37-1141.2013.04.006 Habibie MN, Permana DS (2013) Simulasi Gelombang Ekstrim Akibat Swell Di Indonesia Menggunakan Model WAVEWATCHⅢ. Jurnal Meteorologi dan Geofisika 14(2): 99-108. DOI: 10.31172/jmg.v14i2.159 Kazeminezhad MH, Siadatmousavi SM (2017) Performance evaluation of WAVEWATCHⅢ model in the Persian Gulf using different wind resources. Ocean Dynamics 67(7): 839-855. DOI: 10.1007/s10236-017-1063-2 Komen GJ, Cavaleri L, Donelan MA, Hasselmann K, Hasselmann S, Janssen PAEM (1994) Dynamics and modelling of ocean waves. Cambridge University Press, Cambridge, UK, 498-520 Korres G, Papadopoulos A, Katsafados P, Ballas D, Perivoliotis L, Nittis K (2011) A 2-year intercomparison of the WAM-Cycle4 and the WAVEWATCH-Ⅲ wave models implemented within the Mediterranean Sea. Mediterranean Marine Science 12(1): 129-152. DOI: 10.12681/mms.57 León SPD, Bettencourt JH (2021) Composite analysis of North Atlantic extra-tropical cyclone waves from satellite altimetry observations. Advances in Space Research 68: 762-772. DOI: 10.13140/RG.2.2.15810.09921 Mentaschi L, Besio G, Cassola F, Mazzino A (2015) Performance evaluation of WavewatchⅢ in the Mediterranean Sea. Ocean Modelling 90: 82-94. DOI: 10.1016/j.ocemod.2015.04.003 Nugraheni IR, Wijayanti DP, Sugianto DN, Ramdhani A (2017) Study of inundation events along the southern coast of Java and Bali, Indonesia (case studies 4-9 June 2016). IOP Conference Series: Earth and Environmental Science 55(1): 12-14. DOI: 10.1088/1755-1315/55/1/012014 Sandhya KG, Nair TMB, Bhaskaran PK, Sabique L, Arun N, Jeykumar K(2014)Waveforecastingsystemforoperationaluseanditsvalidation at coastal Puducherry, east coast of India. Ocean Engineering 80(1): 64-72. DOI: 10.1016/j.oceaneng.2014.01.009 Seemanth M, Suchandra AB, Kumarf R, Sharma R (2016) Sensitivity analysis of dissipation parameterizations in a third-generation spectral wave model, WAVEWATCH Ⅲ for Indian Ocean. Ocean Engineering 124: 252-273. DOI: 10.1016/j.oceaneng.2016.07.023 SWAN Team (2019) SWAN scientific and technical documentation. Delft University of Technology, Delft, The Netherlands, 1-5 Tong K, Liu J, Yan M, Li Y, Yang L (2003) Space-time characteristic analysis of wind field over the south Indian ocean. Marine Science Bulletin 5(2): 5-13 NOAA/NWS Environment Modeling Center. Citing information of EMC operational wave models. U.S. National Weather Service, U. S. National Oceanic and Atmospheric Administration Available from https://polar.ncep.noaa.gov/waves/index.php. [Accessed on Jun. 23, 2021] Umesh PA, Swain J, Balchand, AN (2018) Inter-comparison of WAM and WAVEWATCH-Ⅲ in the North Indian Ocean using ERA-40 and QuikSCAT/NCEP blended winds. Ocean Engineering 164: 298- 321. DOI: 10.1016/j.oceaneng.2018.06.053 Wang J, Yu WH, Xia YJ, Liu SX, Zhang HC, Li JX (2018) Statistical analysis of long-period waves based on wave data measured at ADIPALA of Indonesia. The Ocean Engineering 36(5): 108-113. (in Chinese) DOI: 10.16483/j.issn.1005-9865.2018.05.013 WAVEWATCH Ⅲ Development Group (2016) User manual and system documentation of WAVEWATCH Ⅲ version 5.16. NOAA/NWS/NCEP/MMAB Tech. Note 329, 326 Wu AQ, Yu WH, Xia YJ, Liu SX, Zhang HC, Li JX (2018) Spectral analysis of long period waves at ADIPALA of Indonesia. Port and Waterway Engineering 8: 4-8. (in Chinese) DOI: 10.16233/j.cnki.issn1002-4972.20180731.010 Xu FM, Perrie W, Toulany B, Smith PC (2007) Wind-generated waves in hurricane Juan. Ocean Modelling 16(3-4): 188-205. DOI: 10.1016/j.ocemod.2006.09.001 Zheng CW, Li CY (2017) Propagation characteristic and intraseasonal oscillation of the swell energy of the Indian Ocean. Applied Energy 197: 342-353. DOI: 10.1016/j.apenergy.2017.04.052 Zheng C, Li C, Pan J (2018) Propagation route and speed of swell in the Indian Ocean. Journal of Geophysical Research: Oceans 123(1): 8-21. DOI: 10.1002/2016JC012585 Zheng CW, Li CY, Li XQ (2016) Temporal and spatial characteristics of wind waves, surge waves and mixed waves in the Indian Ocean. Journal of PLA University of Science and Technology (Natural Science Edition) 17(4): 379-385. DOI: 10.1002/2016JC012585 Zheng CW, Li CY (2017) Analysis of temporal and spatial characteristics of waves in the Indian Ocean based on ERA-40 wave reanalysis. Applied Ocean Research 63: 217-228. DOI: 10.1016/j.apor.2017.01.014 Zhou JJ, Cao B, Li, HB (2014) Analysis of wave characteristics facing Indian Ocean sea area and breakwater construction technical for Java inland, Indonesia. China Harbour Engineering 4: 17-20. (in Chinese) DOI: 10.7640/zggwjs201404004 Zieger S, Greenslade DJM, Aijaz S, Kepert JD, Burton A (2021) Hindcasting of tropical cyclone winds and waves. Ocean Dynamics 71(5): 559-588. DOI: 10.1007/s10236-021-01443-2