Fire Risk Quantitative Assessment of Offshore Supported Platform
https://doi.org/10.1007/s11804-021-00203-4
-
Abstract
The living area of an offshore platform is the main living place for operators in offshore oil and gas fields. Fire risk assessment plays an important role in the safety of personnel in offshore platforms. In this paper, a fire risk assessment mathematical model for offshore platforms is proposed based on a comprehensive safety assessment method. The concept of danger time is presented according to the evaluation criteria of safe evacuation. The fire risk of offshore platforms is assessed by combining probability statistics with numerical simulation. The fire risk is quantitatively assessed by using an N500 deep water semi-submersible support platform as an example. According to the FN curve, fire frequency, fire escalation probability, and casualty probability, the rationality of marine general layout is analyzed, and the general layout design could be optimized to reduce the fire risk.Article Highlights• The research on offshore platforms using quantitative methods is not perfect.• This paper quantifies the past occurrence rate and fire escalation probability of each space in the fire risk model and uses fire numerical simulation and personnel evacuation simulation tools to quantify according to the safety evacuation criteria and the proportion of casualties in the fire. -
1 Introduction
Fire is one of the main risks in the operation of offshore platforms. As a supporting platform for the main living quarters of operators in offshore oil and gas fields, the density of people in living areas is high, and the passages are narrow. A fire in an offshore platform, it will seriously threaten the lives of people. At present, the fire risk assessment of platforms is mostly based on HSE health, safety, and environment trinity management system data report for risk analysis, which is empirical analysis. However, it can only be used as a criterion to determine safety, and cannot comprehensively assess fire risk. At present, research on offshore platforms by using quantitative methods is not perfect.
Fire risk assessment research for marine and land buildings were conducted earlier in foreign countries. Relatively mature methods and technical systems already exist, and some regulations and guidelines have been formed. Foreign scholars have also conducted extensive research on fire risk assessment (Pula et al. 2005; Paik et al. 2011; Meacham et al. 2012; Šakėnaitė 2011). For example, Pula R (Pula et al. 2005) modified different submodels in the fire consequence model: fire model, overpressure shock model, and radiation model according to the unique characteristics of offshore platforms and conducted verification work. Krueger (Krueger and Smith 2003) constructed an offshore platform fire risk analysis and management method to study the application of risk assessment methods in gas jet fires. Domestic research on the quantitative risk assessment of offshore platform fires is still in its infancy, yet many research results have been achieved. For example, Wang Yanfu (Wang et al. 2018a) of the China University of Petroleum established a quantifiable fire personnel error model and took an offshore platform as an example to verify the optimized effect of the method. On the basis of the DOW index evaluation method, Yin Jialin of Shanghai Jiao Tong University (Yin 2014) used CFX and STEPS software to numerically simulate platform fire spread and personnel evacuation process, to study the available safety evacuation time and safety evacuation time assessment for a jack-up drilling platform. Li Yulian (Li 2016) of the China University of Petroleum took the production platform as an example, by establishing a probabilistic model of fire caused by human factors, equipment, and an accident shielding failure model, and they performed causal reasoning to determine the cause of fire that has the greatest impact on personnel and platforms. Although many scholars have conducted much research on fire risk assessment, few studies have focused on marine support platforms due to their unique characteristics, such as narrow space, dense personnel, relatively new ship types, many types of fire risk, slow heat dissipation, and difficulty in extinguishing fire. Data or simple qualitative methods for analysis and evaluation are needed. On the basis of the unique layout characteristics of the offshore platform, this paper quantifies the past occurrence rate and fire escalation probability of each space in the fire risk model and uses fire numerical simulation and personnel evacuation simulation tools for quantification according to the safety evacuation criteria and the proportion of casualties in the fire. This work studies the impact of fire on personnel, constructs a frequency function of the number of deaths, and performs quantitative assessment.
2 Mathematical Model of Fire Risk Assessment for Offshore Platforms
Fire risk assessment of a marine support platform is quantified by cumulatively calculating the casualty rate (IMO 1997; China Classification Society 1995) of each space, and the formula is as follows:
$$ {R}_F={f}_u\times \sum \limits_k\left(P{(E)}_{i, k}{N}_{i, k}\right) $$ (1) N Amount of space in the platform living area, where fire escalation (E) means that fire and explosion in the compartment where the initial accident occurred cannot be contained, controlled and extinguished
fi Frequency of fire scene I
Ni, k Expected number of deaths associated with all possible consequences of fire escalation (k)
The fire rate in the space shown above is a function of ground area and space use (Figure 1). Fire escalation is assessed by using various post-fire models. The conditional probability of fire escalation consequence P(E)k mainly depends on alarm, detection and fire-fighting arrangement, fire spreading ability, and fire resistance grade of bulkhead boundary. The number of deaths associated with Nk is determined by the number of people at risk of fire hazards and therefore depends on the use of space, occupancy profile and location, capacity and occupancy of fire zones, and evacuation arrangements. The fire risk model is described as follows (Figure 2):
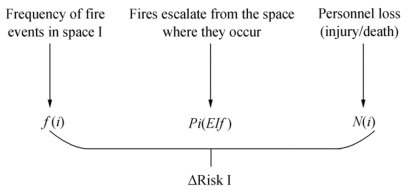 Figure 1 Summary of fire risk
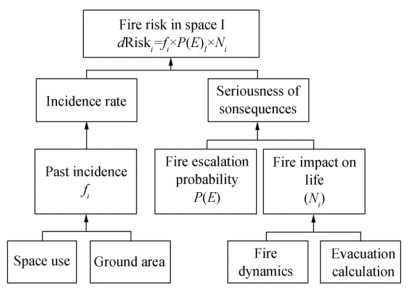 Figure 2 Fire risk model
To quantify fire risk, the probability mass function of death caused by the consequence (k) of fire scene (i) needs to be estimated, as shown in Eq. (2). With the use of the symbol of Eq. (3), the frequency of death number N can be calculated as follows (4)-(5) (Krueger and Smith 2003):
$$ {F}_N(N)=\sum \limits_{i=N}^{N_{{\mathrm{max}}}}{fr}_N(i) $$ (2) $$ {fr}_N(N)=\sum \limits_{j=1}^{n_{hz}}{fr}_{hz}\left({hz}_j\right)\times pr\left(\left.N\kern0.3em \right|\kern0.4em {hz}_j\right) $$ (3) Nmax Maximum number of crew on board
nhz Number of loss scenarios considered
hzj Represents a loss scenario, where hz2 is a fire scenario
frhz(hzj) Frequency of hzj occurring ons the platform every year
Once the loss scenario hzj occurs, prN(N|hzj) is the probability of death number N occurring.
$$ {fr}_N(N)=\sum \limits_{i=1}^n\left[{fr}_{hz}{\left({hz}_2\right)}_iP{(k)}_i{pr}_N{\left(\left.N\right|{hz}_2\right)}_{k, i}\right]\\{fr}_N(N)=\sum \limits_{i=1}^n\left[{fr}_{hz}{\left({hz}_2\right)}_iP{(k)}_i\frac{e^{-\lambda }{\lambda}^{N_{k, i}}}{N_{k, i}!}\right] $$ (4) Λ is average number of deaths.
The average number of deaths is estimated through an analysis of typical fire scenarios and evacuation simulation results, combined with the statistics of fire casualties over the years, to quantify the impact of fire on people.
3 Risk Probability Model
3.1 Fire Occurrence Probability Model
The purpose of the fire model is to estimate the frequency of fire events. The fire occurrence rate of specific ship space is affected by the following factors (Guarin 2007):
1) The use of space over the platform, i. e., different types of cabin functions.
2) Objects in space are combustibles, including material characteristics and dimensions of objects.
3) Existing heat sources are affected by dangerous situations that may lead to fire.
According to the layout and data of the living areas of ships and platforms in the past, the most important combustibles include furniture, floors, walls, ceiling covering materials, storage, and other containers (oil tanks, trash cans, etc.). Ignition sources of concern mainly include storage materials, cigarettes, sparks, hot surfaces, open fires, fireworks, and thermal operations of staff and workspace. Fire incidence has been proven to have a certain relationship with the surface area of space (Ma 2013).
The impact of dangerous situation depends on different operational factors, such as occupied space location, public/private goods, and different time, all of which are related to the actual use of space. Therefore, the estimation of the fire frequency of a specific space type should be based on the occurrence rate per unit area of the platform in the past, which is called γi. The value of γi can be represented by the data as shown in the following figure (Figure 3). Therefore, for a given area of ai in a specific space and type of use, the fire frequency is calculated according to the following formula. Then, the fire frequency of each working condition in this study is as follows:
$$ {f}_i={\gamma}_i{a}_i $$ (5) 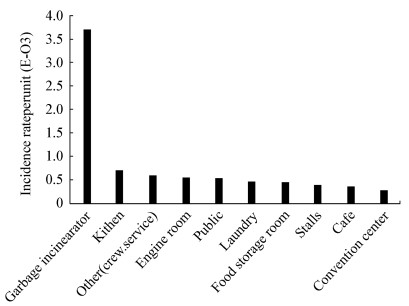 Figure 3 Fire incidence per unit areaTable 1 Fire frequency under various working conditions
Condition Area (m2) Frequency 1 14.057 7.0285 × 10⁻³ 2 14.057 7.0285 × 10⁻³ 3 88.022 3.9610 × 10⁻² 4 88.022 3.9610 × 10⁻² 5 80.971 1.2146 × 10⁻² 6 80.971 1.2146 × 10⁻² 3.2 Post-Fire Model
3.2.1 Fire escalation Probability
The function overview of the post-fire model and fire control system aims to quantify the probability of fire escalation P(E) of specific scenario/space type (i), including the following factors as shown in the following figure (Figure 4).
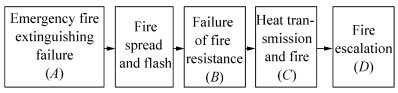 Figure 4 Simplified fire dynamic modeling
As shown in the figure above, fire escalation must go through four processes: emergency fire extinguishing failure, fire spreading and flashing, fire resistance failure, and heat transmission and fire, so their logical relationship is "and". The probability of fire escalation is expressed as follows:
$$ P(E)=P(A)\cap P(B)\cap P(C) $$ (6) If both fixed automatic fire extinguishing and manual emergency fire extinguishing fail, then emergency fire extinguishing failure will occur. Therefore, the probability of emergency fire extinguishing failure P(A) depends on the layout of automatic fire extinguishing or manual emergency fire extinguishing equipment, because this will lead to the spread of fire. Formulas for estimating emergency failure probability are generated according to the corresponding failure model:
$$ P(A)=P(A1)\times \left[P(A2)+P(A3)-P(A2)P(A3)\right] $$ (7) P(A1) Probability of failure of automatic (fixed) fire extinguishing system
P(A2) Probability of failure of artificial emergency fire extinguishing
P(A3) Probability of manual emergency fire extinguishing failure of portable and fixed fire extinguishing system
The probability P(B) of fire failure caused by fire extinguishing failure is assumed to be equivalent to an uncontrollable fire. The probability depends on the fire spreading potential B1, fire extinguishing time and efficiency B2, and boundary fire resistance grade B3 of objects in a given space.
$$ Q=\alpha {t}^2 $$ (8) Fire probability P(C) in an adjacent space depends on the characteristics of objects in the adjacent space, boundary cooling capacity, and ways, timing, and efficiency. When the heat transmitted by the fire cabin causes the temperature of any adjacent cabin to reach the flash temperature (Tflash) of the objects, the fire will spread to the adjacent cabin. The radiation from the fire compartment causes an increase in the temperature TBHD of the bulkhead that is not exposed to fire; if the probability distribution functions of Tflash and TBHD are known, then the probability of fire spread can be calculated according to the standard reliability principle.
$$ P(C)=\underset{0}{\overset{\infty }{\int }}F\left({T}_{{\mathrm{flash}}}\right)f\left({T}_{{\mathrm{BHD}}}\right){\mathrm{d}}T $$ (9) The estimation of f(TBHD) and f(Tflash) should be based on the average temperature of the ignition compartment and the flash temperature of combustibles in the adjacent compartment.
3.2.2 Fire System Layout
According to the drawings, the semi-submersible support platform accommodation area selected in this study has two fire-fighting measures: manual fire-fighting equipment and ventilation system and has fire-fighting partition. When manual fire-fighting fails, fire escalation will occur (Figure 5).
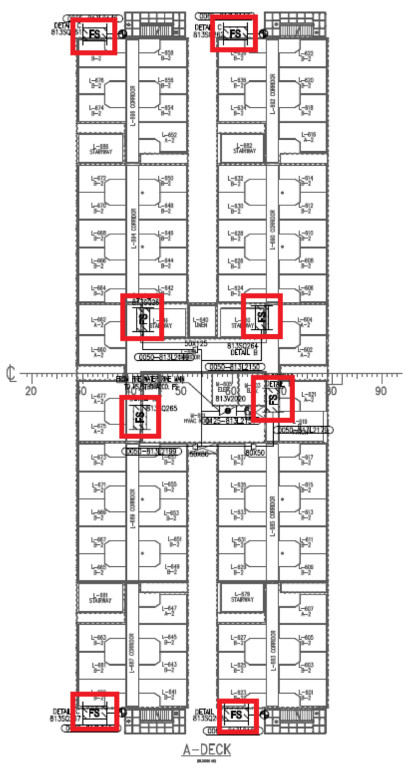 Figure 5 Distribution of fire box
3.2.3 Manual Fire Extinguisher
Manual fire extinguishing equipment in living areas, including a fire box composed of manual fire extinguishers and fire hoses, plays a major role in the long-term storage of portable fire extinguishers to ensure direct manual fire extinguishing in case of fire.
The distribution of fire boxes in deck A is taken as an example. The boxes marked with Fs (red box) are fire boxes. As shown in the figure below, the type and parameters of fire-fighting waterway belts can be divided into two types, as shown in the table below.
Table 2 Fire hose parametersNumber Size (mm) Pressure (kPa) Medium Nineteen such as 813SQ241 65 1600 Sea water Nineteen such as 813SQ266 50 1600 Sea water No automatic fire extinguishing device is available in the living area; therefore, the risk assessment considers the maximum risk principle. This study assumes that the manual fire extinguishing facilities and smoke detectors in the fire compartment are not functioning, and the failure probability of the smoke detectors is 0.01 according to the previous data and literature (Zhu et al. 2014). The failure of the manual fire extinguishing equipment is mostly due to the operator's misoperation. The probability is 0.1 based on the results of human reliability analysis.
3.2.4 Ventilation System
A ventilation system prevents smoke from accidentally spreading to smoke-proof zones, removes smoke from the smoke-proof zones within the fire-proof zones in time, and controls the air-conditioning system in the relevant zones to control ventilation, to ensure the smooth evacuation of personnel, to provide a safe refuge, to control the fire situation, and to implement manual work for firefighters. Fire fighting provides favorable conditions (Ma 2013).
The research object is located in the living area; therefore, the smoke exhaust volume of the ventilation system is not large, and its exhaust volume is 72 m3/h. By selecting part of the area, taking the same power and size of the fire source as the numerical simulation, from the simulated temperature, CO concentration, and thermal radiation, we can see that the ventilation system will not have a great impact on the spread of smoke, and has not played a role in preventing the spread of smoke. Therefore, the influence of the ventilation system is neglected in this study.
In summary, according to the data reported by WOAD, the frequency of historical fire in a semi-submersible accommodation area is 1.51×10⁻³ per year. More than 60% of the fires in the accommodation area were extinguished immediately. This finding means that the frequency of fire escalation is 6.04×10⁻⁴ before the fire is extinguished immediately.
3.3 Method for Calculating Casualties
The available time of safe evacuation tASET and the required time of safe evacuation tRSET need to be used in assessing the impact of fire on people, and the safety evacuation criteria must be met:
$$ {t}_{{\mathrm{RSET}}} \lt {t}_{{\mathrm{ASET}}} $$ (10) We can be assume that people who have not completed evacuation after tASET will be affected by the fire and will be injured or killed.
Therefore, to quantify the number of people affected by fire, this study takes the safe evacuation available time tASET as the danger time tD, and measures the time when the smoke data of different scenarios reach the tolerance standard; i.e., the danger time tD of each scenario for each danger amount is obtained by numerical simulation. The number of persons affected is x; the total number of persons passing this point is xz; and the number of persons passing this point at some time is xt.
When tD = tRSET:
$$ x={x}_z-{x}_t $$ (11) Then according to the above formula, the number of people who have not passed the measuring point when the danger time is reached is the number x affected by the fire.
4 Case Calculation and Analysis
To quantify the average number of deaths in the fire risk model, the fire dynamics and evacuation simulation are combined by numerical simulation. The number of affected people depends on the time of evacuation from each space and the time when the smoke toxicity, visibility, heat, and other conditions in these spaces become uncontrollable. The number of people affected in the fire scene can be obtained by comparing the number of people affected with the evacuation time.
4.1 Numerical Simulation of Fire Dynamics
4.1.1 Fire Model
The living area of this offshore platform is 24.8-m long, 66.8-m wide, and 3.3-m high. It has six decks: the main deck; decks A, B, C, and D; and bridge deck. A full-scale model of the living area is established, and the fire numerical simulation is carried out. The model is shown in the following figure.
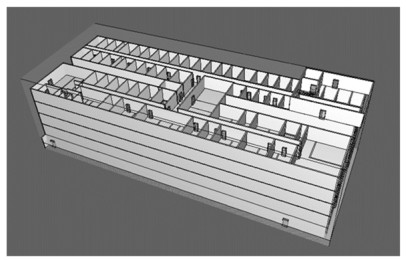 Figure 6 Full-scale living area model
The size of the grid is related to the accuracy of the simulation results. Some studies have shown that the size of the grid is related to the characteristics of fire source. The minimum length size of fire can be expressed by the characteristic diameter D* of the fire source (Su 2017):
$$ {D}^{\ast }={\left[\frac{Q}{\rho_0{{\mathrm{c}}}_0{T}_0\sqrt{g}}\right]}^{2/5} $$ (12) ρ0 Ambient air density (kg/m3)
c0 Specific heat of air (J/K)
T0 Ambient temperature (K)
G Gravity acceleration (m/s2)
To study the motion law of flue gas, the mesh size is set to 0.25 m × 0.25 m × 0.25 m considering the problem of computational complexity.
The combustibles in living areas can be classified as cloth products, wood products, and electronic products. According to the description of the fire growth factor in the Technical Standards for Building Smoke Control and Exhaust System and the burning power of actual combustibles, the fire power of these products is about 200-1400 kW, and the formula of fire heat release rate is given below. Therefore, in the simulation, the power of the fire source should be 600 and 1000 kW.
$$ Q=\alpha {t}^2 $$ (13) Q Heat release rate
T Fire time
A Fire growth factor (Ministry 2018), Nelson pointed out that the initial growth of fire can be divided into four types: slow, medium, fast, and ultra-fast, with values of 0.002931, 0.01127, 0.04689, and 0.1878 respectively.
4.1.2 Working Condition Setting
To simulate the most dangerous situation, the main deck is selected as the fire deck according to the bottom to top movement of smoke. A fire location is selected on the port, middle, and starboard side, respectively; simulation time is 900 s; and the working conditions are set as shown in Table 3.
Table 3 Working condition settingCondition Ignition location Fire power (kW) Time to reach this power (s) 1 Port 1000 72.97 2 Port 600 113.13 3 Middle 1000 72.97 4 Middle 600 113.13 5 Starboard 1000 72.97 6 Starboard 600 113.13 The temperature, visibility, and CO concentration of 1.7 m face were measured. According to the data, when the distance is far larger than the flame size, the flame can be approximately regarded as a point radiation source, and the heat flux is inversely proportional to the square of the distance, which is equivalent to the sphere model. When the flame size is far larger than the distance, the flame can be approximated as an infinite cylinder, and the heat flux is inversely proportional to the distance (Wang et al. 2018b). Therefore, because the distance between the measuring point and the fire source is much larger than the size of the fire source, the influence of thermal radiation on the personnel at the measuring point can be neglected. The location of the measuring point is similar to that given above.
4.2 Evacuation Calculation and Analysis
4.2.1 Evacuation Calculation
The evacuation software "Exodus" is used to build a full-scale model of the platform living area, calculate the evacuation time, and analyze the evacuation situation. The daily reaction time is 300 s according to MSC. 1533 guidelines, and the exit is set at two ports leading to the boarding station on the port side. The distribution of personnel on decks and other characteristics is given in Tables 4.
Table 4 Distribution of deck personnelMain deck Deck A Deck B Deck C Deck D Bridge deck 98 150 144 70 38 0 Table 5 Personnel characteristicsAttribute characteristics Average Minimum Maximum Age 38.76 20.00 59.00 Agility 5.11 3.01 7.00 Drive 7.96 1.01 15.00 Fwalk (m/s) 1.17 0.80 1.50 Walk (m/s) 1.05 0.72 1.35 Crawl (m/s) 0.23 0.16 0.30 Leap (m/s) 0.94 0.64 1.20 Mobility 1.00 1.00 1.00 Patience (s) 1000.00 1000.00 1000.00 Response (s) 297.94 200.29 399.30 Weight (kg) 62.37 49.63 80.00 The final evacuation time was 477.59 s. 4.2.2 Evacuation Analysis
Evacuation simulation shows that no congestion occurred during the evacuation process, but there are many places where people flow, such as stairs, slow steps, and corridors just outside staircases, as shown in the following figure.
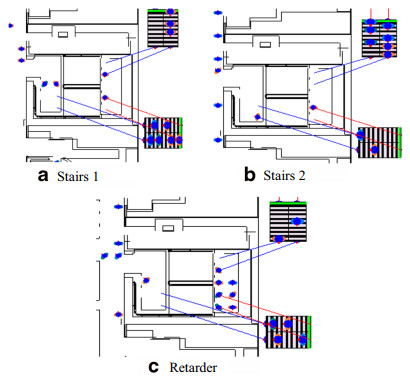 Figure 7 Areas with larger traffic
In some areas, because of the merging of multiple streams of people during evacuation, such as the location of the red box in the following picture, and the relatively narrow, corridor, congestion may occur easily at a certain time when more people are passing through. Once smoke accumulates here, it will cause great harm to people. Therefore, the ventilation in this area needs to be strengthened to reduce the danger of smoke accumulation to evacuation personnel.
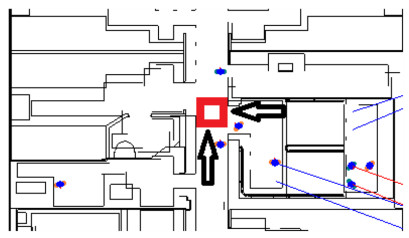 Figure 8 Personnel confluence area
4.3 Numerical Simulation Analysis of Fire
4.3.1 Minimum Hazard Time
The hazard time when the smoke data at the locations of the test points of each working condition reach the acceptable hazard value is derived as follows. When one of the three indicators exceeds the standard, the lives of people will be affected. Thus, the minimum dangerous time is taken as the shortest time in three instances. The acceptance criteria refer to TNO Green Paper "Methods for the determination of possible damage" and "Ocean Engineering Design Manual-Risk Assessment Brochure" and the impact of environmental temperature on personnel.
Table 6 Calculation of dangerous time under condition 1Measuring points Temperature hazard time (℃) CO concentration (× 10−6) Visibility hazard time (s) Minimum hazard time (s) Left 1 46.0 20 87.3 87.3 Left 2 27.3 > 900 198.9 198.9 Middle 1 27.6 7.2 221.4 221.4 Middle 2 27.2 8.1 203.4 203.4 Right 1 38.4 59 90.9 90.9 Right 2 26.9 > 900 198.9 198.9 Table 7 Calculation of dangerous time under condition 2Measuring points Temperature hazard time (℃) CO concentration (× 10−6) Visibility hazard time (s) Minimum hazard time (s) Left 1 40.0 11 147.6 147.6 Left 2 26.7 > 900 333.9 333.9 Middle 1 26.9 > 900 360.9 360.9 Middle 2 26.6 5 349.2 349.2 Right 1 35.9 40 157.5 157.5 Right 2 26.3 > 900 333.9 333.9 Table 8 Calculation of dangerous time under condition 3Measuring points Temperature hazard time (℃) CO concentration (× 10−6) Visibility hazard time (s) Minimum hazard time (s) Left 1 28.6 > 900 207.1 207.1 Left 2 28.9 > 900 207.8 207.8 Middle 1 29.1 > 900 171.0 171.0 Middle 2 28.5 > 900 174.6 174.6 Right 1 32.1 > 900 140.4 140.4 Right 2 28.2 > 900 213.3 213.3 Table 9 Calculation of dangerous time under condition 4Measuring points Temperature hazard time (℃) CO concentration (× 10−6) Visibility hazard time (s) Minimum hazard time (s) Left 1 27.8 > 900 330.3 330.3 Left 2 28.0 > 900 330.3 330.3 Middle 1 28.0 > 900 454.5 454.5 Middle 2 27.6 > 900 454.5 454.5 Right 1 30.5 > 900 295.2 295.2 Right 2 27.5 > 900 378.0 378.0 Table 10 Calculation of dangerous time under condition 5Measuring points Temperature hazard time (℃) CO concentration (× 10−6) Visibility hazard time (s) Minimum hazard time (s) Left 1 28.7 > 900 199.8 199.8 Left 2 26.2 > 900 345.6 345.6 Middle 1 26.2 6.9 426.6 426.6 Middle 2 26.2 7.9 335.7 335.7 Right 1 26.3 1.7 476.1 476.1 Right 2 25.8 > 900 345.6 345.6 Table 11 Calculation of dangerous time under condition 6Measuring points Temperature hazard time (℃) CO concentration (× 10−6) Visibility hazard time (s) Minimum hazard time (s) Left 1 28.1 > 900 287.9 287.9 Left 2 26.2 > 900 466.2 466.2 Middle 1 25.9 > 900 768.8 768.8 Middle 2 25.7 > 900 445.5 445.5 Right 1 25.8 1.1 > 900 > 900 Right 2 25.7 > 900 485.1 485.1 4.3.2 Numerical Simulation Analysis of Fire
We can see the spread of smoke through the simulation of fire occurrence and development under different conditions. Case 1 is taken as an example. The following figure shows the visibility of the nose of 1.7 m population at different times.
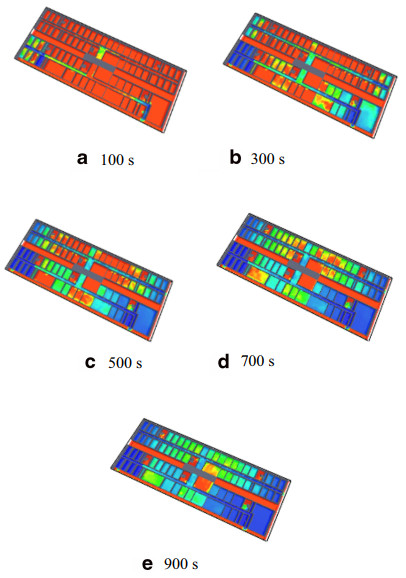 Figure 9 Variation of visibility under condition 1. a 100 s b 300 s c 500 s d 700 s e 900
As can be seen from the above figures and data, the smoke temperature and CO concentration in the evacuation passage do not reach the level which evacuation is affected, but the visibility of each working condition can be reduced to less than 10 m in a short time, which has a tremendous impact on evacuation.
4.4 Casualty Calculation
In the last section, the number of people affected by each working condition is the number of people who have not passed the point when one of the three items of temperature, CO concentration, and visibility at the measuring point exceeds the acceptable standard.
Table 12 Number of persons affected under condition 1Measuring points Left 1 Left 2 Middle 1 Middle 2 Right 1 Right 2 Minimum hazard time (s) 87.3 198.9 221.4 203.4 90.9 198.9 Number of affected persons 42 37 0 1 5 4 Total number of people 89 Table 13 Number of persons affected under condition 2Measuring points Left 1 Left 2 Middle 1 Middle 2 Right 1 Right 2 Minimum hazard time (s) 147.6 333.9 360.9 349.2 157.5 333.9 Number of affected persons 42 16 0 1 5 3 Total number of people 67 Table 14 Number of persons affected under condition 3Measuring points Left 1 Left 2 Middle 1 Middle 2 Right 1 Right 2 Minimum hazard time (s) 207.1 207.8 171.0 174.6 140.4 213.3 Number of affected persons 42 36 0 1 4 15 Total number of people 98 Table 15 Number of persons affected under condition 4Measuring points Left 1 Left 2 Middle 1 Middle 2 Right 1 Right 2 Minimum hazard time (s) 330.3 330.3 454.5 454.5 295.2 378.0 Number of affected persons 76 45 0 0 12 1 Total number of people 134 Table 16 Number of persons affected under condition 5Measuring points Left 1 Left 2 Middle 1 Middle 2 Right 1 Right 2 Minimum hazard time (s) 199.8 345.6 426.6 335.7 476.1 345.6 Number of affected persons 43 14 0 1 0 1 Total number of people 59 Table 17 Number of persons affected under condition 6Measuring points Left 1 Left 2 Middle 1 Middle 2 Right 1 Right 2 Minimum hazard time (s) 287.9 466.2 768.8 445.5 > 900 485.1 Number of affected persons 30 0 0 0 0 0 Total number of people 8 The number of deaths in fires is not equal to the number of affected people. Therefore, according to the statistics of the Fire Department of the Ministry of Public Security to the table below, the average proportion of deaths in the number of affected people can be calculated as 51.59%.
Table 18 Proportion of casualties among the population affected by accidents over the yearsAccidents Deaths (P) Injured (P) Mortality ratio (%) 1994.12.7, Xinjiang 323 130 71.30 2010.11.15, Shanghai 58 71 44.96 2013.6.3, Dehui 121 76 61.42 2014.3.26, Jieyang 12 5 70.59 2014.8.2, Kunshan 97 163 37.31 2014.9.22, Zhuzhou 13 33 28.26 2014.12.15, Changyuan 11 24 31.43 2017.2.5, Tiantai 18 18 50.00 2017.11.18, Beijing 19 8 70.37 2017.8.25, Harbin 20 23 46.51 2018.8, Chinese urban fire 51 41 55.43 According to the proportion of deaths in fires to the number of affected people, the expected number of deaths in all working conditions of this study can be calculated, and the expected average number of deaths is 39.
4.5 Risk Quantification
4.5.1 FN Curve
According to the description of the FN curve in Eqs. (2)-(5) and the calculation of fire frequency, escalation probability, and casualty number in a different space above, the frequency curve frN(N) of annual death number N is obtained by the following formula, and then, the FN curve can be calculated and drawn. The risk is within acceptable range.
$$ {fr}_N(N)=\sum \limits_{i=1}^n\left[1.15\times {10}^{-17}\frac{39^{N_{k, i}}}{N_{k, i}!}\right] $$ (14)  Figure 10 FN curve of fire risk in platform living area
The above simulation and calculation show that the risk to life is higher with a greater number of people in the platform living area. The risk of fire can be reduced by paying attention to the following points:
1) Reasonable evacuation strategies should be formulated, and special personnel should be positioned at personnel confluence to guide evacuation.
2) People's awareness of disasters and fire prevention and control should be strengthened to reduce their reaction time.
3) The personnel with strong mobility should be assigned to the upper deck, thereby ensuring the successful evacuation of personnel with poor mobility.
4.5.2 Suggestions on General Arrangement Optimization
On the basis of the above fire simulation results and evacuation results, the following suggestions can be made for the overall layout design:
1) The stairwell should be equipped with double doors and compartments between them, to block smoke and reduce the spread of smoke to the stairwell.
2) To reduce smoke concentration in crowded areas, a smoke shield should be installed in corridors before the confluence area, and the ventilation effect before the smoke shield should be strengthened.
3) The ventilation at the exit of the platform should be strengthened, because no matter where a fire occurs, the smoke will quickly spread to the end of the corridor and accumulate, causing harm to those who are about to evacuate to the exit.
In this paper, the second suggestion is simply verified by simulation, and the visibility at 1.7-m height behind the smoke shield is simulated with or without smoke shield. After the variables of the fire source compartment, fire power, and combustibles are unified, the following conclusions can be drawn (the line above the figure is the case of smoke shield, while the line below is the case without smoke shield).
 Figure 11 Influence of smoke shield on visibility
The simulation results show that the smoke layer decreases to 1.7 m in 550 s with a smoke shield, and the visibility never falls below 10 m. Without a smoke shield, the smoke layer decreases to 1.7 m in 360 s, and the visibility decreases rapidly and affects evacuation. Obviously, adding a smoke shield can reduce the harm of smoke to evacuated people.
5 Conclusions
On the basis of a fire risk model, fire frequency, and escalation probability, this paper quantifies the situation of people affected by fire through a numerical simulation and probability analysis and obtains the number of people that perish in the fire. This paper also calculates the frequency curve frN(N) of the number of deaths occurring annually and calculates the FN curve to determine the amount of fire risk in the living area of offshore platforms. An evaluation is performed.
1) In the process of fire risk assessment, a fire risk model is established first. The fire risk model, similar to a general risk model, is a combination of possibility and severity. The possibility includes the probability of fire occurrence and escalation, and the severity generally refers to the degree of damage to personnel, equipment, facilities, and environment. The risk assessment method in this study quantified the risk of personnel in the severity of the fire. In accordance with the evacuation criteria, the concept of danger time and a formula for calculating the number of people affected by the fire are proposed.
2) In accordance with the evacuation and fire numerical simulation results, staircases and staircases should accommodate a larger density of people. Staircases are currently narrow, and they are the main passage of smoke from bottom to top. Thus, a fire protection system should be set up at staircases and maintained at all times. During personnel confluence, people flow increases, but the width of the passage remains unchanged, and congestion easily occurs. Therefore, these dangerous areas need special personnel who will guide evacuation and enhance its efficiency.
3) On the basis of the fire risk model, the risk assessment method in this paper can quantify the impact of smoke on people when a fire occurs by combining numerical simulation with probability analysis. Through the obtain frequency curve frN(N) and the fire risk FN curve drawn in the living area of the platform, we can see that the risk of the platform in this study is within the acceptable range through the curve. Strategies and general layout design proposals are briefly validated. The final evaluation results provide a reference for the platform to formulate a reasonable evacuation strategy, create an efficient fire control system, and develop awareness among personnel.
-
Figure 1 Summary of fire risk
Figure 2 Fire risk model
Figure 3 Fire incidence per unit area
Figure 4 Simplified fire dynamic modeling
Figure 5 Distribution of fire box
Figure 6 Full-scale living area model
Figure 7 Areas with larger traffic
Figure 8 Personnel confluence area
Figure 9 Variation of visibility under condition 1. a 100 s b 300 s c 500 s d 700 s e 900
Figure 10 FN curve of fire risk in platform living area
Figure 11 Influence of smoke shield on visibility
Table 1 Fire frequency under various working conditions
Condition Area (m2) Frequency 1 14.057 7.0285 × 10⁻³ 2 14.057 7.0285 × 10⁻³ 3 88.022 3.9610 × 10⁻² 4 88.022 3.9610 × 10⁻² 5 80.971 1.2146 × 10⁻² 6 80.971 1.2146 × 10⁻² Table 2 Fire hose parameters
Number Size (mm) Pressure (kPa) Medium Nineteen such as 813SQ241 65 1600 Sea water Nineteen such as 813SQ266 50 1600 Sea water Table 3 Working condition setting
Condition Ignition location Fire power (kW) Time to reach this power (s) 1 Port 1000 72.97 2 Port 600 113.13 3 Middle 1000 72.97 4 Middle 600 113.13 5 Starboard 1000 72.97 6 Starboard 600 113.13 Table 4 Distribution of deck personnel
Main deck Deck A Deck B Deck C Deck D Bridge deck 98 150 144 70 38 0 Table 5 Personnel characteristics
Attribute characteristics Average Minimum Maximum Age 38.76 20.00 59.00 Agility 5.11 3.01 7.00 Drive 7.96 1.01 15.00 Fwalk (m/s) 1.17 0.80 1.50 Walk (m/s) 1.05 0.72 1.35 Crawl (m/s) 0.23 0.16 0.30 Leap (m/s) 0.94 0.64 1.20 Mobility 1.00 1.00 1.00 Patience (s) 1000.00 1000.00 1000.00 Response (s) 297.94 200.29 399.30 Weight (kg) 62.37 49.63 80.00 The final evacuation time was 477.59 s. Table 6 Calculation of dangerous time under condition 1
Measuring points Temperature hazard time (℃) CO concentration (× 10−6) Visibility hazard time (s) Minimum hazard time (s) Left 1 46.0 20 87.3 87.3 Left 2 27.3 > 900 198.9 198.9 Middle 1 27.6 7.2 221.4 221.4 Middle 2 27.2 8.1 203.4 203.4 Right 1 38.4 59 90.9 90.9 Right 2 26.9 > 900 198.9 198.9 Table 7 Calculation of dangerous time under condition 2
Measuring points Temperature hazard time (℃) CO concentration (× 10−6) Visibility hazard time (s) Minimum hazard time (s) Left 1 40.0 11 147.6 147.6 Left 2 26.7 > 900 333.9 333.9 Middle 1 26.9 > 900 360.9 360.9 Middle 2 26.6 5 349.2 349.2 Right 1 35.9 40 157.5 157.5 Right 2 26.3 > 900 333.9 333.9 Table 8 Calculation of dangerous time under condition 3
Measuring points Temperature hazard time (℃) CO concentration (× 10−6) Visibility hazard time (s) Minimum hazard time (s) Left 1 28.6 > 900 207.1 207.1 Left 2 28.9 > 900 207.8 207.8 Middle 1 29.1 > 900 171.0 171.0 Middle 2 28.5 > 900 174.6 174.6 Right 1 32.1 > 900 140.4 140.4 Right 2 28.2 > 900 213.3 213.3 Table 9 Calculation of dangerous time under condition 4
Measuring points Temperature hazard time (℃) CO concentration (× 10−6) Visibility hazard time (s) Minimum hazard time (s) Left 1 27.8 > 900 330.3 330.3 Left 2 28.0 > 900 330.3 330.3 Middle 1 28.0 > 900 454.5 454.5 Middle 2 27.6 > 900 454.5 454.5 Right 1 30.5 > 900 295.2 295.2 Right 2 27.5 > 900 378.0 378.0 Table 10 Calculation of dangerous time under condition 5
Measuring points Temperature hazard time (℃) CO concentration (× 10−6) Visibility hazard time (s) Minimum hazard time (s) Left 1 28.7 > 900 199.8 199.8 Left 2 26.2 > 900 345.6 345.6 Middle 1 26.2 6.9 426.6 426.6 Middle 2 26.2 7.9 335.7 335.7 Right 1 26.3 1.7 476.1 476.1 Right 2 25.8 > 900 345.6 345.6 Table 11 Calculation of dangerous time under condition 6
Measuring points Temperature hazard time (℃) CO concentration (× 10−6) Visibility hazard time (s) Minimum hazard time (s) Left 1 28.1 > 900 287.9 287.9 Left 2 26.2 > 900 466.2 466.2 Middle 1 25.9 > 900 768.8 768.8 Middle 2 25.7 > 900 445.5 445.5 Right 1 25.8 1.1 > 900 > 900 Right 2 25.7 > 900 485.1 485.1 Table 12 Number of persons affected under condition 1
Measuring points Left 1 Left 2 Middle 1 Middle 2 Right 1 Right 2 Minimum hazard time (s) 87.3 198.9 221.4 203.4 90.9 198.9 Number of affected persons 42 37 0 1 5 4 Total number of people 89 Table 13 Number of persons affected under condition 2
Measuring points Left 1 Left 2 Middle 1 Middle 2 Right 1 Right 2 Minimum hazard time (s) 147.6 333.9 360.9 349.2 157.5 333.9 Number of affected persons 42 16 0 1 5 3 Total number of people 67 Table 14 Number of persons affected under condition 3
Measuring points Left 1 Left 2 Middle 1 Middle 2 Right 1 Right 2 Minimum hazard time (s) 207.1 207.8 171.0 174.6 140.4 213.3 Number of affected persons 42 36 0 1 4 15 Total number of people 98 Table 15 Number of persons affected under condition 4
Measuring points Left 1 Left 2 Middle 1 Middle 2 Right 1 Right 2 Minimum hazard time (s) 330.3 330.3 454.5 454.5 295.2 378.0 Number of affected persons 76 45 0 0 12 1 Total number of people 134 Table 16 Number of persons affected under condition 5
Measuring points Left 1 Left 2 Middle 1 Middle 2 Right 1 Right 2 Minimum hazard time (s) 199.8 345.6 426.6 335.7 476.1 345.6 Number of affected persons 43 14 0 1 0 1 Total number of people 59 Table 17 Number of persons affected under condition 6
Measuring points Left 1 Left 2 Middle 1 Middle 2 Right 1 Right 2 Minimum hazard time (s) 287.9 466.2 768.8 445.5 > 900 485.1 Number of affected persons 30 0 0 0 0 0 Total number of people 8 Table 18 Proportion of casualties among the population affected by accidents over the years
Accidents Deaths (P) Injured (P) Mortality ratio (%) 1994.12.7, Xinjiang 323 130 71.30 2010.11.15, Shanghai 58 71 44.96 2013.6.3, Dehui 121 76 61.42 2014.3.26, Jieyang 12 5 70.59 2014.8.2, Kunshan 97 163 37.31 2014.9.22, Zhuzhou 13 33 28.26 2014.12.15, Changyuan 11 24 31.43 2017.2.5, Tiantai 18 18 50.00 2017.11.18, Beijing 19 8 70.37 2017.8.25, Harbin 20 23 46.51 2018.8, Chinese urban fire 51 41 55.43 -
China Classification Society (1995) Guidelines for the application of integrated ship safety assessment. China Classification Society, pp 46–47 Guarin L (2007) Dsssesign for fire safety. Proceedings of the 3rd International Conference on Design for Safety, San Francisco IMO (1997) Interim guidelines on the application of formal safety assessment (FSA) to the IMO rule-making process: MSC Circ, 829/MEPC Circ. 335 Krueger J, Smith D (2003) A practical approach to fire hazard analysis for offshore structures. J Hazard Mater 104(1-3): 107–122 https://doi.org/10.1016/S0304-3894(03)00238-3 Li Y (2016) Probability prediction of offshore platform fire based on dynamic Bayesian network. China University of Petroleum (East China) Ma Z (2013) Fault analysis and cascading failure model of ship fire fighting system. Harbin Engineering University, Harbin Meacham BJ, Dembsey NA, Schebel K, Johann MA, Tubbs JS (2012) Use of small-scale test data to enhance fire-related threat, vulnerability, consequence and risk assessment for passenger rail vehicles. J Homeland Secur Emerg Manag 9(1): 1. https://doi.org/10.1515/1547-7355.1850 Ministry of Housing and Urban-Rural Construction of the People's Republic of China, General Administration of Quality Supervision, Inspection and Quarantine of the People's Republic of China (2018) Technical Standard for Building Smoke Control and Exhaust System. GB pp 51251–2017 Paik JK, Czujko J, Kim BJ (2011) Quantitative assessment of hydrocarbon explosion and fire risks in offshore installations. Mar Struct 24(2): 73–96. https://doi.org/10.1016/j.marstruc.2011.02.002 Pula R, Khan FI, Veitch B, Amyotte PR (2005) Revised fire consequence models for offshore quantitative risk assessment. J Loss Prev Process Ind 18(4-6): 443–454. https://doi.org/10.1016/j.jlp.2005.07.014 Šakėnaitė J (2011) A comparison of methods used for fire safety evaluation. Mokslas: Lietuvos Ateitis 2(6): 36–42. https://doi.org/10.3846/mla.2010.109 Su X (2017) Effectiveness analysis of mechanical smoke exhaust in atrium of a museum. Fire Tech Prod Inf 1: 8–12 Wang Y, Biao L, Wang J, Peina Y (2018a) Risk assessment of offshore platform fire and explosion based on improved CREAM method. China Offshore Platform 33(2): 74–78 Wang Y, Dan Z, Tonglai Z, Suling L, Ying L, Wang Y (2018b) Propellant combustion heat radiation propagation law. Explosion Impact 38(1): 212–216 Yin Z (2014) Simulation study on fire and evacuation of a jack-up offshore platform. Shanghai Jiao Tong University Zhu Y, Xinming Q, Dong X, Sicheng L (2014) Jiwa nuclear power plant fire failure probability analysis. Chin J Saf Sci 24(4): 44–49