1 Introduction
Smartphones can be accessed almost anywhere and anytime. The number of smartphone users worldwide is over 1.06 billion representing approximately 60% of cellular phone users at present and growing rapidly(Daponte et al., 2013). In 2015, the number of smartphone users, in the US only, is expected to be around 148.6 millions. Due to the growth of the smartphone market, there are an enormous number of applications in use. Today’s smartphones are equipped with a gyro-sensor system that enables various applications related to engineering measurements. In this study, a smartphone is used with a clinometer application and a motion recorder. It can be used for st and -alone measurements, as mentioned by Kuhn and Vogt(2013). Such new technologies bring improvements in safety, security, and efficiency in navigation, to naval engineering and boating in general. Furthermore, the use of such devices for navigation will greatly reduce dedicated equipment costs.
In the present work, measurement of the centre of gravity 6 degrees of freedom(DOF)is carried out with a smartphone attached to the ship. This experiment uses an application implemented on Google™ Android™.
2 Experimental methods in ship stabilityThe instantaneous ship motion consists of 6 DOF, as shown in Fig. 1, and these movements need to be measured and recorded in the phone. The linear acceleration, surge, sway, and heave of a ship can be measured by using an acceleration sensor, while the instantaneous angular velocity, roll, pitch, and yaw of a ship can be measured by a gyroscopic sensor. Also, post-processing tools, such as recording, filtering, and integration of the signals, is necessary. Fortunately, all these features are available in smartphones. Fig. 2 shows the coordinate system related to a smartphone, allowing the direct readout of the 6 accelerations of the ship in real-time. In order to accurately transfer the ship movement to the smartphone’s sensors, the device has to be properly attached to the ship.

|
| Fig. 1 Ship motions with the 6 DOF |

|
| Fig. 2 Smartphone motions with the 6 DOF |
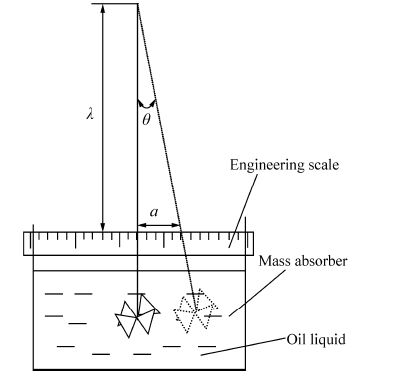
Although all 6 DOF have direct impact on ship behaviour, the rolling motion is probably the most important parameter for assessing ship stability. Usually ship inclining tests use a special tool called a stabilograph or stabilometer to measure the roll and heel(Lewis, 1988). Basically it consists of a heavy metal pendulum balanced on a knife edge and connected to a pointer to record the heel angle readings, as shown in Fig. 3. This measurement can also be carried out by the pendulum technique as shown in Fig. 4. It is well known, among professionals, that this method of measurement has a lot of hassles, such as readout, precision, and bulk. Furthermore, the experiment must be conducted with careful attention as required by regulations from the International Maritime Organization(IMO, 2009), and FAO Food and Agriculture Organization(Gudmundsson, 2009) and national authority.

|
| Fig. 3 Stabilograph |
|
| Fig. 4 Traditional tilt measurement based on a pendulum |
Nowadays, the set-up shown above is replaced by a GM-meter(Cota, 1985)which is a dedicated electronic instrument that measures seaworthiness parameters(roll period, gyroscopic platforms). Such devices are based on accelerometer sensors. Sensor outputs can be fed directly to an on-board computer for stability evaluations(IMO MSC.1/Circ.1228). However, they are very expensive and must be used in accordance with the rules, so they are not common, especially in small ships. Several works have been devoted to this subject. Griffin et al.(1985)developed, and patented in 1987, an instrument based on spectral analysis of vessel roll movement in order to determine metacentric height. These instruments are not compulsory by international regulators such as IMO, except for passenger vessels which follow IMO resolution A749 and MSC.267(85), as adopted 4th December 2008.
3 The assessment of metacentric height 3.1 The inclining experimentThe inclining experiment, also known as inclining test, is performed on a marine vessel to determine her stability atitude, empty ship weight, and the coordinates of her centre of gravity. The test is applied to newly constructed ships, to ships altered in ways that could affect stability, and for any changes in stability during a voyage. Inclining experiments and the rolling period test procedures are specified for all ships by the IMO and other international associations. For fishing vessels specifically, the FAO gives comprehensive and easy to underst and instructions for fisherpeople.
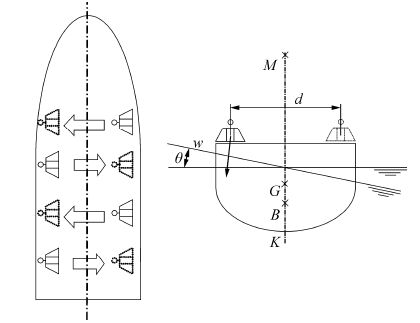
The inclining test is usually done inshore in calm weather, in still water and free of mooring restraints, to achieve accuracy. Basically, the test determines the metacentric height GM by moving weights transversely as illustrated in Fig. 5. The displacement of a vessel Δ can be readily determined by reading the draft and comparing with known hydrostatic curves. The GM magnitude, which dominates stability, can be estimated from the design, but the inclining test gives a more reliable value of this parameter.
|
| Fig. 5 Schematic diagram of the inclining experiment |
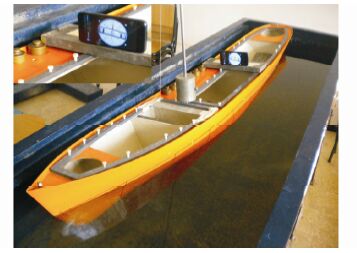
Figs. 5 and 6 show a common set-up for the inclining test. A plumb line is hung with a bob immersed in a water tank, that serves like an oscillation damper, as shown in Fig. 4. The mass w is displaced transversely with the distance d. The resulting heel angle, assumed small is given by(Biran, 2003):
| ${\rm{tan}}\left( \theta \right) = {{w{\kern 1pt} d} \over {\Delta {\kern 1pt} \overline {GM} }}$ | (1) |
|
| Fig. 6 Experimental setup |
A suitable way of checking the results is to verify the linear relationship between the heeling moments per unit displacement wd/Δ and the heel angle tangents tan(θ).
It’s worth noting that this theory is applied only for a small heel angle θ<5°. Thus, it is assumed that tan(θ)≈sin(θ)≈θ where θ is in radians and wd/Δ can be assumed to be the uprighting lever GZ.
| ${{w{\kern 1pt} d} \over {\Delta {\kern 1pt} }}{\rm{ = }}\overline {GM} {\rm{tan}}\left( \theta \right)$ | (2) |
Eg.(2)shows that the ideal plot should be a straight line; with the slope GM. In the past, naval architects fitted a straight line by eye through the plotted points. Nowadays computers and many h and calculators easily do least-squares fit.
3.2 The rolling-period testEven though the rolling-period test is just recommended, not compulsory, by the regulations, it can be a quick estimation of the $\overline {GM} $ . This test is applicable only for a round bilge hulls without a bilge keel. Basically, in this test the ship is inclined to a small heel angle up to θ ≈ 5° or even to θ ≈ 10° and then released. The ship should oscillate with its natural roll period and the result is a damped oscillation around the static heel of equilibrium. Hence, the natural roll period and the damping increment can be determined. Usually a stopwatch is used to time at least four complete rolling periods in order to measure this period.
In linear theory, ship roll is assumed to be a one degree of freedom system. Hence her natural period is a function of restoring moment and a mass moment of inertia. Therefore, the period is determined by Eq.(s), per Weiss:
${T_r} = {{2{C_{r{\kern 1pt} }}B} \over {\sqrt {\overline {GM} } }}$
(3)
There are different ways to obtain the value of Cr. It can be taken from shipyard documentation, or calculated according to the IMO Guidelines as:
| \[{{C}_{r}}=0.373+0.023\left( {}^{B}\!\!\diagup\!\!{}_{d}\; \right)-0.043\left( {}^{\text{LPP}}\!\!\diagup\!\!{}_{100}\; \right)\] | (4) |
For a large vessel(length overall greater than 24 m). However, for a conventional fishing boat(length overall less than 24 m)the stability is found satisfactory when the rolling period Tr value in seconds is less than the value of the Breadth B(m). Regardless of the units, this is practical for fisherpeople to use, as stated by Gudmundsson(2009). It has to be noted that a rolling period test should be conducted when the vessel is loaded according to the operating conditions.
4 The experiment setupIn order to assess the capabilities of smartphones to perform a stability experiment, the tests are carried out in a ship stability laboratory. Fig. 6 shows the experiment apparatus.
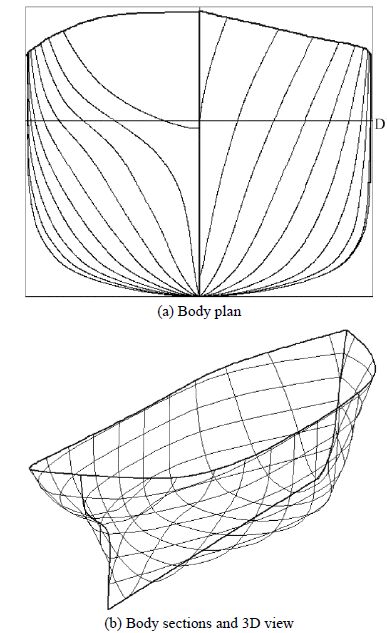
4.1 Vessel modelThe vessel model, referenced NA8-14 according to the manufacturer, is chosen both for its well documented hydrostatic data and its high finish grade. This model is the parent form of the British Ship Research Association(BSRA)trawler series(Pattulo and Thomson, 1965). Furthermore, this trawler series is a subject of extensive research and publication. Its principal characteristics are depicted in Table 1. Fig. 7(a)shows the body plan, whilst the 3D view of the experimental hull is shown in Fig. 7(b).
| Parameters | Ship | Model |
| Scale | 1:1 | 1:25 |
| Length between perpendiculars LPP/m | 45.72 | 1.82 |
| Breadth B/m | 8.03 | 0.32 |
| Depth D/m | 6.40 | 0.256 |
| Draft at DWL T/m | 4.06 | 0.16 |
| Displacement volume at DWL/m3 | 839.5 | 0.05 |
| Block coefficient Cb | 0.564 | |
|
| Fig. 7 The fishing vessel |
The model is fitted with internal bulkheads, and supplied with the necessary ballast and trimming weights. It is constructed and moulded in glass reinforced plastic(GRP). The hull is fitted with a number of transverse watertight bulkheads in their correct positions. Flooding valves are also fitted. In this study, only one partly loaded draft is tested. The model is loaded at its design load line draft DWL.
To carry out the experiment some conditions are carefully set to be as close as possible to full scale conditions, such as draft, loadcase, and centre of gravity. The chosen loadcase of the model gives a draft of d = 160 mm to reflect the real ship.
The experiment parameters are summarized in Table 2. It has to be noted that the smartphone weight 144.58 g is included in the model displacement. The smartphone is mounted along the model’s centerline, in order to avoid vertical acceleration due to the roll motion. This is achieved using high strength double-sided tape.
| Parameters | Values |
| Number of weight | 6 |
| Weight moved w/kg | 0.200 |
| Distance moved by the weight d/mm | 278 |
| Length of pendulum λ/mm | 795 |
| Displacement Δ/kg | 51.787 |
| Draft T/mm | 160 |
| LCB(from amidships)/mm | 17.3 |
| LCF(from amidships)/mm | −25.6 |
| Sliding weight/kg | 3.026 |
| ρ/(kg·m−3) | 1.004 |
Several tests were carried out with different GM while keeping the displacement constant. This experiment was performed with a known sliding weight positioned at different heights as shown in Fig. 6.
4.2 Sensors in smartphonesThe 3-axis accelerometer and 3 axis gyroscopic sensor built nto the smartphone used in the experiment, is the MPU-6050 sensor, manufactured by InvenSense™(2013). The sensor contains a MEMS(micro-electro-mechanical systems)accelerometer and a MEMS gyro in a single chip. It is very accurate, as it contains a 16 bit analog to digital converter. For precision tracking of both fast and slow motions, it features user-programmable full-scale gyro and accelerometer ranges. Some interesting features, drawn from the manufacturer datasheet(MPU-6000/MPU-6050 Datasheet 2013), are shown in Table 3.
| Gyro full scale range/((°)·s−1) | Gyro Sensitivity/(LSB/((°)·s−1)) | Accel Full Scale Range/g | Accel Sensitivity/(LSB·g−1) |
| ±250 | 131 | ±2 | 16384 |
| ±500 | 65.5 | ±4 | 8192 |
| ±1000 | 32.8 | ±8 | 4096 |
| ±2000 | 16.4 | ±16 | 2048 |
The sampling rate can reach up to 100 Hz in the present test. The Shannon sampling theorem(Webster, 1999)states the conditions, “to be able to completely recover the continuous signal from sampled data, the signal may be sampled at least at the rate of 10 to 20 times the harmonic frequency of the sample”, is respected in present experiment. It is well known that for ship motion(Lewis, 1989), this frequency is a natural roll frequency which cannot exceed the limit of 1 Hz for a ship.
In order to obtain high sampling frequency, it is advised to turn off unnecessary applications, such as WIFI, GPS, Compass, and Bluetooth.
Another important parameter in DAQ is the amplitude resolution in bits. Despite the high resolution capability of current smartphone processor, 16 bits, the processor has to be adjusted in order to match the activated sensor resolution see MPU-6000/MPU-6050 Product Specification Datasheet(InvenSense™, 2013).
4.4 Smartphones application
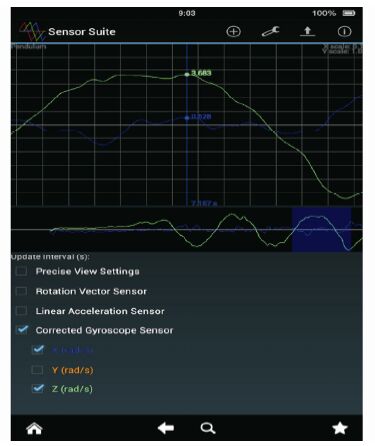
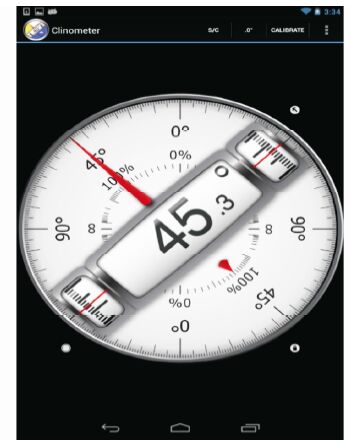
The graphical user-interface of the smartphone application visualizes and backs up the parameters of the ship motion as shown in Figs. 8 and 9. The measurements are directly given in international units. The application has a calibration feature which resets the readout to zero in order to match the upright position of the ship. In addition, the application includes a digital low pass filter in order to eliminate high frequency noise which may occur during the experiment. The application captures and plots accelerometer and gyroscope data on screen. Fig. 8 shows the captured data in a comma separated value(CSV)file for post-processing. Notice that the tilt angle i.e. static heel, list of the ship, can be determined with the measured linear accelerometer. According to the smartphone related coordinate z axis, the acceleration γz is proportional to the gravity g. When the smartphone tilts around its local x-axis, the tilt angle is determined in Ripka and Tipek(2007) and given by the formulas:
$\theta = {\rm{arctan}}\left( {{{{\gamma _y}} \over {{\gamma _z}}}} \right)$
(5)
$\theta = {\rm{arcos}}\left( {{{{\gamma _z}} \over g}} \right)$
(6)
|
| Fig. 8 Snapshot of the interface in the data logging apps of the smartphone’s 6 DOF |
|
| Fig. 9 Snapshot of the interface clinometer’s apps based on accelerometer sensor |
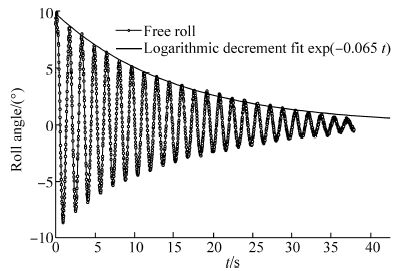
Fig. 10 illustrates an example using both methods. The data are recorded from an accelerometer sensor with a sampling rate of 20 Hz, over 40 s. The results are obtained by shifting weights causing the ship model to roll. Then this motion is damped over time to its desired equilibrium list angle.
|
| Fig. 10 Plot of the recorded CSV file of the free roll |
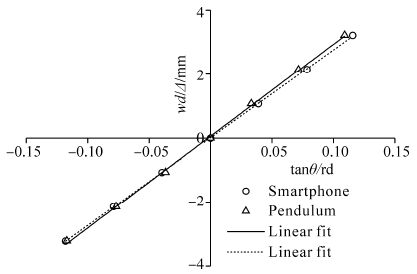
The experiments carried out in the model test are simultaneous smartphone and pendulum tests. The results are presented in Table 4 and plotted in Fig. 11. It has to be noted that when θ is in radians then the slope of the curve and the linear fitting is the magnitude of $\overline {GM} $ . The curves are linear as expected. For the starboard side a good agreement is found. However, a slight difference is observed for the port side.
| Test No. | Angle from pendulum tan θ=a/λ | Angle from smartphone apps |
| 0 | 0.00 | 0.00 |
| 1 | 2.23 | 1.90 |
| 2 | 4.49 | 4.10 |
| 3 | 6.63 | 6.25 |
| 4 | −6.77 | −6.70 |
| 5 | −4.52 | −4.40 |
| 6 | −2.27 | −2.10 |
| 7 | 0.00 | 0.00 |
|
| Fig. 11 wd/Δ vs. tan(θ)from the inclining test |
A linear regression analysis(least square method), represented in solid and dashed curves, is used to fit the measured points. Table 5 shows the comparison of the determined GM between the two methods. The st and ard deviation for smartphone measurement is 0.085 mm which is significantly lower than that obtained for the pendulum; 0.32 mm for a magnitude GM of 28.75 mm. Thus, the st and ard deviation deduced from the smartphone measurement seems to be more accurate. The relative error between the two values of GM is about 5%. As shown in Fig. 6, different GM values are obtained by adjusting the height of the sliding weight. As a result, different roll periods Tr are obtained from Fig. 12, which provides smartphone time history data. The signal is free of noise and thus no filter is required.
| Measurement | GM/mm | St and ard deviation/mm | Correlation factor |
| Pendulum | 28.75 | 0.328 61 | 0.999 61 |
| Smartphone apps | 27.46 | 0.085 35 | 0.999 97 |
| Error/% | 4.50 | - | - |

|
| Fig. 12 Time histories data acquisition of natural rolling test for different GM |
It is clear that it is easy to determine the period from the curves of Fig. 12 instead of the stopwatch. The data logging sampling rate reaches 10 Hz, during recorded roll motion, when the two sensors are activated simultaneously. The frequency rises to 20 Hz when only one of the sensors is activated. The Tr interval range of the test roll period varies from 1 s to 5 s, which corresponds from 0.2 Hz to 1 Hz.
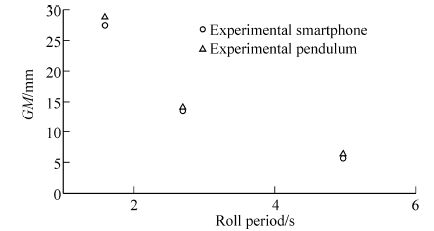
Furthermore, the decay constant of the roll period can also be determined from recorded time history. It is clear from the recorded data that the decay is noticeable. For example, in Fig. 12 this parameter is 0.065 s-1. Furthermore, in Fig. 13, where GM versus the natural roll period is plotted, shows a good agreement for both results.
|
| Fig. 13 Comparison of the experimental natural roll period |
A smartphone application visualizing the direct parameters of movement is presented, i.e. the angular inclinations and accelerations of a ship model in real-time. A classical inclining experiment with a smartphone as a heel angle instrument is investigated. In this st and alone study, a new idea is suggested for measuring the heel angle during an inclining test with a smartphone application as inclinometer. With the new generation of water proof smartphones, this method can be suitable for masters, yachtspeople, fisherpeople, etc. Some recommendations are required such as the location of the smartphone on board. Particularly for the rolling-period test, some skill and basic mathematical user knowledge are needed in order to draw the information from the recorded data. In addition, the time history record for a rolling test can be archived in order to compare with other measurements.
As seen in the results, the accuracy of the obtained measurements using this new method is similar to the classical method based on pendulum measurements and is even better regarding simplicity, bulk, accuracy, readout, and robustness. The st and ard deviation for this method is much lower than for the classical one. Moreover, measurement with a smartphone, in both the full-scale inclining experiment and the rolling-period test, is simpler than that performed on the model. Because the roll period of a full-scale ship is larger than that of the model.
The satisfactory results from the present work could make this method of measurements widely used. Moreover, it can be recommended by the IMO, the FAO, and other regulating authorities for the inclining experiment and rolling period test. There is no doubt that the use of this technical method may popularize experimental work and data collection using such affordable ways of data logging.
AcknowledgementThe authors would like to thank the staff of the Ship Stability Laboratory at the Maritime Departement, University of Sciences and Technology of Oran Mohamed Boudiaf, Algeria.
| Bennett SS, Brooks CJ, Winden B, Taunton DJ, Forrester AIJ, Turnock SR, Hudson DA (2014). Measurement of ship hydroelastic response using multiple wireless sensor nodes. Ocean Engineering, 79, 67-80. DOI: 10.1016/j.oceaneng.2013.12.011 |
| Biran A (2003). Ship hydrostatics and stability. Butterworth-Heinemann, Oxford, UK, 166-171. |
| Cota A (1985). GM-Meter automatic instrument for continues measurement of ships stability. ATMA, 97-113. (in French) |
| Daponte P, De Vito L, Picariello F, Riccio M (2013). State of the art and future developments of measurement applications on smartphones. Measurement, 46(9), 3291-3307. DOI: 10.1016/j.measurement.2013.05.006 |
| Griffin MJ, Lawther A, Lewis C (1985). Stability meter for floating objects. World Patent WO1987003855 A1. |
| Gudmundsson A (2009). Safety practices related to small fishing vessel stability. FAO Food and Agriculture Organisation, Rome, Italy, FAO Fisheries and Aquaculture Technical Paper No. 517. |
| IMO (2009). SOLAS, consolidated edition, 2009. 5th edition, International Maritime Organization, London, UK. |
| InvenSenseTM (2013). MPU-6000/MPU-6050 Product Specification Datasheet, PS-MPU-6000A-00, InvenSenseTM, Sunnyvale, USA. (2013). |
| Kuhn J, Vogt P (2013). Applications and examples of experiments with mobile phones and smartphones in physics lessons. Frontiers in Sensors (FS), 1(4), 67-73. |
| Lewis EV (1988). Principles of naval architecture, Volume I: Stability and strength. SNAME, New York, USA. |
| Lewis EV (1989). Principles of naval architecture, Volume III: Motion in waves and controllability. SNAME, New York, USA. |
| Pattulo RNM, Thomson GR (1965). The B.S.R.A. trawler series. Transactions of Royal Institution of Naval Architects, 107, 216-236. |
| Ripka P, Tipek A (2007). Modern sensors handbook. ISTE Ltd., London, UK, 200-242. DOI: 10.1002/9780470612231 |
| Webster JG (1999). Measurement, instrumentation, and sensors handbook. CRC Press LLC, New York, USA. |


