


 ,
,
1 Introduction
Welding induced residual stress is a serious challenge in joining of large structures like ships and steel bridges where fusion welding is the primary option of joining. The residual stress develops due to localized non-uniform heating and cooling during welding and after cooling these results in permanent deformation which is harmful for proper functioning and life of welded structures. It is significant to assess the magnitude and distribution of residual stress and to identify the methodology for the minimization of the same. The prediction of the residual stress by means of analytical methods is nearly impossible unless a simplified system is developed with a lot of assumptions.
Hence the numerical method like finite element (FE) based model is effective to deliver more realistic solution (Biswas et al., 2010; Mahapatra et al., 2006; Dean, 2009; Murugan et al., 2001). According to Withers and Bhadeshia (2001), residual stresses are more difficult to predict than the in-service stresses on which they superimpose. For this reason, it is important to have reliable methods for the measurement of these stresses and to underst and the level of information they can provide. Residual stresses are obvious during welding and their effects on welded structures cannot be ignored. The design and fabrication conditions, such as the thickness of structure, welding conditions and welding sequence must be altered in order to minimize the adverse effects of residual stresses to acceptable levels. Although many researchers have developed several techniques (Norton and Rosenthal, 1944; Hosseinzadeh and Bouchard, 2011; Cheng et al., 2012; Teng and Lin, 1998; Ueda et al., 1979; Ueda et al., 1986) to measure the residual stress experimentally, the experimental procedure is always not feasible, consumes a lot of time, full of uncertainties, huge cost of the set up and many more disadvantages. Therefore, it is worthwhile to use a well-tested mathematical model for the prediction of residual stress and to devise the methodology to minimize the same. Numerical simulation based on finite element method is proved to be an effective technique over the years for obtaining residual stresses in the welded structures (Biswas et al., 2010; Mahapatra et al., 2006; Dean, 2009; Murugan et al., 2001; Teng et al., 2001; Friedman, 1975, Ma et al., 1995).
Ueda and Yamakawa (1971) were the first among those who proposed a thermal elasto-plastic finite element model to analyze the transient thermal stresses induced in a butt joint configuration with material deposition from a moving electrode. Following this pioneering work, many researchers have successfully developed various numerical models (Ueda et al., 1986; Ueda and Yamakawa, 1971; Hibbitt and Marcal, 1973; Rybicki et al., 1978; Radaj, 1992; Luo, 1997; Hong et al., 1998; Dong, 2001; Lindgren, 2006) based on finite element method to predict temperature distribution, analyze the welding residual stress and distortion both in 2D and 3D problems. Hibbitt and Marcal (1973) developed a numerical model for the welding of a large structure by subsequent loading to the structure for high strength steels. Ueda and Yuan (1993), Yuan and Ueda (1996) studied the characteristic distributions of inherent strains in butt, T and I joints, and successfully employed them to predict welding residual stress. Teng et al. (2001) had investigated the residual stresses and distortion of T joint fillet welds using two dimensional finite element analysis. Among the recent researchers Biswas et al. (2010; 2011a; 2011b), Biswas and Mandal (2010), Kiran et al. (2011; 2012) did some prominent work in the field of thermo-mechanical analysis of SAW. Average plastic strain method was used to predict the angular deformation of large stiffened panels and the effect of welding sequence on residual stress and angular deformation was studied (Biswas et al., 2011a). Kiran et al. (2012) studied the influence of process variables on weld bead quality on two-wire submerged arc welding. A three-dimensional heat transfer analysis was performed (Kiran et al., 2011) based on finite element method using two independent volumetric h eat sources to account for heat input from two welding arcs. The effect of welding parameters on weld bead geometry has been studied. Mahiskar et al. (2014), Nart and Celik (2013) developed 3-D finite element models to perform coupled thermo-mechanical analysis and successfully predicted the weld bead geometry. Cho et al. (2013; 2014) studied the molten pool behavior in the t and em submerged arc welding process using computational fluid dynamics. To minimize the resultant variations in currents and resultant welds, Lu et al. (2014a; 2014b) modeled the double electrode submerged arc welding process and a multivariable predictive control algorithm was developed to control the process variables at desired levels. The effect of external load on angular distortion in submerged arc welded fillet joints were studied by Park et al. (2012). Luo et al. (2014) and Lan et al. (2012) investigated the effect of post weld heat treatment on microstructure and microstructural variation in high strength low carbon bainitic steel weldment respectively.
It is thus obvious from the literatures that residual stress is very much detrimental for large welded structure which is sensitive to mechanical constraints. A number of tacking is practically used in a large structure during the welding process. Hence the positioning of tacking as mechanical boundary constraints may influence the residual stress level and distortion for the whole structure. Moreover, literature does no not reveals any information on the effect of tacking sequence of submerged arc welded fillet joint which motivates to develop a 3D transient thermo-mechanical model assuming elasto-plastic material behavior and temperature dependent material properties. The analysis is carried out to predict the residual stress and distortion of single pass, single sided fillet joints with four different tacking sequences. The numerical model is then validated successfully by predicting both the residual stress and angular distortion.
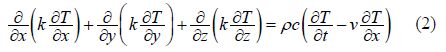
2 Numerical modelsA three dimensional finite element thermo-mechanical model has been developed to analyse the residual stresses distribution pattern in single sided fillet welding. For finding out the residual stresses distribution pattern over the entire welded plate, first of all transient thermal analysis is carried out to find out the nodal transient temperatures. Sequentially, the nonlinear elasto-plastic analysis is performed using transient temperature field with consideration of the temperature dependent material properties. The developed model takes into account the moving heat source along with material deposition by element birth and death techniques. Eight nodded brick elements are used both for thermal analysis and structural analysis. The solution was obtained using the ANSYS finite element analysis package.
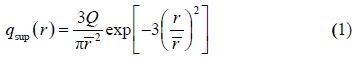
2.1 Thermal modelThe heat source model in welding has an important effect on the heat distribution pattern in the vicinity of the various weld zones i.e. fusion zone and heat affected zone. For the process of arc welding, the heat source is characterized by distributed heat flux on the weldment surface. In this study, the moving heat source from the welding arc is applied at any given instant of time as a Gaussian distributed heat flux which is expressed as


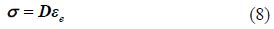
The stress strain relationship can be represented as:
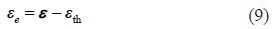
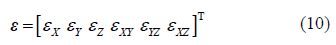
The elastic strain is given as:
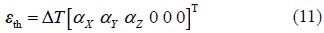
The structural analysis involved large displacements (strain) and rate independent thermo-elasto-plastic material model along with temperature dependent material properties. Kinematic work hardening was assumed in the analysis. This is a common material model used in the welding analysis together with von-Misses yield criterion and associated flow rules (Biswas and Mandal, 2010; Wang et al., 2011; Lindgren, 2001; Fanous et al., 2003).
2.3 Welding parameters and material propertiesThe welding parameters considered for this study are current, voltage and welding speed which were taken as 430 A, 22 V and 5.0 mm/s respectively. Length of stick out has been kept to 2.5 mm. In the present analysis a single sided fillet welding is considered. The plate used in this study is a 6 mm thick 200 mmx200 mm mild steel plate with a stiffener with a web height of 50 mm and thickness 6 mm. A schematic view of the single sided fillet weld joint along with coordinate system and tack positions have been depicted in Fig. 1. Fig. 2 represents the geometric meshing used in present analysis. The non-uniform meshing has been applied to save the computation time where the mesh size gradually increases from the center of the weld line to the boundary. For carrying out thermal and structural analysis 8-noded brick elements i.e. SOLID-70 and SOLID-45 (i.e. this element is compatible with SOLID-70) were used respectively. The total number of elements and nodes are 10900 and 15150, respectively. To prevent the rigid body motion, the rigid body boundary condition has been incorporated in the FE model and also constraints have applied in weld tack positions.

|
| Fig. 1 Coordinate system and tack positions for single sided fillet welding |

|
| Fig. 2 FE model geometry, meshing and boundary condition |
Here an attempt has been made to underst and the effect of tacking sequences on residual stress and deformation. At this present study with the existence of six number of tack positions the work piece can be tack welded at least in 57 ways if we select at least two tacking positions.
Therefore four different tacking sequences have been r and omly selected from the population of 57 such that there are certain variations in the number of tack positions. Welding is done according to different tacking sequences as described in Table 1. Tack position 1, 3 and 5 are opposite to welding side and tack positions 2, 4 and 6 are in the welding side of the single sided fillet joint.
| Tacking sequences | Nomenclatures |
| Tack positions 2 & 6 | TS-I |
| Tack positions 1, 3 & 5 | TS-II |
| Tack positions 1, 2, 5 & 6 | TS-III |
| Tack positions 1, 2, 3, 4, 5 & 6 | TS-IV |
In present study, mild steel is used as the base material of the fillet joint. The temperature dependent material properties of mild steel (Adak and Mandal, 2003; Ma et al., 1995) are used in this study both for heat transfer and elasto-plastic analysis. With varying temperatures the corresponding thermal conductivity, specific heat, thermal expansion co-efficient, Young’s modulus, Poisson’s ratio, yield stress, convection co-efficient and enthalpy are show in Tables 2-5. The thermal conductivity, yield stress and Young’s modulus decreases with temperature but after 800 °C the thermal conductivity follows an increasing trend. Thermal expansion coefficient, Poisson’s ratio, convection coefficient and enthalpy all increases gradually with temperature. But the specific heat values of mild steel follows a very irregular trend with increase in temperature, up to 720 °C it increases and the n decreases till 1 510 °C but again increases from 1580 °C. It is obvious that there are huge variations of material properties with temperature and it challenges to develop a well efficient model. A commercial grade mild steel was procured with the composition of the parent metal as shown in Table 6 which remains same throughout the experimental and simulation process.
| Temperature/K | Convection coefficient / (W· (m2·K)−2) |
| 56 | 1.815 |
| 278 | 9.079 |
| 556 | 18.15 |
| 2 778 | 52.66 |
| 3 778 | 1 089 |
| Temperature /°C | Thermal conductivity / (W· (m·K)−1) | Specific heat / (J· (kg·K)−1) | Thermal expansion coefficient / (10−6/°C) | Young modulus /GPa | Poisson’s ratio |
| 0 | 51.9 | 450 | 10 | 200 | 0.278 6 |
| 100 | 51.1 | 499.2 | 11 | 200 | 0.309 5 |
| 300 | 46.1 | 565.5 | 12 | 200 | 0.331 |
| 450 | 41.05 | 630.5 | 13 | 150 | 0.338 |
| 550 | 37.5 | 705.5 | 14 | 110 | 0.357 5 |
| 600 | 35.6 | 773.3 | 14 | 88 | 0.373 8 |
| 720 | 30.64 | 1 080.4 | 14 | 20 | 0.373 8 |
| 800 | 26 | 931 | 14 | 20 | 0.423 8 |
| 1 450 | 29.45 | 437.93 | 15 | 2 | 0.473 8 |
| 1 510 | 29.7 | 400 | 15 | 0.2 | 0.499 |
| 1 580 | 29.7 | 735.25 | 15 | 0.000 02 | 0.499 |
| 5 000 | 42.2 | 400 | 15.5 | 0.000 02 | 0.499 |
| Temperature /°C | Enthalpy / (MJ·m−3) | Temperature /°C | Enthalpy / (MJ·m−3) |
| 0 | 0 | 600 | 2 500 |
| 100 | 360 | 700 | 3 000 |
| 200 | 720 | 800 | 3 700 |
| 300 | 1 100 | 900 | 4 500 |
| 400 | 1 500 | 1 000 | 5 000 |
| 500 | 1 980 | >2 500 | 9 000 |
| Temperature/K | Yield stress (σy)/MPa | Temperature/K | Yield stress (σy)/MPa |
| 293 | 398 | 1 073 | 36 |
| 373 | 379 | 1 273 | 28 |
| 573 | 305 | 1 473 | 20 |
| 773 | 192 | 1 673 | 12 |
| 973 | 41 |
| Material | Wt. % | Material | Wt. % |
| C | 0.19 | Cr | 0.06 |
| Si | 0.37 | Ni | 0.03 |
| Mn | 1.57 | Mo | 0.01 |
| P | 0.023 | Cu | 0.04 |
| S | 0.027 | Al | 0.046 |
In the present investigation a constant current SAW set up, copper coated mild steel electrode of 3.1 mm diameter and granular flux have used for carrying out the experiments. The experiments conducted to study the effect of weld tack sequences on the angular distortion of single pass single sides fillet welded samples. Four different tack sequences have studied. The tack welded samples and welded samples are shown in Figs. 3 and 4, respectively. Before welding the tack welded samples were marked to measure the co-ordinates before and after the welding to estimate magnitude of angular distortions. The angular distortions are estimated by subtracting the initial reference of welding surface height from final welding surface height. The entire coordinate measurements are carried out by using a dial gauge having the measuring range of 0-10 mm.

|
| Fig. 3 The tack welded samples before welding by SAW |

|
| Fig. 4 Welded samples using SAW |
The developed numerical model is used to simulate the residual stress and distortions corresponding to welding conditions depicted in section 4. This section provides the detail analysis of obtained results and possible conclusion on the effect of tacking sequences. However, the results are presented into two sub-sections i.e. distortions and residual stresses.
4.1 DistortionsFig. 5 illustrates the distortions of the fillet welded plate due to the different tacking sequences i.e. TS-I to TS-IV. The distortions shown in Fig. 5 are taken perpendicular to the weld line from center of weld to both side of the weld at the middle length of the weld line. It is clear from the Fig. 5 that the angular distortion in the fillet side is more and in the opposite side it is less in all four cases, which means the angular deformation is completely unsymmetrical in nature. The maximum angular deformation in the fillet side can be observed in TS-II (i.e. tack position in 1, 3 and 5) and minimum in TS-IV (i.e. tack position in 1, 2, 3, 4, 5 and 6). Therefore the obtained simulation results clearly indicate the influence of tacking sequences in the present study.

|
| Fig. 5 Maximum angular distortions perpendicular to the weld line |
A comparison of the predicted angular distortion from the finite element analysis with the angular distortion from the experimental analysis is shown in the Table 7. The maximum magnitudes of angular deformation are considered both for fillet side and opposite side. For all the tacking sequences the percentage of deviation of the predicted results from the experimental results lays in between 4.55% to 13.55% which is sound enough thus shows the accuracy of the developed finite element model.
| Tacking sequences | FE maximum distortion | Experimental maximum distortion | Percentage of error of distortion/% | |||||||
| Fillet side | Opposite side | Fillet side | Opposite side | Fillet side | Opposite side | |||||
| /mm | / (°) | /mm | / (°) | /mm | / (°) | /mm | / (°) | |||
| TS-I | 2.22 | 1.272 | 0.694 | 0.397 | 2.32 | 1.32 | 0.61 | 0.345 | 4.50 | 12.10 |
| TS-II | 3.72 | 2.13 | 1.3 | 0.744 | 3.17 | 1.82 | 1.14 | 0.653 | 14.78 | 12.30 |
| TS-III | 2.00 | 1.146 | 0.671 | 0.384 | 1.73 | 0.99 | 0.58 | 0.332 | 13.5 | 13.56 |
| TS-IV | 1.78 | 1.02 | 0.592 | 0.339 | 1.58 | 0.905 | 0.51 | 0.292 | 11.23 | 13.55 |
The contour of angular deformations of four different cases is shown in Fig. 6. As in case of TS-II the restrains are in opposite side of the weld that’s why the angular deformation developed enhanced angular deformation in weld side due to the weld shrinkage force. Similarly in all other cases as the restrains are in both side of the stiffener (i.e. in weld side and opposite to the weld side) reduces the angular distortion of the welded structure. This happens because the weld shrinkage force developed in the welded structure is restrained by the weld tacks in both sides.

|
| Fig. 6 Distortions for four different tacking sequences |
First of all the residual stresses distribution pattern for fillet welding have validated with st and ard published literature (Ma et al., 1995) as shown in Figs. 7 and 8, respectively. Then the same methodology have been applied to study the welding residual stresses distribution in single sided fillet welding with varying weld tack sequences.

|
| Fig. 7 Comparison of longitudinal residual stress with Ma et al. (1995) |

|
| Fig. 8 Comparison of transverse residual stress with Ma et al. (1995) |
It has observed that within and closer to the welding region the residual stress is tensile in nature and away from the weld line it is compressive in nature. Figs. 9 to 15 describe the simulated longitudinal, transverse and von Misses residual stress distribution along weld line and perpendicular to the weld line for four cases of tacking sequence.

|
| Fig. 9 Von-Misses residual stress distribution of the fillet welded plate |

|
| Fig. 10 Von-Misses residual stress distribution along weld line |

|
| Fig. 11 Von-Misses residual stress distribution perpendicular to weld line |

|
| Fig. 12 Longitudinal residual stress distribution along weld line |

|
| Fig. 13 Longitudinal residual stress distribution perpendicular to weld line |
|
|
| Fig. 1 Transverse residual stress distribution along weld line |
|
|
| Fig. 1 Transverse residual stress distribution perpendicular to weld line |
Fig. 9 represents the von-Misses residual stress distribution pattern for the four different tacking sequences. From Fig. 9, it can be observed that the von-Misses residual stress distribution pattern and magnitude did not affected by tacking sequence, whereas in case of longitudinal and transverse residual stress the magnitude and distribution pattern is affected by the weld tacks. Fig. 10 represents von-Misses residual stress distribution along the weld line. In both cases the von-misses residual stress distribution can be found uniform throughout the weld line except the tack positions where some non-uniformity can be observed.
Fig. 11 shows the von-Misses residual stress distributions perpendicular to weld line. For TS-II & IV the variation of residual stresses observed at the middle length of welding where tack weld was done. It was observed that the residual stresses increased due to the tack positioned in weld side where as the residual stresses lowered due to the tack positioned in opposite side of welding.
Fig. 12 represents the longitudinal residual stress distribution along the center line of fillet weld line. From Fig. 12 it has been observed that the stress magnitude and distribution patterns are dependent on weld tack sequence. It was observed that except the tack positions the transverse residual stress is uniform through the length and the magnitude of residual stress in tack positions is around twice of that of without tack positions. Fig. 13 represents the longitudinal residual stress distribution perpendicular to the fillet weld line. From which it has observed that along the weld line it is tensile and away from the weld line it is compressive in nature.
It was observed that though the residual stress distributions near the middle length tack positions (i.e. tack positions 3 & 4) were uneven in nature but the magnitude of residual stresses decreased for the weld tack positioned opposite to the weld line i.e. for TS-II.
Fig. 14 represents the transverse residual stress distribution along the center line of fillet weld. It can be observed that the residual stress at tack positionsare non-uniform but the the maximum magnitude of the transverse residual stress is very less than the longitudinal residual stress. The maximum magnitude of transverse residual stresses along weld line reaches around 300 MPa only.
The Fig. 15 represents the transverse residual stress perpendicular to the weld line. It was observed that though the residual stress distributions near the middle length tack positions (i.e. tack positions 3 & 4) were uneven in nature but the magnitude of residual stresses decreased for the weld tack positioned opposite to the weld line i.e. for TS-II.
5 ConclusionsA three dimensional finite element based thermo- mechanical analysis has been performed to study the effect of tacking sequences on residual stress and angular distortion of single sided fillet weld. The results reveal that the weld tacking sequences have significant effects on the distribution of residual stress and angular distortion. The following conclusion can be made from the present study.
1) The tacking sequences TS-II and TS-IV have shown minimum and maximum magnitude of residual stresses, respectively. However, the angular distortion follows opposite trend of residual stress. The minimum value of angular distortion is observed in case of the tacking sequence TS-IV and the maximum for tacking sequence TS-II. It is thus obvious that where the value of residual stress increases there the angular deformation decreases.
2) The tacking positions also have a significant effect in residual stress and angular distortion distribution. It is observed that the tacking positions opposite to fillet weld side have almost no effect on residual stress distribution whereas the tacking positions in fillet weld side have significant effect on uneven distribution and increment of residual stresses. It can be concluded from this study that the tack weld position should place opposite to the fillet weld side.
AcknowledgementAuthors would like to acknowledge the support of the technical staff at Central instrument facility IITG, Central mechanical engineering workshop, Department of Mechanical Engineering, IITG, Guwahati, Assam, India, Pin.: 781039.
| Adak M, Mandal NR (2003). Thermo-mechanical analysis through a pseudolinear equivalent constant stiffness system. Proceedings of the Institution of Mechanical Engineers, Part M: Journal of Engineering for the Maritime Environment, 217(1), 1-9. |
| Biswas P, Deepati AK, Mandal NR, Mahapatra MM (2011a). A study on the effect of welding sequence in fabrication of large stiffened plate panels. Journal of Marine Science and Application, 10(4), 429-436. DOI: 10.1007/s11804-011-1088-8 |
| Biswas P, Mahapatra MM, Mandal NR (2010). Numerical and experimental study on prediction of thermal history and residual deformation of double-sided fillet welding. Proceedings of the Institution of Mechanical Engineers, Part B: Journal of Engineering Manufacture, 224, 125-134. DOI: 10.1243/09544054JEM1666 |
| Biswas P, Mandal NR (2010). Thermo-mechanical finite element analysis and experimental investigation of single-pass single-sided submerged arc welding of C-Mn steel plates. Proceedings of the Institution of Mechanical Engineers, Part B: Journal Engineering Manufacture, 224(4), 627-639. |
| Biswas P, Mandal NR, Das S (2011b). Prediction of welding deformations of large stiffened panels using average plastic strain method. Science and Technology of Welding and Joining, 16(3), 227-231. |
| Cheng X, Henry JP, Thomas GH, Vladimir L, John WF (2012). Neutron diffraction measurements for residual stresses in AL-6XN stainless steel welded beams. InTech Open Access Publisher, Rijeka, Croatia, 25-48. DOI: 10.5772/37537 |
| Cho DW, Kiran DV, Song WH, Na SJ (2014). Molten pool behavior in the tandem submerged arc welding process. Journal of Materials Processing Technology, 214(11), 2233-2247. DOI: 10.1016/j.jmatprotec.2014.04.032 |
| Cho DW, Song WH, Cho MH, Na SJ (2013). Analysis of submerged arc welding process by three-dimensional computational fluid dynamics simulations. Journal of Materials Processing Technology, 213(12), 2278-2291. DOI: 10.1016/j.jmatprotec.2013.06.017 |
| Dean D (2009). FEM prediction of welding residual stress and distortion in carbon steel considering phase transformation effects. Materials and Design, 30(2), 359-366. DOI: 10.1016/j.matdes.2008.04.052 |
| Dong P (2001). Residual stress analyses of a multi-pass girth weld: 3-D special shell versus axisymmetric models. Journal of Pressure Vessels Technology, 123(2), 207-213. DOI: 10.1115/1.1359527 |
| Fanous FZI, Maher YA, Wifi SA (2003). 3-D finite element modeling of the welding process using element birth and element movement techniques. Journal of Pressure Vessel Technology, 125(2), 144-150. DOI: 10.1115/1.1564070 |
| Friedman E (1975). Thermomechanical analysis of the welding process using the finite element method. Journal of Pressure Vessel Technology, 97(3), 206-213. DOI: 10.1115/1.3454296 |
| Hibbitt HD, Marcal PV (1973). Numerical thermo-mechanical model for the welding and subsequent loading of a fabricated structure. Computers and Structures, 3(5), 1145-1174. DOI: 10.1016/0045-7949(73)90043-6 |
| Hong JK, Tsai CL, Dong P (1998). Assessment of numerical procedures for residual stress analysis of multipass weld. Welding Journal, 77(9), 372s-382s. |
| Hosseinzadeh F, Bouchard P (2011). Application of the contour method to validate residual stress predictions. Second International Conference on Advances in Nuclear Materials (ANM-2011), Mumbai, India, 9-11. |
| Kiran DV, Basu B, De A (2012). Influence of process variables on weld bead quality in two wire tandem submerged arc welding of HSLA steel. Journal of Materials Processing Technology, 212(10), 2041-2050. DOI: 10.1016/j.jmatprotec.2012.05.008 |
| Kiran DV, Basu B, Shah AK, Mishra S, De A (2011). Three-dimensional heat transfer analysis of two wire tandem submerged arc welding. The Iron and Steel Institute of Japan International, 51(5), 793-798. |
| Lan L, Qiu C, Zhao D, Gao X, Du L (2012). Analysis of microstructural variation and mechanical behaviors in submerged arc welded joint of high strength low carbon bainitic steel. Materials Science & Engineering: A, 558, 592-601. DOI: 10.1016/j.msea.2012.08.057 |
| Lindgren LE (2001). Finite element modeling and simulation of welding. Part 2: improved material modeling. Journal of Thermal Stresses, 24(3), 195-231. DOI: 10.1080/014957301300006380 |
| Lindgren LE (2006). Numerical modeling of welding. Computer Methods in Applied Mechanical and Engineering, 195, 6710-6736. |
| Lu Y, Chen SJ, Shi Y, Li X, Chen J, Kvidahl L, Zhang YM (2014a). Double-electrode arc welding process: principle, variants, control and developments. Journal of Manufacturing Processes, 16(1), 93-108. DOI: 10.1016/j.jmapro.2013.08.003 |
| Lu Y, Chen JS, Zhang YM, Kvidahl L (2014b). Predictive control based double-electrode submerged arc welding for filet joints. Journal of Manufacturing Processes, 6(4), 415-426. DOI: 10.1016/j.jmapro.2014.05.001 |
| Luo Y (1997). Description of inherent strain and its application to prediction of welding deformation and residual stress under multi-pass welding. PhD thesis, Osaka University, Osaka, Japan. |
| Luo J, Dong Y, Li L, Wang X (2014). Microstructure of 2205 duplex stainless steel joint in submerged arc welding by post weld heat treatment. Journal of Manufacturing Processes, 16(1), 144-148. DOI: 10.1016/j.jmapro.2013.06.013 |
| Ma NX, Ueda Y, Murakawa H (1995). FEM Analysis of 3D welding residual stresses and angular distortion in T-type fillet welds. Transaction of Joining and Welding Research Institute, 24(2), 115-122. |
| Mahapatra MM, Datta GL, Pradhan B, Mandal NR (2006). Three-dimensional finite element analysis to predict the effects of SAW process parameters on temperature distribution and angular distortions in single-pass butt joints with top and bottom reinforcements. International Journal of Pressure Vessels and Piping, 83(10), 721-729. DOI: 10.1016/j.ijpvp.2006.07.011 |
| Mahiskar GI, Chadge RB, Ambade SP, Patil AP (2014). Thermo-mechanical analysis of multi-pass bead-on-plate welding. Procedia Materials Science, 5, 2522-2531. DOI: 10.1016/j.mspro.2014.07.504 |
| Murugan S, Rai SK, Kumar PV, Jayakumar T, Raja B, Bose MSC (2001). Temperature distribution and residual stresses due to multipass welding in type 304 stainless steel and low carbon steel weld pads. International Journal of Pressure Vessels and Piping, 78(4), 307-317. DOI: 10.1016/S0308-0161(01)00047-3 |
| Nart E, Celik Y (2013). A practical approach for simulating submerged arc welding process using FE method. Journal of Constructional Steel Research, 84, 62-71. DOI: 10.1016/j.jcsr.2013.02.005 |
| Norton JH, Rosenthal D (1944). Stress measurement by X-ray diffraction. Proceedings of the Society for Experimental Stress Analysis, 1(2), 73-76. |
| Park JU, An G, Lee HW (2012). Effect of external load on angular distortion in fillet welding. Materials and Design, 42, 403-410. DOI: 10.1016/j.matdes.2012.06.006 |
| Radaj D (1992). Heat effects of welding: Temperature field residual stress distortion. Springer-Verlag, New York. |
| Rybicki EF, Schmueser DW, Stonesifer RW, Groom JJ, Mishler HW (1978). A finite-element model for residual stresses and deflections in girth-butt welded pipes. Journal of Pressure Vessel Technology, 100(3), 256-262. DOI: 10.1115/1.3454464 |
| Teng TL, Fung CP, Chang PH, Yang WC (2001). Analysis of residual stresses and distortions in T-joint fillet welds. International Journal of Pressure Vessels and Piping, 78(8), 523-538. DOI: 10.1016/S0308-0161(01)00074-6 |
| Teng TL, Lin CC (1998). Effect of welding conditions on residual stresses due to butt welds. International Journal of Pressure Vessels and Piping, 75(12), 857-864. DOI: 10.1016/S0308-0161(98)00084-2 |
| Ueda Y, Fukuda K, Kim YC (1986). New measuring method of axisymmetric three dimensional residual stresses using inherent strains as parameters. ASME Journal of Engineering Material and Technology, 108(4), 328-334. DOI: 10.1115/1.3225890 |
| Ueda Y, Fukuda K, Tanigawa M (1979). New measuring method of three dimensional residual stresses based on theory of inherent strain. Transactions of Joining and Welding Research Institute Osaka University, 8(2), 89-96. |
| Ueda Y, Yamakawa T (1971). Analysis of thermal elastic-plastic stress and strain during welding by finite element method. Transactions of the Japan Welding Society, 2(2), 90-100. |
| Ueda Y, Yuan MG (1993). Prediction of residual stresses in butt welded plates using inherent strains. Journal of Engineering Materials and Technology, 115(4), 417-423. DOI: 10.1115/1.2904240 |
| Wang J, Ma N, Murakawa H, Teng B, Yuan S (2011). Prediction and measurement of welding distortion of a spherical structure assembled from multi thin plates. Materials and Design, 32(10), 4728-4737. DOI: 10.1016/j.matdes.2011.06.047 |
| Withers PJ, Bhadeshia HKDH (2001). Overview-Residual stress. Part 1–Measurement techniques. Materials Science and Technology, 17(4), 355-365. |
| Yuan MG, Ueda Y (1996). Prediction of residual stresses in welded T-and I-Joints using inherent strains. Journal of Engineering Materials and Technology, 118(2), 229-34. DOI: 10.1115/1.2804892 |