 2016, Vol. 36


随着我国经济快速发展,大气污染形势日益严峻.相关监测数据表明,我国目前已成为世界PM2.5污染最严重的地区.2013年初,雾霾天气侵袭大半个中国,最严重时大气污染物覆盖面积达130多万平方公里,多个城市出现持续性重度污染.《中国环境状况公报》显示,2014年长三角区域25个地级及以上城市PM2.5年均浓度为60 μg·m-3,仅舟山市达标,其他24个城市均超标;细颗粒物PM2.5能够较长时间悬浮于空气中,并导致心血管和肺部疾病(Du et al.,2010).2010年上海市因PM2.5造成的循环系统疾病和心血管疾病总死亡人数高达2980人(藩小川等,2012).在欧盟国家中PM2.5导致人们的平均寿命减少8.6个月(Prendes et al.,1999).因此,定量评估PM2.5空间分布对人体健康研究很有必要.
土地利用回归模型(LUR)已经成为预测长时段污染物浓度空间分布的重要方法,被广泛应用于城市空气污染物的预测(Lee et al.,2015; Aguilera et al.,2008; Dons et al.,2013).目前,这一模型已经成功地应用于欧洲和北美一些城市NO2、NOx、PM2.5年平均浓度的估算,以及不同环境下PM2.5和VOCs等背景值的估算(Arain et al.,2007; Su et al.,2008; Henderson et al.,2007).欧洲空气污染影响研究项目(ESCAPE)基于LUR模型模拟了20个研究区域的颗粒物浓度,结果表明死亡率与年均颗粒物浓度值有一定相关性(Briggs et al.,1997).国内关于LUR的应用研究较少,陈莉等利用LUR模型模拟了天津市和济南市(Chen et al.,2010; Chen et al.,2012; Li et al.,2010)的PM10、NO2等大气污染物的浓度空间分布.焦利民等基于LUR模型模拟了武汉市PM2.5浓度空间分布(焦利民等,2015).基于LUR模型模拟污染物浓度空间分布时,预测因子的提取至关重要(Amini et al.,2013).早期的研究模型能够解释61%到72%的空气污染物的变异(Eeftens et al.,2012).近几年更多的基于GIS平台的预测因子被纳入到模型(Fotheringham et al.,1996),使得模型有更高的预测能力与变异解释能力.其中,地理加权回归(GWR)算法由于其可以解释地理预测因子的空间变异性和非平稳性(Rob et al.,2013),也逐渐被应用于污染物浓度空间分布预测研究中,并取得了较好的效果.
杭州地处长江三角洲南翼.近年来,工业发展迅速的同时伴有污染物大量排放,加之杭州特有的环境气象条件,使得杭州地区细颗粒物污染日益加重(齐冰等,2015),有限的地基监测站点无法涵盖这个城市地区,无法准确解释细颗粒物污染的空间分布特征.因此,建立土地利用回归模型模拟杭州地区PM2.5浓度空间分布意义重大.
本研究选用LUR模型基于GIS平台提取气象、地形、土地利用、交通等影响PM2.5浓度的相关因子,并结合杭州地区PM2.5浓度地面监测数据对杭州地区近地表PM2.5浓度空间分布进行预测分析,探讨影响预测精度的原因,以期为研究城市空气质量及其对人体健康的影响提供数据基础.
2 数据源及研究区域(Data source and study area) 2.1 研究区域研究区域为整个杭州市,如图 1所示.
 |
| 图 1 PM2.5监测站点布控 Fig. 1 Spatial distribution of PM2.5 monitoring sites |
采集2014年3月—2015年2月分布在杭州地区的10个PM2.5地基监测站点的质量浓度日均监测数据(数据源来源于浙江省环保厅网站,http://www.zjepb.gov.cn/hbtmhwz/index.htm).求算每个监测站点PM2.5质量浓度月均值,每个季度模型随机抽取22个监测样本点建模,剩余8个监测样本点用于模型预测精度检验.
2.3 缓冲半径和预测变量以监测点位为中心,选取1、2、3 km为半径(Hoogh et al.,2013),提取缓冲区内的预测变量.综合考虑影响PM2.5的各类影响因素,最终选取气象因子、土地利用因子、污染点源因子及交通人口因子(Colleen et al.,2015)等5大类预测因子,如表 1所示.
| 表 1 预测因子 Table 1 List of the predictive factors |
气象因子:根据中国气象科学数据共享服务网(http://cdc.nmic.cn/home.do)实时发布的浙江省气象站点观测数据,对整个浙江省范围进行插值,并提取杭州地区的气象数据.本研究选取的气象因子有平均气压、平均气温、平均相对湿度、平均降水量和平均风速.
土地利用因子:部分土地利用类型可能代表不同的污染源;而另外一些土地利用类型如林绿地的分布可以降低一些大气污染物的浓度(陈莉等,2009).利用遥感数据解译得到各站点周围的土地覆被数据,以各监测点为中心分别做半径为1~3 km的缓冲区,计算各缓冲区内不同土地利用类型总面积,得到代表土地利用类型的自变量.
污染点源因子:选取监测站点周边NOx和硫化物浓度作为污染物排放因子.数据源来自浙江省环保厅网站(http://www.zjepb.gov.cn/hbtmhwz/index.htm).
交通、人口因子:交通、人口导致的人为源本身就会对大气污染物浓度产生影响.建立1~3 km的缓冲区,提取交通因子.路网密度是由缓冲区范围内道路总长度除以缓冲区总面积,包括高速公路密度、市区道路密度和省县道路密度.人口密度因子是缓冲区范围内住宅地段的密度.其他交通因子有汽车站数量、公交车站数量、停车场数量.获取方式都是求算相应缓冲区内的点源分布数量.
3 模型方法与模型评价(Model and evaluation) 3.1 部分建模数据统计特征描述气象要素的变化对污染物的扩散、转化、沉降都有着巨大的影响(翟广宇等,2015).在建模前,对PM2.5浓度值和气象因子进行了简要的描述和分析.图 2是建模中各参数的频率分布直方图.PM2.5的最小值是34.64 μg·m-3,最大值是93.4 μg·m-3均值是 60.63 μgg·m-3,高值出现在春冬季节的概率很大.平均相对湿度最小值是53.42%,最大值86.99%,均值是74%.平均降水量均值是2489 mm,最大值是5824.05 mm,最小值是224.3 mm,这表明杭州地区为湿润的气候特征.
 |
| 图 2 建模数据中部分参数的频率分布 Fig. 2 Frequency distribution of some parameters in the modeling data |
以杭州地区10个监测点PM2.5月均值为因变量,同时提取相应的预测因子作为自变量,建立模型.各预测因子具有较强的空间变异性和非平稳性.一般的线性回归算法不考虑地理空间异质性(Mishra et al.,2015),其效果并不理想;地理加权回归算法通过在线性回归中假定回归系数是观测点地理位置的位置函数,将数据的空间特性纳入模型中(瞿明凯等,2014),在处理具有空间异质性的数据时有一定的优势.因此,本研究选取地理加权回归算法,建立基于土地利用回归模型的杭州地区细颗粒浓度空间分布预测模型.
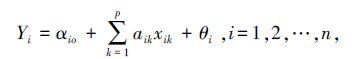
GWR模型(王景雷等,2013)基本形式如下:
|
(1) |
式中,αio为在回归点i的截距,αik为在回归点i的第k个参数,θi为随机误差,Yi为因变量.
4 模型结果与讨论(Results and discussion) 4.1 模型结果与评价利用杭州地区10个监测点2014年春季到冬季的数据分别建立LUR预测模型(表 2).
| 表 2 地理加权回归模型结果与评价 Table 2 Description of the results and evaluation for the GWR model |
从表 2看出,4个季度的训练模型R2值都达到0.82以上,均值为0.86,调整后R2都在0.73以上.4个季度的拟和差异较小,表明基于GWR算法的拟合模型能够解释73%以上的PM2.5浓度变化.检验模型的R2均值为0.74,调整R2在0.62到0.72之间变化,均值达到0.69.同时,RMSE值在2.10到3.22之间波动,表明真实值与拟合值间差异不大,模型结果可靠.空间残差自相关Moran′s I 系数在-0.25到0.17之间变化,残差M′I值较小且不显著,表明残差没有明显的空间自相关,表中sigma(正规化剩余平方和的平方根)均值为4.55,它是残差的估计标准差,此统计值越小越好.综上所述,本研究基于GWR模型的拟合是有效的.但是,城市空气污染区域复杂多变,本研究未能考虑所有微区域因素.
为了进一步比较监测站点实测值和拟合值之间的差异,列出了每个季度8个检验样本的拟合值和实测值(图 3).验证数据集的模拟值和真实值基本一致,验证数据集的平均相对准确率为97.4%,这说明基于地理加权GWR算法的LUR模型可以简单有效地估计PM2.5质量浓度.
 |
| 图 3 检验样本PM2.5观测值和拟合值 Fig. 3 Observed and fitted PM2.5 in the cross validation dataset |
为了更直观地分析杭州地区PM2.5空间分布特征,对杭州市区4个季度的PM2.5浓度值的空间分布进行了模拟(图 4).从图中可以看出杭州地区PM2.5呈明显的空间分布特征,每个季度的PM2.5均值空间分布都不相同,冬季污染最严重.春季污染强点主要位于城市中部、夏季污染强点位于余杭区北部、秋季污染强点位于萧山区东部,冬季污染强点主要位于城市中东部,不同季度污染高值中心向周边呈扩散趋势.这主要是由于城市下垫面(大气底部与地表的接触面)特性对气候的影响造成的(王丽萍,2009),城市汽车尾气排放、工业科技园区污染、极端的天气变化都可能引起下垫面热量状况的不均匀性,从而形成局地环流,影响PM2.5浓度近地分布.杭州西南地区的PM2.5浓度值在4个季节都较低,这是因为西湖区以南多为山川丘陵,植被覆盖面积大,人为活动较少,森林植被对大气细颗粒污染物有吸附作用(赵晨曦等,2013).钱塘江流经西湖区和滨江区边界,开阔的水域地带增加了空气湿度,较高的大气湿度对于空气污染物的沉降有一定影响(王勇等,2006).
 |
| 图 4 基于GWR模型各季度 PM2.5浓度空间模拟分布 Fig. 4 Spatial distribution of seasonal PM2.5 concentrations for the GWR model |
基于LUR模型决定样本数量时没有特定的原理依据,但是以往的研究选取数量是在20到100之间(Hoek et al.,2008).最近在赫罗纳地区(西班牙)的研究分析表明,基于少量的站点建立的LUR模型也具有较高的拟合精度(Basagaña et al.,2006).本研究利用杭州10个监测站点的数据,建立4个季度的预测模型,拟合精度R2值达到70%以上,因此,基于较少的监测站点建立预测模型也是可行的.基于不同算法的土地利用回归模型其性能有差异,地理加权算法考虑到地理空间异质性,所以在处理具有空间异质性的参数因子时发挥了其优势(Li et al.,2015),除此之外,模型的精度还可以归因于数据质量和不同土地类型的分类精度(Liu et al.,2015).本研究提取了60个预测因子,基于GWR算法尽可能将与PM2.5相关的因子纳入模型.建立土地利用回归模型时,不仅需要建立样点缓冲区,还要对监测站点周围情况进行描述.由于在研究中缺乏高精度的影像数据,所以模型预测因子的提取只依赖不同等级的缓冲区.利用模型模拟长时段的PM2.5均值是极为有效的,这不仅可以提高PM2.5监测的空间分辨率,还可以降低监测成本,特别适用于路网密度较高的重工业城市和建筑群体较多的商业化城镇(Hoek et al.,2002).本研究中将LUR模型初步应用在杭州地区PM2.5质量浓度的遥感监测实践中,建立的模型效果显著,得到的PM2.5浓度分布符合杭州市实际情况.
5 结论(Conclusions)1) 训练模型的拟合效果较理想,拟合系数R2值分别为0.86(春季)、0.87(夏季)、0.82(秋季)、0.89(冬季).调整R2值都在0.7以上.基于GWR算法的LUR模型能够有效降低地理变量的空间异质性.
2) 检验模型的R2值分别达到0.76(春季)、0.70(夏季)、0.73(秋季)、0.76(冬季).模型能够解释PM2.5浓度值80%以上的变异.
3) 对比模拟值和真实值,结果表明验证数据集的准确率高,平均相对误差率不到3%,说明预测模型可以简单有效地估计PM2.5质量浓度.
4) 预测模型能够较好解释PM2.5质量浓度的空间分布特征,杭州市区4个季度的PM2.5质量浓度呈明显的空间分布特征.
| [1] | Aguilera I, Sunger J, Ferandez-patier R, et al. 2008. Estimation of outdoor NOx, NO2 and BTEX exposure in a cohort of pregnant women using land use regression modeling[J]. Environmental Science & Technology , 42 (3) : 815–821. |
| [2] | Arain M A, Blair R, Finkelstein N, et al. 2007. The use of wind fields in a land use regression model to predict air pollution concentrations for health exposure studies[J]. Atmospheric Environment , 41 (16) : 3453–3464. DOI:10.1016/j.atmosenv.2006.11.063 |
| [3] | Amini H, Taghavi-Shahri S M, Naddafi K, et al. 2013. Correlation of air pollutants with land use and traffic measures in Tehran, Iran:a preliminary statistical analysis for land use regression modeling[J]. Journal of Advances in Environmental Health Research , 1 (1) : 1–8. |
| [4] | Basagaña X, Rivera M, Aguilera I, et al. 2012. Effect of the number of measurement sites on land use regression models in estimating local air pollution[J]. Atmospheric Environmental , 54 (5) : 634–642. |
| [5] | Briggs D, Collins S, Elliot P, et al. 1997. Mapping urban air pollution using GIS: a regression-based approach[J]. International Journal of Geographical Information Science , 11 (7) : 699–718. DOI:10.1080/136588197242158 |
| [6] | 陈莉, 白志鹏, 苏笛, 等.2009. 利用LUR模型模拟天津市大气污染物浓度的空间分布[J]. 中国环境科学 , 2009, 29 (7) : 685–691. |
| [7] | Chen L, Bai Z, Kong S, et al. 2010. A Land Use Regression for Predicting NO2 and PM10 Concentrations in Different Seasons in Tianjin Region, China[J]. Jounnal of Environmental Science , 22 (9) : 1364–1373. DOI:10.1016/S1001-0742(09)60263-1 |
| [8] | Chen L, Wang Y M, Li P W, et al. 2012. A Land Use Regression Model Incorporating Data on Industrial Point Source Pollution[J]. Jounnal of Environmental Science , 24 (7) : 1251–1258. DOI:10.1016/S1001-0742(11)60902-9 |
| [9] | Colleen E R, Michael J, Maya L, et al. 2015. Spatiotemporal Prediction of Fine Particulate Matter During the 2008 Northern California Wildfires Using Machine Learning[J]. Science & Technology , 49 (6) : 3887–3896. |
| [10] | Mishra D, Goyal P, Upadhyay A. 2015. Artificial intelligence based approach to forecast PM2.5 during haze episodes:A case study of Delhi, India[J]. Atmospheric Environment , 102 : 239–248. DOI:10.1016/j.atmosenv.2014.11.050 |
| [11] | Dons E, Poppel M V, Kochan B, et al. 2013. Modeling temporal and spatial variability of traffic-related air pollution: hourly land use regression models for black carbon[J]. Atmospheric Environmental , 74 (2) : 237–246. |
| [12] | Du X, Kong Q, Ge W, et al. 2010. Characterization of personal exposure concentration of fine particles for adults and children exposed to high ambient concentrations in Beijing[J]. Journal of Environmental Sciences-china , 11 (11) : 1757–1764. |
| [13] | Eeftens M, Beelen R, Kees D H, et al. 2012. Development of land use regression models for PM2.5, PM2.5 absorbance, PM10 and PM coarse in 20 European study areas; results of the ESCAPE project[J]. Environmental Science & Technology , 46 (20) : 11195–11205. |
| [14] | 藩小川, 李国星, 高婷. 2012. 危险的呼吸-PM2.5的健康危害和经济损失评估研究[M]. 北京: 中国环境出版社 . |
| [15] | Fotheringham A S, Charlton M, Brunsdon C. 1996. The geography of parameter space:An investigation of spatial non-stationarity[J]. International Journal of Geographical Information Systems , 10 (5) : 605–627. DOI:10.1080/02693799608902100 |
| [16] | Henderson S B, Beckerman B, Jerrett M, et al. 2007. Application of land use regression to estimate long-term concentrations of traffic-related nitrogen oxides and fine particulate of traffic-related nitrogen oxides and fine particulate matter[J]. Environmental Science and Technology , 41 (7) : 2422–2428. DOI:10.1021/es0606780 |
| [17] | Hoek G, Beelen R, Vienneau D. 2008. A review of land-use regression models to assess spatial variation of outdoor air pollution[J]. Atmospheric Environment , 42 (33) : 7561–7578. DOI:10.1016/j.atmosenv.2008.05.057 |
| [18] | Hoek G, Brunekreef B, Goldbohm S, et al. 2002. Association between mortality and indicators of traffic-related air pollution in the Netherlands: a cohort study[J]. Lancet , 360 (9341) : 1203–1209. DOI:10.1016/S0140-6736(02)11280-3 |
| [19] | Hoogh K, Wang M, Adam M, et al. 2013. Development of land use regression models for particle composition in 20 study areas in Europe[J]. Environment Science & Technology , 47 (11) : 5778–5786. |
| [20] | 焦利民, 徐刚, 赵素丽, 等.2015. 基于LUR的武汉市PM2.5浓度空间分布模拟[J]. 武汉大学学报 , 2015, 40 (8) : 1088–1094. |
| [21] | Lee J H, Wu C F, Gerard H, et al. 2015. LUR models for particulate matters in the Taipei metropolis with high densities of roads and strong activities of industry, commerce and construction[J]. Science of the Total Environment , 514 : 178–184. DOI:10.1016/j.scitotenv.2015.01.091 |
| [22] | Li C, Du S Y, Bai Z P, et al. 2010. Application of land Use Regression for Estimating Concentrations of Major Outdoor Pollutants in Jinan[J]. Jounnal of Zhejiang University , 11 (11) : 857–867. DOI:10.1631/jzus.A1000092 |
| [23] | Liu W, Li X D, Chen Z, et al. 2015. Land use regression models coupled with meteorology to model spatial and temporal variability of NO2 and PM10 in Changsha, china[J]. Atmospheric Environmental , 116 (4) : 72–80. |
| [24] | Li X D, Liu W, Chen Z, et al. 2015. The application of semicircular-buffer-based land use regression models incorporating wind direction in predicting quarterly NO2 and PM10 concentrations[J]. Atmospheric Environmental , 103 : 18–24. DOI:10.1016/j.atmosenv.2014.12.004 |
| [25] | Prendes P, Andrade J M, Lopez M P, et al. 1999. Source apportionm ent of inorganic ions in airbome urban particles from Coruna city using positive matrix factorization[J]. Talanta , 49 (1) : 165–178. DOI:10.1016/S0039-9140(98)00356-7 |
| [26] | 齐冰, 杜荣光, 查贲, 等.2015. 杭州地区一次严重雾霾过程气溶胶特性分析[J]. 气象与环境学报 , 2015, 31 (4) : 35–41. |
| [27] | 瞿明凯, 李卫东, 张传荣, 等.2014. 地理加权回归及其在土壤和环境科学上的应用前景[J]. 土壤(Soils) , 2014, 46 (1) : 15–22. |
| [28] | Rob B, Gerard H, Danielle V, et al. 2013. Development of NO2 and NOx land use regression models for estimating air pollution exposure in 36 study areas in Europe-The ESCAPE project[J]. Atmospheric Environment , 72 (2) : 10–23. |
| [29] | Su J G, Brauer M, Ainslie B, et al. 2008. An innovative land use regression model incorporating meteorology for exposure analysis[J]. Science of the Total Environment , 390 (2) : 520–528. |
| [30] | 王景雷, 康绍忠, 孙景生, 等.2013. 基于 PCA 和 GWR 的作物需水量空间分布估算[J]. 科学通报 , 2013, 58 (12) : 1131–1139. |
| [31] | 王丽萍.2009. 城市下垫面对微气候影响研究[J]. 现代农业科学 , 2009, 16 (6) : 188–189. |
| [32] | 王勇, 胡晏玲.2006. 在不同相对湿度条件下雾对空气质量的影响[J]. 新疆环境保护 , 2006, 28 (3) : 15–18. |
| [33] | 赵晨曦, 王玉杰, 王云琦, 等.2013. 细颗粒物(PM2.5)与植被关系的研究综述[J]. 生态学杂志 , 2013, 32 (8) : 2203–2210. |
| [34] | 翟广宇, 王式功, 董继元, 等.2015. 兰州市不同径粒大气颗粒物污染特征及气象因子的影响分析[J]. 生态环境学报 , 2015, 24 (1) : 70–75. |