 2016, Vol. 36


生物固氮是指固氮生物利用体内的固氮酶将N2催化还原成NH3(Howarth et al.,1988a)的过程.它是海洋和湖泊等生态系统初级生产力的限制性因素,影响着C和N的生物地球循环(Falkowski et al., 2000;Galloway,1998;Schlesinger,1997).固氮作用不仅出现在贫营养的土壤、海洋、湖泊、河口和河流等生态系统中(Brooks et al., 1971;Mague and Burris, 1973;Stewart et al., 1971);还出现在氮营养充足甚至富营养的海洋和湖泊等水环境中(Robart and Zohary, 1987;Tison et al., 1977).
固氮速率的测定方法主要有总氮变量法(Stewart et al., 1967)、15N同位素法(Hardarson et al., 1991)、乙炔还原法(Beversdorf et al., 2013;Glass et al., 2010)等.这些方法在不同的环境介质(土壤、水环境、生物等)的固氮速率中均被不同程度的广泛使用,并反映出不同的优缺点.总氮变量法是直接测定系统N变量的方法,其操作和计算简单,但测量误差大、灵敏度低、准确度差、实验时间长(Stewart et al., 1967);15N同位素法是测定固N量较灵敏方法,灵敏度比总氮变量法高40~100倍左右,且直接采用15N标记的氮气(或溶解态氮气)作为固氮过程底物,具有较高的可靠性,但其实验时间较长、操作繁冗且须配备同位素和质谱仪等,测定费用高(Stewart et al., 1967),更重要的是,由于15N2在水体中需要较长时间的溶解平衡,如果测定过程时间较短,往往由于平衡不够充分而导致固氮速率的低估(Mohr et al., 2010).乙炔还原法(Acetylene Reduction Technique,简称ART)(Hardy et al., 1968;Stewart et al., 1967)是一种较经典的测定方法,通过测定固氮生物体中的固氮酶催化C2H2还原成C2H4(Dilworth,1966;Rusness and Burris, 1970)的量来计算固氮生物催化N2还原成NH3量的一种间接测定固氮速率方法,其计算需要乙炔还原与氮气还原的当量系数,并通过当量系数转换成固氮速率.该方法具有试验操作简单、方便、耗费少(Stewart et al., 1967),高准确度和精度,灵敏度比15N同位素法高103~104倍(Hardy et al., 1973),且其产物C2H4稳定,便于储存,因而至今仍被广泛用于各种水体、生物膜、沉积物等水环境固氮作用的研究中(Beversdorf et al., 2013;Glass et al., 2010;Andersson et al.,2014;Thad and Grantz, 2013).
太湖富营养化问题长期受到关注(McCarthy et al., 2007;孔繁翔和高光,2005;秦伯强等,2011),其根本原因是湖泊水体中N、P等营养物的过量输入.湖泊中N的外部来源主要包括河流输入、面源输入、大气沉降和生物固氮等.前3种来源已有大量的的监测和研究;但太湖水体生物固氮来源的研究和报道目前仍十分匮乏.McCarthy等(2003)在湖心区沉积物-水界面通量的研究中发现了水体向沉积物迁移的氮气通量,推测该区域可能发生固氮作用(McCarthy et al., 2007),但仍缺乏直接证据.已有许多湖泊的固氮研究表明,生物固氮是部分湖泊富营养化过程中的重要氮源(Horne and Goldman, 1972;Howarth et al., 1988b).水体的固氮作用,不仅会影响湖泊的氮收支平衡及污染物容量,还能对水体污染防治措施的有效性产生影响.
太湖,位于长江中下游平原,是一个典型的大型浅水富营养化湖泊,水域面积2338 km2,平均水深2 m,是我国第三大浅水湖泊(张路等,2004).太湖富营养化机理和控制策略等迄今已有较多研究(崔广柏等,2009;秦伯强等,2011),但关于富营养化问题解决方法中营养盐控制策略的有效性研究成果甚少.
本文拟通过原位模拟试验方法对太湖水体的固氮作用进行研究,探索太湖水体的固氮作用的存在及其时空变化特征,为太湖氮平衡的构建和完善、营养盐总量控制和削减提供科学依据.
2 材料和方法(Materials and methods) 2.1 样品的采集和处理自2011年5月到2012年2月,选择全湖33个样点(图 1)按季度(2011年5月(春季)、2011年8月(夏季)、2011年11月(秋季)、2012年2月(冬季))进行固氮速率的测定.采样时用GPS进行定位,现场用便携式多参数水质分析仪(YSI)测定并记录常规水质参数、风速风向仪测定现场风数据.用5 L有机玻璃采水器采集0.6 m深度内的混合水样,根据水体中蓝藻生物量的多寡对水样进行不同程度的预浓缩处理(25#浮游生物网(200目)),将原水样和浓缩液保存于聚乙烯塑料瓶中.采样当日15点前完成采样和水样固氮速率的测定.
 |
| 图1 太湖样点图 Fig.1 The sampling sites of Taihu Lake |
本文用ART法(Granhall and Lundgren, 1971;Stewart et al., 1967)对采集水样进行固氮速率的测定.固氮生物体内的固氮酶既能将N2催化固定成NH3,也能催化C2H2还原成C2H4.C2H2和N2与固氮酶结合部位并不相同,两者是固氮酶催化反应的非竞争性底物(Hwang et al., 1973),因此用ART不但能准确测定固氮速率,而且测定结果不受试验环境中N2的影响.操作过程简述如下:
取一定量浓缩(或原水)样于培养瓶中,保持瓶内水体和顶空的体积比为5:1,合上胶塞,用注射器注入一定体积C2H2气体(10%,V/V),保持培养瓶内的C2H2分压为10132.5 Pa(Granhall and Lundgren, 1971;Hardy et al., 1973),在气体注入口涂上硅橡胶防止漏气.摇匀后将培养瓶悬挂放置在太湖湖泊生态系统研究站栈桥,控制水深为30 cm左右,以保持与样点基本一致的温度、光照和风浪扰动等.培养时间为2 h(Beversdorf et al., 2013;Stewart et al., 1967),每个样设3个平行.培养结束后,向培养瓶中抽取一定体积顶空气体样品转移预先抽过真空的玻璃瓶中室温保存,用气相色谱仪(GC5970II,填充柱:Porapak N;FID检测器)对气体样品进行检测分析(David and Fay, 1977;Stewart et al., 1967).
2.2.2 固氮速率计算固氮酶催化N2和C2H2还原的方程式可以表述为:
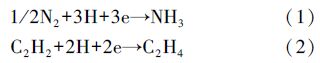
在提供产出1 mol NH3所需电子数的情况下,固氮酶会催化产出1.5 mol C2H4,则1.5是C2H4-NH3的理论当量转换系数.尽管该系数在不同的生态系统中会存在一定差异(1.2~2.1)(Bergersen,1970;Hardy et al., 1973;Stewart et al., 1968),但基本保持在理论值1.5附近.事实上,多数固氮作用的研究(Brooks et al., 1971;Teal et al., 1979)也都采用1.5作为两者的转换系数.为了便于与不同生物固氮研究成果进行比较,本研究采用1.5作为两者的转换系数.
气相色谱仪对气体样品的检测采用保留时间进行定性分析,峰高进行定量分析.
固氮速率计算公式:
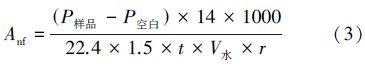
式中,Anf为固氮速率(ng · L-1 · h-1);P样品、P空白为样品、空白样中的C2H4的量(μL);r为水样浓缩比例;14为N摩尔质量(g · mol-1);1.5为固氮速率转换系数;t为培养时间(h);V水为试验水样体积(L).
3 结果(Results) 3.1 固氮作用的空间差异太湖水体固氮速率表现出明显的空间差异(表 1,图 2,图 3).固氮速率的全年最高值出现在梅梁湾(32号点,Anf=16.60 ng · L-1 · h-1);最低值出现在贡湖湾(13号点,Anf=0).梅梁湾和竺山湾是固氮速率较高的湖区,贡湖湾、湖心区和西岸湖区的固氮速率总体较低.
| 表1 太湖各样点水体固氮速率年均值 Table 1 The annual mean values of nitrogen fixation rate of each site in Taihu Lake |
 |
| 图2 太湖不同湖区固氮速率 Fig.2 The nitrogen fixation rates of water column in different areas of Taihu Lake |
 |
| 图3 太湖水体固氮速率 Fig.3 The nitrogen fixation rate of the water in Taihu Lake |
在春季,太湖西岸湖区(0.17 ng · L-1 · h-1)的固氮速率较高,而东岸湖区(0.08 ng · L-1 · h-1)的固氮速率较低.夏季太湖水体的最高固氮速率出现在北部湖区梅梁湾(14.64 ng · L-1 · h-1);竺山湾(2.86 ng · L-1 · h-1)、湖东岸(2.21 ng · L-1 · h-1)等湖区也表现较强的固氮作用,而其他水域如湖心区、贡湖湾等的固氮作用较弱.在秋季,位于北半湖区的竺山湾(0.55 ng · L-1 · h-1)和梅梁湾(0.13 ng · L-1 · h-1)水域的固氮速率较高,其他如湖心区、东西岸区等湖区的固氮速率较低.冬季太湖水体最大固氮速率湖区为西岸区(Anf=1.03×10⁻⁴ ng · L-1 · h-1),其他湖区的固氮速率低于检测限或者不存在固氮作用.
3.2 固氮作用的季节变化太湖水体的固氮速率表现出明显的季节差异(图 3、图 4).固氮速率从春季开始逐渐增强,在夏季达到最高峰后经秋季缓缓减弱,在冬季降到最低值.春季时,固氮作用较弱,Anf在0~0.41 ng · L-1 · h-1之间,均值为0.10 ng · L-1 · h-1(SD=0.092 ng · L-1 · h-1);夏季时,固氮速率显著增加并达到全年的最高值,Anf在0~66.10 ng · L-1 · h-1之间,均值为5.88 ng · L-1 · h-1(SD=12.11 ng · L-1 · h-1),夏季的固氮速率比春、秋季高1个数量级,比冬季高5个数量值.固氮速率在秋季逐渐降低,Anf在0~1.88 ng · L-1 · h-1之间,均值为0.14 ng · L-1 · h-1(SD=0.32 ng · L-1 · h-1),稍高于春季.太湖水体在冬季基本不存在固氮作用,多数水体固氮速率极低,Anf在0~2.26×10⁻⁴ ng · L-1 · h-1之间,均值为5.62×10⁻⁵ ng · L-1 · h-1(SD=5.68×10⁻⁵ ng · L-1 · h-1).
 |
| 图4 不同季节下太湖水体的固氮速率 Fig.4 The nitrogen fixation rates of the water in Taihu Lake among different seasons |
水生态系统中固氮生物的生物量、营养、盐度、光照、温度、深度、微量元素等(Fu and Bell, 2003;Howarth et al., 1988a;Wetzel,1983)都是影响固氮作用的因素.先后有Drewes、Fogg等(Fogg,1942)发现鱼腥藻(Ananbaena spp)和束丝藻(Aphanizomenon spp)等蓝藻是淡水系统中的主要固氮生物(Capone and Carpenter, 1982;Gruber and Sarmiento, 1997).将太湖6个湖区4个季节的固氮速率与对应浮游生物的生物量进行相关分析时发现,湖区固氮速率与蓝藻生物量存在显著正相关关系(r=0.452,p<0.05)(Horne and Goldman, 1972).另一方面,由于同一次采样时间内,太湖湖区水体的温度基本相同(全湖最大温差仅2.69 ℃),温度不会显著影响不同湖区的固氮速率.因此,我们可以推测固氮生物蓝藻的生物量是导致太湖水体固氮速率空间差异的主要原因.此外,不同湖区间营养盐(Smith,1992)、风浪扰动(Carpenter and Price, 1976)等因素的差异也可能会在一定程度上强化固氮速率的空间差异.
从湖区固氮速率和水温的散点图(图 5)可以发现:固氮速率随水温的增加呈现增加趋势,相关分析得出太湖水体固氮速率与其水温(4~32 ℃)呈极显著正相关关系(p<0.01).温度主要通过改变固氮微生物的新陈代谢和固氮酶的活性来影响固氮作用的强度(Wetzel,1983).一方面,温度的适度增加能加快固氮生物的生长(Canale and Vogel, 1974),从而加强固氮作用(McQueen and Lean, 1987);另一方面,固氮酶活性会随着温度的升高而增加(Robarts and Zohary, 1987),固氮作用随之也会增强.由于水体固氮速率和蓝藻生物量之间的显著相关关系和蓝藻生物量的显著季节性变化(夏高冬低),尽管在我们的现场研究中得到的水体温度与固氮速率之间的显著相关性,也不能简单解释成温度对固氮速率的决定性作用,但其仍是导致太湖固氮速率夏高冬低季节性特征的一个重要原因(Horne and Goldman, 1972).
 |
| 图5 不同湖区固氮速率与水温散点图 Fig.5 The Scatterplot of the nitrogen fixation rates and temperature |
不论是不同湖区,还是不同季节,太湖水体都表现出一定强度的固氮作用(表 1,图 3),年均Anf=1.53 ng · L-1 · h-1.以太湖水体表层0.6 m的透光层作为太湖固氮作用发生层,14 h · d-1为日固氮作用时间(Stewart et al., 1971),则可计算出太湖水体的年固氮量为10.73 t(即4.6 mg · m-2 · a-1).与太湖其他氮源(面源、河流输入等)相比,太湖水体的固氮量甚少,对太湖水体氮负荷的输入贡献也甚低.
不同水生态系统中的水体生物固氮作用存在明显差异(表 2).太湖水体固氮速率(4.6 mg · m-2 · a-1)比部分海洋(如Pacific Ocean:2.0 mg · m-2 · a-1)高 1倍,比贫营养湖泊(如Lake Superior:0.3 mg · m-2 · a-1)高1个数量级;但远低于富营养化湖泊(0.2~9.2 g · m-2 · a-1)(如Rietvlei dam:9.2 g · m-2 · a-1).
| 表2 太湖水体与其他水系统的固氮作用比较 Table 2 The comparison of nitrogen fixation between Taihu Lake and the other water systems |
由于固氮藻在无光条件下也能利用呼吸作用提供的能量来进行固氮作用(Horne,1979; Mullineaux et al., 1980),而本研究选择0.6 m透光层作为固氮作用发生层,14 h的固氮作用时间,在一定程度可能造成太湖水体固氮速率的低估.
4.3 水体固氮作用研究的意义为了解决淡水湖泊的氮磷过剩导致的富营养化问题,长期以来一直有单独控氮法(Howarth and Marino, 2006)、控磷法(Vollenweider,1976;Schindler,1977)和氮磷双控法(Conley et al., 2009).从氮磷比考虑,单独控氮(Howarth and Marino, 2006),造成的氮限制,将可能出现适合固氮蓝藻的生长(Schindler,1977;Schindler et al., 1987),从而出现以固氮蓝藻水华替代非固氮蓝藻水华的现象,因此,单独控氮可能并非富营养化蓝藻爆发的解决方法(Schindler et al., 2008).许多湖泊营养盐控制的实践证明:许多湖泊采用单独控磷(Vollenweider,1976;Havens et al., 2001;Conley et al., 2009)来解决富营养化问题的方案都并不成功.因此,固氮速率的估算,不仅可以进一步加深太湖氮的输入输出过程,也可为富营养化湖泊治理及营养盐的控制策略提供参考.
5 结论(Conclusions)1)太湖水体的固氮速率存在明显的空间特征.梅梁湾、竺山湾等北部湖区的固氮速率明显高于湖心区、贡湖湾等其他湖区.不同湖区水体中固氮微生物的生物量(p<0.05)是导致太湖不同湖区固氮速率差异的主要原因.
2)太湖水体固氮速率具有明显的季节变化特征.固氮速率表现出夏季最高、春秋季次之、冬季最低的特点.温度通过改变固氮微生物的新陈代谢和固氮酶的活性来影响水体固氮作用的强弱,水温是导致太湖水体固氮速率季节差异的主要原因(p<0.01).
3)太湖水体存在一定的固氮作用,固氮速率为1.53 ng · L-1 · h-1,远高于部分海洋和贫营养湖泊,但远低于部分中、富营养湖泊.太湖年固氮量为10.73 t(4.6 mg · m-2 · a-1).
| [1] | Andersson B, Sundbäck K, Hellman M, et al. 2014. Nitrogen fixation in shallow-water sediments: Spatial distribution and controlling factors[J]. Limnology and Oceanography, 59(6): 1932-1944 |
| [2] | Ashton P J. 1981. Nitrogen fixation and the nitrogen budget of a eutrophic impoundment[J]. Water Research, 15(7): 23-833 |
| [3] | Bergersen F J. 1970. The quantitative relationship between nitrogen fixation and the acetylene-reduction assay[J]. Australian Journal of Biological Sciences, 23(4): 1015-1026 |
| [4] | Beversdorf L J, Miller T R, McMahon K D. 2013. The role of nitrogen fixation in cyanobacterial bloom toxicity in a temperate, eutrophic lake[J]. PLoS One, 8(2): e56103 |
| [5] | Brooks Jr R H, Brezonik P L, Putnam H D, et al. 1971. Nitrogen fixation in an estuarine environment: the Waccasassa on the Florida Gulf Coast[J]. Limnology and Oceanography, 16(5): 701-710 |
| [6] | Canale R P, Vogel A H. 1974. Effects of temperature on phytoplankton growth[J]. Journal of the environmental engineering Division, 100(1): 231-241 |
| [7] | Capone D G, Carpenter E J. 1982. Nitrogen fixation in the marine environment[J]. Science, 217(4565): 1140-1142 |
| [8] | Carpenter E J, Price C C. 1976. Marine oscillatoria (Trichodesmium): explanation for aerobic nitrogen fixation without heterocysts[J]. Science, 191(4233): 1278-1280 |
| [9] | Carpenter E J. 1983. Nitrogen fixation by Marine Oscillatoria (Trichodesmium) in the world's oceans//Carpenter E J, Capone D G. Nitrogen in the Marine Environment[M]. New York: Academic Press. 65-103 |
| [10] | Conley D J, Paerl H W, Howarth R W, et al. 2009. Controlling eutrophication: nitrogen and phosphorus[J]. Science, 323(5917): 1014-1015 |
| [11] | 崔广柏, 刘凌, 姚琪, 等. 2009. 太湖流域富营养化控制机理研究[M]. 北京: 中国水利水电出版社. 1-254 |
| [12] | David K D, Fay P. 1977. Effects of long-term treatment with acetylene on nitrogen-fixing microorganisms[J]. Applied and Environmental Microbiology, 34(6): 640-646 |
| [13] | Dilworth M J. 1966. Acetylene reduction by nitrogen-fixing preparations from Clostridium pasteurianum[J]. Biochimica et Biophysica Acta (BBA)-General Subjects, 127(2): 285-294 |
| [14] | Falkowski P, Scholes R J, Boyle E, et al. 2000. The global carbon cycle: A test of our knowledge of earth as a system[J]. Science, 290(5490): 291-296 |
| [15] | Flett R J, Schindler D W, Hamilton R D, et al. 1980. Nitrogen fixation in Canadian Precambrian shield lakes[J].Canadian Journal of Fisheries and Aquatic Sciences, 37(3): 494-505 |
| [16] | Fu F X, Bell P R F. 2003. Effect of salinity on growth, pigmentation, N2 fixation and alkaline phosphatase activity of cultured Trichodesmium sp.[J]. Marine Ecology-Progress Series, 257: 69-76 |
| [17] | Fogg G E. 1942. Studies on nitrogen fixation by blue-green algae[J]. Jour Exptl Biol, 19: 78-87 |
| [18] | Galloway J N. 1998. The global nitrogen cycle: changes and consequences[J]. Environmental Pollution, 102(1Supplement1): 15-24 |
| [19] | Glass J B, Wolfe-Simon F, Elser J J, et al. 2010, Molybdenum-nitrogen co-limitation in freshwater and coastal heterocystous cyanobacteria [J]. Limnology and Oceanography, 55(2): 667-676 |
| [20] | Granhall U, Lundgren A. 1971. Nitrogen fixation in lake Erken[J]. Limnology and Oceanography, 16(5): 711-719 |
| [21] | Gruber N, Sarmiento J L. 1997. Global patterns of marine nitrogen fixation and denitrification[J]. Global Biogeochemical Cycles, 11(2): 235-266 |
| [22] | Hardarson G, Danso S K A, Zapata F, et al. 1991. Measurements of nitrogen fixation in fababean at different N fertilizer rates using the 15N isotope dilution and 'A-value'methods[J]. Plant and Soil, 131(2): 161-168. |
| [23] | Hardy R W F, Holsten R D, Jackson E K, et al. 1968. The acetylene-ethylene assay for N2 fixation: laboratory and field evaluation[J]. Plant Physiology, 43(8): 1185-1207 |
| [24] | Hardy R W F, Burns R C, Holsten R D. 1973. Applications of the acetylene-ethylene assay for measurement of nitrogen fixation[J]. Soil Biology and Biochemistry, 5(1): 47-81 |
| [25] | Havens K E, Fukushima T, Xie P, et al. 2001. Nutrient dynamics and the eutrophication of shallow lakes Kasumigaura (Japan), Donghu (PR China), and Okeechobee (USA) [J]. Environmental Pollution, 111(2): 263-272 |
| [26] | Horne A J. 1979. Nitrogen fixation in Clear Lake, California. 4. Diel studies on Aphanizomenon and Anabaena blooms[J]. Limnology and Oceanography, 24(2): 329-341 |
| [27] | Horne A J, Fogg G E. 1970. Nitrogen fixation in some English lakes[J]. Proceedings of the Royal Society of London. Series B. Biological Sciences, 175(1041): 351-366 |
| [28] | Horne A J, Goldman C R. 1972. Nitrogen fixation in Clear Lake, California. I. Seasonal variation and the role of heterocysts[J]. Limnology and Oceanography, 17(5): 678-692 |
| [29] | Howarth R W, Marino R, Cole J J. 1988a. Nitrogen fixation in freshwater, estuarine, and marine ecosystems. 2. Biogeochemical controls[J]. Limnology and Oceanography, 33(4part2): 688-701 |
| [30] | Howarth R W, Marino R, Lane J, et al. 1988b. Nitrogen fixation in freshwater, estuarine, and marine ecosystems. 1. Rates and importance[J]. Limnology and Oceanography, 33(4part2): 669-687 |
| [31] | Howarth R W, Marino R. 2006. Nitrogen as the limiting nutrient for eutrophication in coastal marine ecosystems: Evolving views over three decades[J]. Limnology and Oceanography, 51(1part2): 364-376 |
| [32] | Hwang J C, Chen C H, Burris R H. 1973. Inhibition of nitrogenase-catalyzed reductions[J]. Biochimica et Biophysica Acta (BBA)-Bioenergetics, 292(1): 256-270 |
| [33] | 孔繁翔, 高光. 2005. 大型浅水富营养化湖泊中蓝藻水华形成机理的思考[J]. 生态学报, 25(3): 589-595 |
| [34] | Mague T H, Burris R H. 1973. Biological nitrogen fixation in the Great Lakes[J]. BioScience, 23(4): 236-239 |
| [35] | McCarthy M J, Lavrentyev P J, Yang L Y, et al. 2007. Nitrogen dynamics and microbial food web structure during a summer cyanobacterial bloom in a subtropical, shallow, well-mixed, eutrophic lake (Lake Taihu, China)[J]. Hydrobiologia, 581(1): 195-207 |
| [36] | McQueen D J, Lean D R S. 1987. Influence of water temperature and nitrogen to phosphorus ratios on the dominance of blue-green algae in Lake St. George, Ontario[J]. Canadian Journal of Fisheries and Aquatic Sciences, 44(3): 598-604 |
| [37] | Mohr W, Grokopf T, Wallace D W R, et al. 2010. Methodological underestimation of oceanic nitrogen fixation rates[J]. PLoS One, 5(9): e12583 |
| [38] | Mugidde R, Hecky R E, Henszel L L, et al. 2003. Pelagic nitrogen fixation in lake Victoria (East Africa)[J]. Journal of Great Lakes Research, 29(S2): 76-88 |
| [39] | Mullineaux P M, Chaplin A E, Gallon J R. 1980. Effects of a light to dark transition on carbon reserves, nitrogen fixation and ATP concentrations in cultures of Gloeocapsa (Gloeothece) sp. 1430/3[J]. Journal of General Microbiology, 120(1): 227-232 |
| [40] | 秦伯强, 许海, 董百丽. 2011. 富营养化湖泊治理的理论与实践[M]. 北京: 高等教育出版社. 1-326 |
| [41] | Robarts R D, Zohary T. 1987. Temperature effects on photosynthetic capacity, respiration, and growth rates of bloom-forming cyanobacteria[J]. New Zealand Journal of Marine and Freshwater Research, 21(3): 391-399 |
| [42] | Rusness D, Burris R N. 1970. Acetylene reduction (nitrogen fixation) in Wisconsin lakes[J]. Limnology and Oceanography, 15(5): 808-813. |
| [43] | Schindler D W. 1977. Evolution of phosphorus limitation in lakes[J]. Science, 195(4275): 260-262 |
| [44] | Schindler D W, Hecky R E, Findlay D L, et al. 2008. Eutrophication of lakes cannot be controlled by reducing nitrogen input: results of a 37-year whole-ecosystem experiment[J]. Proceedings of the National Academy of Sciences, 105(32): 11254-11258. |
| [45] | Schindler D W, Hesslein R H, Turner M A. 1987. Exchange of nutrients between sediments and water after 15 years of experimental eutrophication[J]. Canadian Journal of Fisheries and Aquatic Sciences, 44(S1): s26-s33 |
| [46] | Schlesinger W H. 1997. Biogeochemistry: an analysis of global change[M]. San Diego: Academic Press. 8-588 |
| [47] | Smith V H. 1992. Effects of nitrogen: phosphorus supply ratios on nitrogen fixation in agricultural and pastoral ecosystems[J]. Biogeochemistry, 18(1): 19-35 |
| [48] | Staal M J, Te Lintel Hekkert S, Brummer G J, et al. 2007. Nitrogen fixation along a north-south transect in the eastern Atlantic Ocean[J]. Limnology and Oceanography, 52(4): 1305-1316 |
| [49] | Stal L J, Walsby A E. 1998. The daily integral of nitrogen fixation by planktonic cyanobacteria in the Baltic Sea[J]. New Phytologist, 139(4): 665-671 |
| [50] | Stewart W D P, Fitzgerald G P, Burris R H. 1967. In situ studies on N2 fixation using the acetylene reduction technique[J]. Proceedings of the National Academy of Sciences of the United States of America, 58(5): 2071-2078 |
| [51] | Stewart W D P, Fitzgerald G P, Burris R H. 1968. Acetylene reduction by nitrogen-fixing blue-green algae[J]. Archiv für Mikrobiologie, 62(4): 336-348 |
| [52] | Stewart W D P, Mague T, Fitzgerald G P, et al. 1971. Nitrogenase activity in Wisconsin lakes of differing degrees of eutrophication[J]. New Phytologist, 70(3): 497-509 |
| [53] | Teal J M, Valiela I, Berlo D. 1979. Nitrogen fixation by rhizosphere and free-living bacteria in salt marsh sediments[J]. Limnology and Oceanography, 24(1): 126-132 |
| [54] | Thad Scott J, Grantz E M. 2013. N2 fixation exceeds internal nitrogen loading as a phytoplankton nutrient source in perpetually nitrogen-limited reservoirs[J]. Freshwater Science, 32(3): 849-861 |
| [55] | Tison D L, Palmer F E, Staley J T. 1977. Nitrogen fixation in lakes of the Lake Washington drainage basin[J]. Water Research, 11(9): 843-847 |
| [56] | Vollenweider R A. 1976. Advance in defining critical loading levels for phosphorus in lake eutrophication[J]. Memorie Dellistituto Italiano Di Idrobiologia Dott Marco De Marchi Verbania Pallanza, 33: 53-83 |
| [57] | Wetzel R G. 1983. Limnology (2nd ed) [M]. Philadelphia: Saunders College Publishing. 309-312 |
| [58] | 张路, 范成新, 池俏俏, 等. 2004. 太湖及其主要入湖河流沉积磷形态分布研究[J]. 地球化学, 33(4): 423-432 |