 2015, Vol. 35


2. 南开大学环境科学与工程学院, 国家环境保护城市空气颗粒物污染防治重点实验室, 天津 300071
2. State Environmental Protection Key Laboratory of Urban Ambient Air Particulate Matter Pollution Prevention and Control, College of Environmental Science and Engineering, Nankai University, Tianjin 300071
降水在清除大气中颗粒物及其可溶性气态污染物方面起着重要作用,降水的pH、化学组分与大气中污染物密切相关(Al-Khashman 2005; Migliavacca et al.,2005).为了解大气污染状况及变化历程,与大气污染密切相关的降水化学组成特征引起广泛的关注(Lee et al., 2000; Heuer et al., 2000; Topçu et al., 2002; Migliavacca et al., 2005; Lu et al., 2011).20世纪80年代,北美和欧洲开始对大气降水的化学组分进行系统的研究(Zeng and Hopke, 1989; Khwaja and Husain, 1990; Samara et al., 1992; Avila 1996; Nilles and Conley, 2001; Ito et al., 2002; Kelly et al., 2002; Aherne and Farrell, 2002; Hnová et al., 2004; Zhao and Gao, 2008; Calvo et al., 2010).研究表明:由于局地SO2排放量的降低,降水中SO42-浓度在两大区域呈现出下降的趋势(Kelly et al., 2002; Hnová et al., 2004).近年来,我国很多学者对不同地域的降水化学组分进行了研究(杨复沫等,2004;Huang et al., 2008a,2008b,2009; Xu and Han, 2009; Tu et al., 2005; Cao et al., 2009; Xu et al., 2009; Wang and Han, 2011; Zhang et al., 2003,2007,2012; 肖红伟等,2010),但研究多集中于较短时期的观测与分析(Xu and Han, 2009; Zhang et al., 2012; Huang et al., 2008b,2009; Cao et al., 2009; Xu et al., 2009; Wang and Han, 2011; Zhang et al., 2003,2007; 肖红伟等,2010),缺少长时间跨度的变化趋势研究,难以全面反映我国城市大气污染变化历程以及客观评估我国大气污染防控措施效果.本文利用天津市2001年至2013年大气降水采集数据,分析了天津市13年来大气降水pH、EC及化学组分变化趋势,确定大气降水中化学组分的不同来源及相对贡献,以期为城市快速发展过程中有效开展大气污染防治提供科学依据.
2 实验与方法(Experiment and methods) 2.1 研究区域天津市位于北纬38°34′~40°15′、东经116°43′~118°04′之间,地处华北平原东北部,是环渤海地区的经济、金融中心,工业发达,主要工业包括石油化工、电子、机械制造、冶金等.天津面积为11946 km2,人口为1400万.天津属暖温带半湿润大陆季风型气候,四季分明,多年平均温度为11.4~12.9 ℃,平均降水量为520~660 mm,主导风向为西南风.采样点位于南开区天津市环境监测中心四楼顶,距地面约15 m 左右,采样器距楼顶的距离为1.2 m,周围没有明显局地污染源.点位分布见图 1.
 |
| 图 1 天津市采样点位分布图 Fig. 1 Location of the sampling stations in Tianjin |
采用统一专用的无色聚乙烯样品桶收集降水样品,逢雨(雪)必测.当降水连续超过24 h时,将上午9:00至次日9:00的降水视为一个样品;若1 d中有几次降水(雪)过程,可合并为一个样品测定.降水收集后立即取部分样品用pH 仪和电导率仪分别测量降水的pH 值与EC,其余样品用0.45 μm的微孔滤膜过滤,过滤后的样品装入无色聚乙烯塑料瓶,在 3~5 ℃的冰箱中保存用于分析化学组分.分析仪器如下:pH 分析仪(PHS-3C),电导率分析仪(YSI30),离子色谱仪(ICS-1000).2001年至2013年共收集样本总量为375个,每年降雨量及样本量如图 2所示.
 |
| 图 2 2001—2013年天津市降雨量及样本数量 Fig. 2 Annual rainfall and number of samples in Tianjin during 2001—2013 |
样品的采集与分析严格按照《大气降水样品的采集与保存》(GB13580.2-92)、《酸沉降监测技术规范》(HJ/T165—2004)有关要求进行.每次采样前后用自来水和去离子水清洗采样桶;为减少干沉降的影响,每次在降水开始前将采样桶放置于采样点位,降水结束2 h内将样品从采集装置中取出;每月进行1次实际的平行采样与分析;所有离子成分分析测定时均带实验室空白,每季进行1次样品采集到过滤等操作的全程序空白试验,空白试验的分析结果应小于各项目分析方法的检出限;每个样品均进行离子平衡评价.为了排除仪器分析方法以及外部环境对样本质量的影响,属于以下4种情况之一的样品予以剔除:①样品被沙尘或者鸟类排泄物污染的;②分析数据在区间(m-3δ,m+3δ)之外的(m为平均值,δ为标准偏差);③降雨量小于1 mm的;④当离子总量大于100 μeq · L-1时,阴阳离子偏差在15%~30%之外的;当离子总量在 50~100 μeq · L-1时,阴阳离子偏差在30%~60% 之外的(Rastogi and Sarin, 2005; Zhang et al., 2007).依据以上标准,15%左右的数据被剔除.
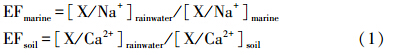
2.4 分析及评估方法运用最小二乘线性回归方法评价降水中离子浓度的变化趋势,运用(SPSS 11.5)进行趋势分析及显著性检验.富集因子(Enrichment factors,EF)用来估算降水中离子的来源(Lu et al., 2011; Cao et al., 2009; Zhang et al., 2007).通常,Na是海水中最佳的参考元素(Kulshrestha et al., 2003),Al和Ca 是典型的亲石元素,可作为陆源性离子的参考元素.为了估算大气降水中海洋和陆相来源的贡献,将Ca2+、Na+分别作为土壤和海水的参考元素(Cao et al., 2009; Zhang et al., 2007),运用公式(1)计算大气降水中离子的富集因子:
2001—2013年,天津市每年降水的雨量加权平均pH、酸雨频率变化趋势如图 3所示.年雨量加权平均pH的范围为4.86~7.20,总体雨量加权平均值为5.48.pH在2003—2005年较低,此后表现为波浪式的上升趋势,整体表现为增加的趋势(r=0.57,p=0.05).天津市降水的酸雨频率在2003—2005年最高,以后逐年下降,从2008年开始,酸雨频率为0,这与pH增加的趋势基本吻合.
 |
| 图 3 2001—2013年天津市降水雨量加权平均pH、酸雨频率变化趋势 Fig. 3 Temporal variations of volume-weighted mean pH and acid frequency in precipitation of Tianjin during 2001—2013 |
将3—5月、6—8月、9—11月、12月—次年2月划分春、夏、秋、冬四季.2001—2013年各季节雨量加权平均pH及酸雨频率变化趋势如图 4所示.从季节分布上看,天津市降水的pH春季最高,秋季次之,夏、冬季较低.酸雨频率则表现为冬季最高,秋季、夏季次之,春季最低.春季为典型风沙季节,降水偏少,因此,降水中地壳元素含量较高,降水容易偏碱性,故春季pH较高,酸雨频率较低.冬季为供暖时段,燃煤排放的前体物SO2、NOx较多,SO42-、NO3-在冬季最高,因此,冬季pH较低,酸雨频率较高.
 |
| 图 4 2001—2013年天津市不同季节降水雨量加权平均pH、酸雨频率变化趋势 Fig. 4 Variations of volume-weighted mean pH and acid frequency in precipitation of different seasons in Tianjin during 2001—2013 |
降水中pH的升高与降水中碱性成分的中和能力增加有关.因为不同区域降水中组分的含量以及中和能力不同,天津市pH高于广州(4.49)(Cao et al., 2009)、金华(4.45)(Zhang et al.,2007)、大连(4.79)(Zhang et al., 2012)、上海(4.49)(Huang et al., 2008b)、成都(5.1)(Wang and Han, 2011)、深圳(5.02)(Huang et al., 2008a)、北京(5.12)(Xu and Han, 2009),但低于南京(5.51)(Tu et al., 2005)、西安(6.64)(Lu et al., 2011)、兰州(7.70)(Xu et al., 2009)、青海(7.1)(Zhang et al., 2003).与亚洲其它国家相比,天津市pH高于韩国的首尔(4.70)(Lee et al., 2000)和日本的东京(4.52)(Okuda et al., 2005).
 |
| 图 5 2001—2013天津市年雨量加权平均EC及离子总量变化趋势 Fig. 5 Temporal variations of volume-weighted mean EC and total ionic concentrations in precipitation of Tianjin during 2001—2013 |
降水的EC主要是由其中水溶性离子组分贡献的,其数值与雨水中阴阳离子总和有关.2001—2013年,天津市EC雨量加权平均值的范围为48~195 μS · cm-1,平均值为87 μS · cm-1(图 5).EC表现为明显升高的趋势(r=0.67,p=0.05),最高值出现在2011年,此后明显下降并保持基本平稳.降水中离子总量的变化趋势与EC相似,总体呈现上升趋势(r=0.59,p=0.03).从季节分布上看(图 6),天津市EC雨量加权平均值、离子总量的变化趋势相似,在冬季最高,春季、秋季次之,夏季最低.与其它城市相比,天津市EC值高于金华(20.3 μS · cm-1)(Zhang et al., 2007)、深圳(25.52 μS · cm-1)(Huang et al., 2008a)、大连(55.39 μS · cm-1)(Zhang et al., 2012)、北京(76.88 μS · cm-1)(Xu and Han, 2009)和西安(82.8 μS · cm-1)(Lu et al., 2011),表明天津市大气降水受人为污染的影响较大.
 |
| 图 6 2001—2013年天津市不同季节雨量加权平均EC及离子总量变化趋势 Fig. 6 Variations of volume-weighted mean EC and total ionic concentrations in precipitation of different seasons in Tianjin during 2001—2013 |
2001—2013年,天津市降水中各离子雨量加权平均当量浓度如表 1所示,总离子当量浓度为1096 μeq · L-1,远高于龙凤山(175.16 μeq · L-1,中国东北部大气本底站)和上甸子(417.79 μeq · L-1,中国北部大气本底站)(Li et al., 2010),这说明天津市降水中化学组分受人为影响较大,二次污染较为严重.降水中各离子雨量加权平均当量浓度从高到低的顺序为:SO42-> Ca2+> NH4+> NO3-> Cl-> Mg2+> Na+> F-> K+.SO42-、Ca2+、NH4+、NO3-是降水中的主要离子,占离子总量的84.8%,这与我国的上海(Huang et al., 2008b)、大连(Zhang et al., 2012)、北京(Xu and Han, 2009)降水组成情况相似.SO42-和NO3-是降水中含量较高的阴离子组分,对总离子的贡献分别为31.4%、9.6%,Ca2+和NH4+是降水中含量较高的阳离子组分,对总离子的贡献分别为27.9%、15.9%.从季节分布上看(图 7),天津市降水中各离子的雨量加权平均当量浓度在冬季最高,这可能与冬季燃煤量多及土地裸露风沙较大有关.除NH4+外,其余离子的雨量加权平均当量浓度在夏季最低,这可能与夏季燃煤量少植被覆盖面积大有关.
| 表1 2001—2013年天津市降水的化学组分雨量加权平均离子当量浓度 Table 1 Average annual volume-weighted mean concentration of chemical compositions in precipitation of Tianjin during 2001—2013 |
 |
| 图 7 2001—2013年天津市不同季节降水的化学组分雨量加权平均离子当量浓度 Fig. 7 Volume-weighted mean concentration of chemical compositions in precipitation of different seasons in Tianjin during 2001—2013 |
天津市大气降水中主要离子雨量加权平均当量浓度变化趋势如图 8所示.降水中SO42-、NO3-受气体污染物(SO2、NOx)以及大气颗粒物的共同影响(Calvo et al., 2010; 徐虹等,2010).2001—2007年,SO42-雨量加权平均当量浓度显示为上升趋势(r=0.58,p=0.16),2008年出现低值,这与北京举办奥运会周边城市加强环境管理有关;2009年以后,SO42-雨量加权平均当量浓度呈现明显下降趋势(r=-0.96,p=0.01),SO42-雨量加权平均当量浓度变化趋势与“十一五”期间SO2总量控制力度加大有关.NO3-雨量加权平均当量浓度显示为明显的上升趋势(r=0.84,p=0.00),2001—2013年,天津市机动车保有量呈现井喷式增长趋势,机动车保有量由2001年的84万辆增加到2013年的273万辆,增幅为225.0%(天津市统计局,1985—2013),除此之外,“十二五”以前,我国对NOx的排放并没有实施总量控制,天津市每年燃煤量逐年增加,这些均导致NOx的排放量逐年增加.天津市NO3-的这种变化趋势与南京(Tu et al., 2005)、深圳(Huang et al., 2008a)相同.
 |
| 图 8 2001—2013年天津市降水中SO42-、NO3-、NH4+、Ca2+变化趋势 Fig. 8 Temporal variations of SO42-,NO3-,NH4+ and Ca2+ in precipitation of Tianjin during 2001—2013 |
阳离子中Ca2+雨量加权平均当量浓度变化趋势与SO42-变化趋势相似,同样在2008年出现拐点. 2001—2013年,Ca2+显示为明显上升趋势(r=0.53,p=0.06),这与南京(Tu et al., 2005)、深圳(Huang et al., 2008a)变化趋势不同.Ca2+主要来自土壤、道路扬尘及建筑施工等,近年来,天津市城市化进程加速,建筑施工活动剧增,使得城市开放源(扬尘、土壤风沙尘和建筑尘等)对环境颗粒物一直保持在较高的分担率(肖致美等,2014),通过云下冲刷进入降水的Ca2+较高.需要注意的是,SO42-、Ca2+在2103年变化趋势明显的不同,这可能与天津市2013年城区地铁大面积施工有关.NH4+雨量加权平均当量浓度显示为下降趋势(r=-0.52,p=0.59),这与农业活动的影响降低有关.此外,F-、Cl-、K+、Mg2+、Na+(见图 9)等离子雨量加权平均当量浓度变化趋势基本保持平稳,无明显变化.
 |
| 图 9 2001—2013年天津市降水中F-、Cl-、Mg2+、Na+、K+变化趋势 Fig. 9 Temporal variations of F-,Cl-,Mg2+,Na+ and K+ in precipitation of Tianjin during 2001—2013 |
SO42-和NO3-、Ca2+和NH4+分别是降水中含量较高的阴、阳离子组分,2001—2013年,它们各自对总阴、阳离子分担率的变化趋势如图 10、图 11所示.SO42-对总阴离子的分担率(r=-0.23,p=0.4)、NH4+总阳离子的分担率(r=-0.50,p=0.08)均呈现下降趋势;NO3-对总阴离子的分担率(r=0.58,p=0.04)、Ca2+对总阳离子的分担率均呈现明显上升趋势(r=0.53,p=0.06).同样,降水中[NO3-]/[SO42-](r=0.55,p=0.05)、[Ca2+]/[NH4+](r=0.45,p= 0.12)的值(图 12)也呈现出明显上升趋势,这说明降水中NO3-对酸化的相对贡献逐渐增强,而Ca2+对中和作用的相对贡献逐渐增强.
 |
| 图 10 2001—2013年天津市降水中SO42-及NO3-对总阴离子分担率的变化趋势 Fig. 10 Trends in contributions of SO42- and NO3- to total anion mass in precipitation of Tianjin during 2001—2013 |
 |
| 图 11 2001—2013年天津市降水中Ca2+及NH4+对总阳离子分担率的变化趋势 Fig. 11 Contributions of Ca2+ and NH4+ to total cation mass in precipitation of Tianjin during 2001—2013 |
 |
| 图 12 降水中[NO3-]/[SO42-]及[Ca2+]/[NH4+]的变化趋势 Fig. 12 Ratios of [NO3-]/[SO42-] and [Ca2+]/[NH4+] in precipitation of Tianjin during 2001—2013 |
利用式(1)计算2001—2013年天津市降水中离子组分相对于海水和土壤的富集因子,海水中X/Na+比例参考(Keene et al., 1986)海水成分数据,土壤中 X/Ca2+比例参考(Taylor,1964)的地壳成成分数据.结果如表 2所示.富集因子远大于1或远小于1表明降水中的离子组成相对于参考物质被富集或稀释.Cl-的EFmarine为1.23,在1附近波动,EFsoil为52.48,远远大于1,表明降水中的Cl-主要来自海洋源的贡献.Ca2+、K+的EFmarine分别为198.64、18.18,说明Ca2+、K+主要来自陆源的贡献.Mg2+有部分来自海洋源,但来自陆源的贡献依然占比较大.SO42-的EFmarine、EFsoil分别为78.56、59.81,表明SO42-相对于海水和土壤高度富集,海洋源和陆源中的SO42-几乎可以忽略不计,降水中的SO42-主要来自人为源的贡献.海水中的NO3-的含量很低,降水中NO3-基本不考虑海洋的来源,而NO3-的EFsoil为163.64,表明NO3-也主要来自人为源的贡献.
| 表2 天津市降水中离子组分相对于海水和土壤的富集因子 Table 2 Enrichment factors relative to seawater and soil for precipitation constituents in Tianjin |
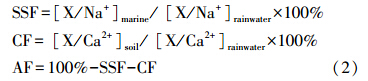
假设大气降水中离子主要来源为海水溅射、岩石和土壤风化以及人为活动(忽略火山及其它天然源的贡献).运用公式(2)计算海洋源输入(SSF)、岩石/土壤风化(CF)以及人为活动输入(AF)的相对贡献(Cao et al., 2009; Zhang et al., 2007),结果见表 3.
| 表3 天津市降水中不同离子组分来源的相对贡献 Table 3 Source contributions for different ionic constituents in precipitation of Tianjin |
根据计算结果(表 3),81.1%的Cl-来自海洋源的输入,另外18.9%来自岩石风化和人为排放,这种研究结果和深圳(90%来自海洋)(Huang et al., 2008a)、金华(85.3%来自海洋)(Zhang et al., 2007)相似,但与大连(54.1%来自海洋)(Zhang et al., 2012)略有不同.降水中99.5%的Ca2+主要来自陆源输入,Mg2+和K+部分来自海洋源输入,但绝大部分来自陆源输入.需要说明的是K+也可能来自生物质的燃烧,由于很难定量区分地壳源和生物质燃烧源的贡献,本次研究认为K+均来自地壳.人为活动对SO42-、NO3-的贡献分别为97.0%、99.4%.
4 结论(Conclusions)1)天津市雨量加权平均pH的范围为4.86~7.20,总雨量加权平均值为5.48,pH表现出增加的趋势.降水的酸雨频率在2003—2005年最高,以后逐年下降直至为0,与pH增加的趋势基本吻合.
2)EC雨量加权平均值的范围为48~195 μS · cm-1,总雨量加权平均值为87 μS · cm-1,EC表现为明显升高的趋势.降水中离子总量的变化趋势与EC相似,总体呈现上升趋势.
3)降水中总离子当量浓度为1096 μeq · L-1,各离子雨量加权平均当量浓度从高到低的顺序为:SO42-> Ca2+> NH4+> NO3-> Cl-> Mg2+> Na+> F-> K+.SO42-、Ca2+、NH4+、NO3-是降水中的主要离子,占离子总量的84.8%.
4)SO42-雨量加权平均当量浓度表现为先轻微上升后明显下降趋势.NO3-、Ca2+雨量加权平均当量浓度表现为明显上升趋势.NH4+雨量加权平均当量浓度显示为下降趋势.F-、Cl-、K+、Mg2+、Na+等雨量加权平均当量浓度变化趋势基本平稳,无明显变化.[NO3-]/[SO42-]、[Ca2+]/[NH4+]表现出明显上升趋势.
5)SO42-对总阴离子的分担率、NH4+总阳离子的分担率均呈现下降趋势.NO3-对总阴离子的分担率、Ca2+对总阳离子的分担率均呈现明显上升趋势.
6)富集因子计算结果表明:降水中Ca2+主要来自地壳,Mg2+和K+部分来自海洋输入,但绝大部分来自地壳,大部分Cl-来自海洋源的输入,其余小部分来自地壳和人为排放,SO42-、NO3-则主要来自人为活动.
| [1] | Aherne J, FarrelL E P. 2002. Deposition of sulphur, nitrogen and acidity in precipitation over Ireland: chemistry, spatial distribution and long-term trends [J]. Atmospheric Environment, 36(8): 1379-1389 |
| [2] | Al-Khashman A O. 2005. Study of chemical composition in wet atmospheric precipitation in Eshidiya area, Jordan [J]. Atmospheric Environment, 39(33): 6175-6183 |
| [3] | Avila A. 1996. Time trends in the precipitation chemistry at a mountain site in northeastern Spain for the period 1983—1994 [J]. Atmospheric Environment, 30(9): 1363-1373 |
| [4] | Calvo A I, Olmo F J, Lyamani H, et al. 2010. Chemical composition of wet precipitation at the background EMEP station in Víznar (Granada, Spain) (2002—2006) [J]. Atmospheric Research, 96(2/3): 408-420 |
| [5] | Cao Y Z, Wang S Y, Zhang G, et al. 2009. Chemical characteristics of wet precipitation at an urban site of Guangzhou, South China [J]. Atmospheric Research, 94(3): 462-469 |
| [6] | Heuer K, Tonnessen K A, Ingersoll G P. 2000. Comparison of precipitation chemistry in the Central Rocky Mountains, Colorado, USA [J]. Atmospheric Environment, 34(11): 1713-1722 |
| [7] | Huang D Y, Xu Y G, Peng P A, et al. 2009. Chemical composition and seasonal variation of acid deposition in Guangzhou, South China: comparison with precipitation in other major Chinese cities [J]. Environmental Pollution, 157(1): 35-41 |
| [8] | Huang K, Zhuang G S, Xu C, et al. 2008b. The chemistry of the severe acidic precipitation in Shanghai, China [J]. Atmospheric Research, 89(1/2): 149-160 |
| [9] | Huang Y L, Wang Y L, Zhang L P. 2008a. Long-term trend of chemical composition of wet atmospheric precipitation during 1986—2006 at Shenzhen City, China [J]. Atmospheric Environment, 42(16): 3740-3750 |
| [10] | Hnová I, Šantroch J, Ostatnická J. 2004. Ambient air quality and deposition trends at rural stations in the Czech Republic during 1993—2001 [J]. Atmospheric Environment, 38(6): 887-898 |
| [11] | Ito M, Mitchell M, Driscoll C T. 2002. Spatial patterns of precipitation quantity and chemistry and air temperature in the Adirondack region of New York [J]. Atmospheric Environment, 36(6): 1051-1062 |
| [12] | Keene W C, Pszenny A A P, Gallloway J N, et al. 1986. Sea-salt corrections and interpretation of constituent ratios in marine precipitation [J]. Journal of Geophysical Research, 91(D6): 6647-6658 |
| [13] | Kelly V R, Lovett G M, Weathers K C, et al. 2002. Trends in atmospheric concentration and deposition compared to regional and local pollutant emissions at a rural site in southeastern New York, USA [J]. Atmospheric Environment, 36(10): 1569-1575 |
| [14] | Khwaja H A, Husain L. 1990. Chemical characterization of acid precipitation in Albany, New York [J]. Atmospheric Environment (Part A. General Topics), 24(7): 1869-1882 |
| [15] | Kulshrestha U C, Kulshrestha Monika J, Sekar R, et al. 2003. Chemical characteristics of rainwater at an urban site of south-central India [J]. Atmospheric Environment, 37(21): 3019-3026 |
| [16] | Lee B K, Hong S H, Lee D S. 2000. Chemical composition of precipitation and wet deposition of major ions on the Korean peninsula [J]. Atmospheric Environment, 34(4): 563-575 |
| [17] | Li Y, Yu X L, Cheng H B, et al. 2010. Chemical characteristics of precipitation at three Chinese regional background stations from 2006 to 2007 [J]. Atmospheric Research, 96(1): 173-183 |
| [18] | Lu X W, Li L Y, Li N, et al. 2011. Chemical characteristics of spring rainwater of Xi'an city, NW China [J]. Atmospheric Environment, 45(28): 5058-5063 |
| [19] | Migliavacca D, Teixeira E C, Wiegand F, et al. 2005. Atmospheric precipitation and chemical composition of an urban site, Guaíba Hydrographic Basin, Brazil [J]. Atmospheric Environment, 39(10): 1829-1844 |
| [20] | Nilles M A, Conley B E. 2001. Changes in the chemistry of precipitation in the United States, 1981—1998 [J]. Water, Air, and Soil Pollution, 130(1/4): 409-414 |
| [21] | Okuda T, Iwase T, Ueda H, et al. 2005. Long-term trend of chemical constituents in precipitation in Tokyo metropolitan area, Japan, from 1990 to 2002 [J]. Science of the Total Environment, 339(1/3): 127-141 |
| [22] | Rastogi N, Sarin M M. 2005. Chemical characteristics of individual rain events from a semi-arid region in India: three-year study [J]. Atmospheric Environment, 39(18): 3313-3323 |
| [23] | Samara C, Tsitouridou R, Balafoutis C H. 1992. Chemical composition of rain in Thessaloniki, Greece, in relation to meteorological conditions [J]. Atmospheric Environment (Part B. Urban Atmosphere), 26(3): 359-367 |
| [24] | Taylor S R. 1964. Abundance of chemical elements in the continental crust: a new table [J]. Geochimica et Cosmochimica Acta, 28(8): 1273-1285 |
| [25] | 天津市统计局. 1985—2013. 天津统计年鉴1985-2013 [M]. 北京: 中国统计出版社 |
| [26] | Topçu S, Incecik S, Atimtay A T. 2002. Chemical composition of rainwater at EMEP station in Ankara, Turkey [J]. Atmospheric Research, 65(1/2): 77-92 |
| [27] | Tu J, Wang H S, Zhang Z F, et al. 2005. Trends in chemical composition of precipitation in Nanjing, China, during 1992—2003 [J]. Atmospheric Research, 73(3/4): 283-298 |
| [28] | Wang H, Han G L. 2011. Chemical composition of rainwater and anthropogenic influences in Chengdu, Southwest China [J]. Atmospheric Research, 99(2): 190-196 |
| [29] | 肖红伟, 肖化云, 王燕丽. 2010. 贵阳大气降水化学特征及来源分析 [J]. 中国环境科学, 30(12): 1590-1596 |
| [30] | 肖致美, 毕晓辉, 冯银厂, 等. 2014. 天津市大气颗粒物污染特征与来源构成变化 [J]. 环境科学研究, 27(3): 246-252 |
| [31] | 徐虹, 毕晓辉, 林丰妹, 等. 2010. 杭州市大气降雨化学组成特征及来源分析[J]. 环境污染与防治, 32(7): 75-81 |
| [32] | Xu Z F, Li Y S, Tang Y, et al. 2009. Chemical and strontium isotope characterization of rainwater at an urban site in Loess Plateau, Northwest China [J]. Atmospheric Research, 94(3): 481-490 |
| [33] | Xu Z F, Han G L. 2009. Chemical and strontium isotope characterization of rainwater in Beijing, China [J]. Atmospheric Environment, 43(12): 1954-1961 |
| [34] | 杨复沫, 贺克斌, 雷宇, 等. 2004. 2001—2003年间北京大气降水的化学特征[J]. 中国环境科学, 24(5): 538-541 |
| [35] | Zeng Y, Hopke P. 1989. A study of the sources of acid precipitation in Ontario, Canada [J]. Atmospheric Environment, 23(7): 1499-1509 |
| [36] | Zhang D D, Jim C Y, Peart M R, et al. 2003. Rapid changes of precipitation pH in Qinghai Province, the northeastern Tibetan Plateau [J]. Science of the Total Environment, 305(1/3): 241-248 |
| [37] | Zhang M Y, Wang S J, Wu F C, et al. 2007. Chemical compositions of wet precipitation and anthropogenic influences at a developing urban site in southeastern China [J]. Atmospheric Research, 84(4): 311-322 |
| [38] | Zhang X Y, Jiang H, Zhang Q X, et al. 2012. Chemical characteristics of rainwater in northeast China, a case study of Dalian [J]. Atmospheric Research, 116: 151-160 |
| [39] | Zhao Y, Gao Y. 2008. Mass size distributions of water-soluble inorganic and organic ions in size-segregated aerosols over metropolitan Newark in the US East Coast [J]. Atmospheric Environment, 42(18): 4063-4078 |