 2021, Vol. 64


2. 兰州交通大学测绘与地理信息学院, 兰州 730070;
3. 中国地震局地质研究所, 北京 100029;
4. 日本北海道大学地震与火山研究所, 日本札幌 0600810
2. Faculty of Geomatics, Lanzhou Jiaotong University, Lanzhou 730070, China;
3. Institute of Geology, China Earthquake Administration, Beijing 100029, China;
4. Institute of Seismology and Volcanology, Hokkaido University, Sapporo 0600810, Japan
在震间阶段处于闭锁状态的断层或断层段落不断积累应变,应变积累超过断层的强度时断层发生滑动并释放应变(Reid,1911).目前发现一些断层或断层段落的浅层在不同的空间尺度和时间尺度发生滑动,称为蠕滑(Louderback,1942),蠕滑可以缓慢地释放断层或断层段落所积累的应变,对地震孕育过程产生不可忽视的影响.由于断层在浅层的蠕滑和深部的闭锁可同时存在,断层一方面积累应变,同时也在浅层释放应变,因此,确定断层蠕滑和闭锁沿断层走向和深度的变化特征对研究地震循环过程具有重要意义(Maurer and Johnson, 2014;Harris, 2017).空间对地观测技术的发展则为获取高时空分辨率的断层变形特征提供了有效途径,联合高空间分辨率的合成孔径雷达差分干涉(Synthetic Aperture Radar Interferometry,InSAR)技术和高时间分辨率的全球定位系统(Global Positioning System,GPS)两种卫星大地测量手段,可以定量研究近断层地表蠕滑特征,反演断层的蠕滑速率和闭锁深度,进一步评估断层的地震危险性(Jolivet et al.,2012;Thomas et al.,2014).
鲜水河—小江断裂系统(图 1a)是青藏高原东南部活动性高、强震频发的大型陆内构造带之一,青藏高原的东北向推挤和川滇菱形块体的南南东向挤出使其表现出左旋走滑运动特征.强震导致的地表破裂特征明显,目前已确定的M>6地震的地表破裂区达到三十余处(Wen et al.,2008).鲜水河断裂带位于鲜水河—小江断裂系统的北西段,是分割巴颜喀拉地块和川滇地块的活动断裂,已确定的M>6地震的地表破裂区分布最为密集(张培震等,2003;Wen et al.,2008).全长约350 km的鲜水河断裂带在几何上表现为北西向的弧形,其北西段近百年来活动性强,发生~M7走滑型地震4次,包括1904年7级地震、1923年7.3级地震、1973年7.6级地震和1981年6.9级地震,破裂区域重叠覆盖整个炉霍—道孚段(图 1b)(Allen et al.,1991;Wen et al.,2008).Allen等(1991)通过野外地质调查分析认为鲜水河断裂带北西段滑动速率达到15±5 mm·a-1,并且从炉霍附近布设的蠕变仪(虾拉沱站)观测到断层蠕滑现象,1973年炉霍地震发生13年后仍以6 mm·a-1的平均速率持续滑动.GPS连续观测结果显示北西段滑动速率为10±2 mm·a-1(Shen et al.,2005).Wang等(2009)联合InSAR(ERS-1/2,Envisat)和GPS数据,基于蒙特卡罗方法估计该段滑动速率为9~12 mm·a-1,闭锁深度达3~6 km.Zhang等(2018)使用数十年的跨断层短基线和水准资料分析蠕滑速率随时间变化和沿走向空间分段特征,研究认为炉霍—道孚段蠕滑速率随时间推移逐渐减小,虾拉沱站和沟普站蠕滑速率分别为3.47±0.14 mm·a-1和1.09±0.10 mm·a-1,最大蠕滑深度达7.0 km.

|
图 1 (a) 鲜水河—小江断裂地震构造,(b)炉霍—道孚段地震构造和观测数据分布 (a)中,BYB:巴颜喀拉块体,CDB:川滇块体,GZYSF:甘孜—玉树断裂,XSHF:鲜水河断裂,ANHF:安宁河断裂,ZMHF:则木河断裂,XJF:小江断裂,LMSF:龙门山断裂,EHS:东喜马拉雅构造结.(b)中,右上角北南箭头指向表示卫星飞行方向,近东西向箭头表示视线向;图中黑色实线表示断层,蓝色、红色、紫色和棕色椭圆分别表示1973年M7.6地震、1923年M7.3地震、1904年M7地震和1981年M6.9地震的同震破裂区,高程分布和其他标志含义见左下角白底矩形框,其中GPS数据来自Wang和Shen(2020),强震破裂分布来自Wen等(2008),震源机制解参考Papadimitriou等(2004). Fig. 1 (a) Tectonic setting of Xianshuihe-Xiaojiang fault system; (b) Tectonic setting and geodetic data distribution in Luhuo-Daofu section In (a): BYB, Bayan Har Block; CDB, Chuan-Dian Block; GZYSF, Garzê-Yushu Fault; XSHF, Xianshuihe Fault; ANHF, Anninghe Fault; ZMHF, Zemuhe Fault; XJF, Xiaojiang Fault; LMSF, Longmenshan Fault; EHS, Eastern Himalayan Syntaxis. The north-south arrow in the upper right corner of (b) shows the satellite flight direction, and the east-west arrow indicates the LOS direction. The black solid lines indicate active faults, and the blue, red, purple and brown ellipses delineate the coseismic rupture areas of the 1973 M7.6 earthquake, the 1923 M7.3 earthquake, the 1904 M7 earthquake and the 1981 M6.9 earthquake, respectively. Within the inset box at the bottom left corner are the legend for elevation and other observational data. The GPS data are provided by Wang and Shen (2020), earthquake rupture areas are from Wen et al. (2008), and focal mechanisms refer to Papadimitriou et al. (2004). |
现有研究成果多基于跨断层短基线、水准测量数据或少量的GPS测站数据,数据空间分辨率较低,并且不同测量手段获得的结果差别较大.随着SAR卫星观测周期缩短、影像分辨率提高,数据处理和多源数据融合算法的更新,联合InSAR和GPS可以获取高时空分辨率的地表速度场,为研究断层运动特征、地震循环过程等提供可靠的数据.本文利用欧空局的Sentinel-1A降轨卫星数据获取炉霍—道孚段形变速度场,对近断层视线向(Line of Sight,LOS)形变速率沿走向等间距划分剖面,分析地表蠕滑特征.将GPS数据插值为连续速度场,去除参考框架影响后与InSAR速度场融合,采用贝叶斯方法反演炉霍—道孚段断层滑动速率和闭锁深度,分析其蠕滑特征和强震的活动周期,并讨论该段落的地震危险性.
1 InSAR数据处理本文收集2016年1月25日至2019年12月11日30期Sentinel-1A降轨影像进行时序干涉处理.Sentinel-1A卫星由欧空局于2014年4月发射升空,载波波长~5.54 cm(C波段),其时空分辨率和扫描尺度较以往卫星(ERS/Envisat)均有大幅提升,重访周期缩短至12天,IW模式空间分辨率和幅宽分别为5 m×20 m和240 km(Salvi et al.,2012).
选取2018年3月27日的SLC影像作为主影像,各像对垂直基线长度为-150 m至100 m(图 2).使用ISCE软件topsStack数据处理模块进行影像配准和差分干涉处理(Rosen et al.,2012;Fattahi et al.,2017),影像配准采用综合考虑主辅影像脉冲响应函数差异以及重叠区域偏差的增强谱分集方法(Enhanced Spectral Diversity,ESD)(Scheiber and Moreira, 2000),距离向和方位向多视比为4:1.使用StaMPS(Stanford Method for Persistent Scatterers)软件实现干涉图时序分析(Hooper et al.,2012),InSAR主要误差源包括大气误差、轨道误差和地形误差,C波段雷达卫星发射和接收电磁波主要受到对流层影响,产生相位延迟,本文使用永久散射体方法(Persistent Scatterers,PS)提取雷达波后向散射较强且时序上相对稳定的地物目标,数据信噪比较高,大气误差较小;轨道误差和地形误差分别使用POD精密定轨星历数据(精度~5 cm)和SRTM-1sec数字高程模型(分辨率为30 m×30 m)进行校正,以提高永久散射体的形变速率精度.

|
图 2 SAR影像垂直基线 Fig. 2 Perpendicular baselines of the interferogram pairs |
InSAR形变速率场处理结果如图 3所示,LOS向形变速率范围在-4 mm·a-1至4 mm·a-1之间,时间序列标准差整体分布于0~2 mm·a-1,部分区域受地形影响相对较大(图 4).炉霍—道孚段断层两侧形变速率存在明显差异,西南侧形变场以正值为主,代表卫星重访时间内,地面以靠近卫星视线方向运动为主,反之,东北侧以远离卫星视线方向为主.图 3中黑色实线框表示断层两侧各10 km区域,速度场在断层两侧存在明显的速度不连续性,并且沿断层走向呈现变化特征,表现出空间差异的浅层蠕滑现象(Bürgmann et al.,1998;Rosen et al.,1998).

|
图 3 InSAR LOS向形变速度场 正值表示地表靠近卫星的运动,黑色矩形框表示近断层10 km区域. Fig. 3 LOS rate map of InSAR Positive values indicate motion towards the satellite; the black rectangle is 10 km wide spanning the near-fault zone. |

|
图 4 InSAR时间序列标准差分布 Fig. 4 Standard deviation of the InSAR time series |
为了定量研究炉霍—道孚之间沿断层走向地表蠕滑速率的变化特征,分别选取断层两侧各5 km、10 km和15 km范围内LOS向形变速率进行分析.沿走向1 km等间隔划分垂直断层的剖面,并将各剖面内永久散射体速率投影至跨断层直线上,分别拟合断层两侧数据点,断层处偏移量作为LOS向蠕滑速率(Hussain et al.,2016).观测方程如下:
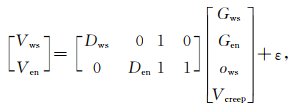
|
(1) |
式中,Dws和Den分别表示断层西南侧和东北侧数据点到断层的垂直距离;Vws和Ven表示对应点的LOS向形变速率;Gws和Gen分别表示西南侧和东北侧拟合线段的梯度值,ows是西南侧的偏移量;Vcreep是断层蠕滑速率;ε表示误差.
本文采用改进的自助抽样法统计每个剖面的蠕滑速率Vcreep,该算法适用于总样本量较小并存在严重离群点的情况,通过方差估计构建统计量的置信区间(Efron and Tibshirani, 1986;Hussain et al.,2016).在重复抽样中,分别对断层两侧进行对应总样本量的有放回抽样,以保证两侧参数估计的有效性,最终得到1 km间隔剖面基于500次自助抽样法获得的断层地表采样点蠕滑速率均值,并对各采样点蠕滑速率进行步长为1 km,窗长为20 km的移动均值滤波.
图 5为采样点分布和滤波结果,断层两侧各5 km、10 km和15 km区域内PS数据等间隔采样得到的LOS向蠕滑速率沿走向具有较好的连续性,整体上分布于0.3~3.5 mm·a-1之间.三条速率曲线沿断层走向变化特征一致,炉霍至道孚呈现速率增大、减小、再次增大的变化特征.格篓、墟虚处表现出低速蠕滑运动,LOS向蠕滑速率为~0.3~1.3 mm·a-1,炉霍处蠕滑速率为~1.0~1.7 mm·a-1,虾拉沱处上升至~1.8 mm·a-1;道孚段蠕滑速率明显高于炉霍段,沟普和道孚处LOS向蠕滑速率达~3.0 mm·a-1,道孚南东侧具有速率减小趋势.不同的跨断层剖面长度得到的地表蠕滑速率差异较小,为0~1.0 mm·a-1,但随着跨断层长度的增加,引入部分远场长波形变信号,蠕滑速率曲线波动性明显增强,如道孚两侧15 km跨断层长度采样得到的蠕滑速率相邻点变化梯度偏大,较为离散,考虑到近断层5 km区域InSAR速度场误差相对较大(图 4),因此本文确定断层两侧10 km作为近断层蠕滑效应的跨断层距离.

|
图 5 LOS向地表蠕滑速率 图中D表示所选取断层两侧的距离,红色、黑色、蓝色标记和线条分别表示利用跨断层两侧各5 km、10 km、15 km区域内PS点统计的沿断层走向1 km等间隔蠕滑速率和移动均值滤波结果,灰色区域表示高程. Fig. 5 Shallow creep rates in Line of Sight The D represents the distance on both sides of the fault; the red, black and blue marks and corresponding lines represent the creep rates at 1 km intervals along the fault strike and moving average filtering results, using Persistent Scatterers in the 5 km, 10 km, and 15 km areas on both sides of the fault, respectively. The gray area shows the elevation. |
利用InSAR技术获取的地表连续速度场LOS向精度达毫米级(Ferretti et al.,2001),但作为近极地轨道卫星,其对南北向形变并不敏感.利用GPS长时间连续观测得到的水平速度精度可达毫米级,但空间分辨率较低,监测范围较为局限(Bock and Melgar, 2016).联合InSAR和GPS则可以提高研究区域的时空观测能力,捕捉到详细的断层形变特征.本文提出的融合InSAR和GPS数据的方法主要分为如下步骤:(1)对GPS速度场进行插值,获取连续的地壳运动场;(2)将InSAR和GPS速度场统一转换至平行断层方向,借助InSAR数据去除GPS速度场参考框架影响;(3)基于远场形变反映断层长期构造运动的稳定性以及近场形变沿断层走向表现出的差异性,分别对远场和近场采用均值采样和四叉树采样,并保留近场的细节形变特征和远场的运动趋势特征.
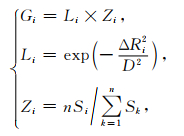
3.1 GPS速度场插值本文所使用GPS速度场来自于Wang和Shen(2020),研究区域的GPS测站主要为第一期和第二期“中国地壳运动观测网”项目和四川省地震局建立的GPS测站,观测时间长度最长达17年,分布于1999年至2016年之间.Wang和Shen(2020)综合考虑大地震同震和震后形变、GPS接收机差异引入的系统偏差等影响因素,并重新估计地球定向参数、卫星轨道和台站位置参数,获得欧亚框架下GPS速度场.图 6a为研究区内GPS水平速度场,本文使用Gaussian/Voronoi细胞加权函数对GPS速度场进行插值(Shen et al.,2015),该方法考虑GPS站点距离和台站有效形变面积建立权重函数(式(2)),因此插值结果与块体划分无关.并可设置断层破裂和蠕变段,以扣除无弹性应变积累区域,建立的Voronoi细胞分布如图 6b所示.图 6c表示插值速度幅度的分布,断层两侧表现出明显的差异,北向运动在该断裂处明显减弱.GPS连续形变场可准确地表现出断层的长期运动特征,但由于近断层站点分布稀疏,近断层的形变细节并不明显.其中权重函数表达式如下:

|
图 6 (a) GPS速度场;(b) Voronoi图;(c) GPS插值速率幅度值;(d) GPS速率不确定性幅度值 图中黑色矩形框表示近断层10 km区域. Fig. 6 (a) GPS velocity field; (b) Voronoi diagram; (c) Amplitudes of interpolated GPS velocity field; (d) Uncertainties of interpolated velocity field The black rectangle shows the area 10 km wide spanning the near-fault zone. |
|
(2) |
式中,Gi为权重函数,用于构建协方差矩阵,Li和Zi分别是距离函数和有效空间函数;D是空间平滑参数,ΔRi=ri-R,表示GPS站点与插值点之间的距离;n是GPS站点总数,Si表示所选数据点的Voronoi细胞面积.
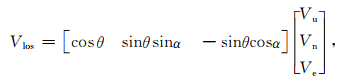
3.2 GPS速度场投影转换为使InSAR和GPS速度场统一,需将两组数据转换至同一方向,为此需要计算两组数据在该方向的差异常数.InSAR获取的PS点形变速率是垂直向、东西向和南北向三分量在视线向(LOS向)的投影叠加.图 7表示降轨SAR卫星的观测几何,LOS向形变速率Vlos可分解为垂直分量Vu和方位视线方向VALD(Azimuth Look Direction,ALD),如图 7a所示,方位视线方向可分解为南北向分量Vn和东西向分量Ve,因此,LOS向形变速率可表示为:

|
图 7 InSAR观测几何示意图 θ是卫星入射角,α是卫星飞行方向与北向夹角,φ是断层走向,Vpar和Vper分别表示平行断层方向和垂直断层方向. Fig. 7 Schematic figure of InSAR viewing geometry The θ is the incidence angle of the satellite, α represents the satellite heading, φ denotes the strike direction of fault, Vpar and Vper represent the fault-parallel and the fault-normal direction, respectively. |
|
(3) |
式中,θ为卫星入射角,α是卫星飞行方向与北向夹角,Vu、Vn、Ve分别表示垂直分量、南北向分量和东西向分量.
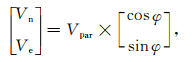
根据图 7b,当垂直断层只存在水平方向纯走滑运动时,平行断层方向速率Vpar满足:
|
(4) |
式中,φ为断层走向.
本文InSAR形变场PS点的入射角平均值为43.3184°,卫星飞行方向与北向夹角为195°,炉霍—道孚段断层倾角和走向分别为90°和132°(Papadimitriou et al.,2004),且该段垂直形变速率为亚毫米级(Zhang et al.,2018;Ji et al.,2020),其影响可忽略.定义南东向为正,则LOS向形变速率与平行断层方向速率满足Vlos=0.6113×Vpar,GPS速度场满足Vpar=0.7431×Ve-0.6691×Vn.
InSAR和GPS速度场同时转换至平行断层方向后,将对应位置差值拟合出的最佳平面作为两组数据的差异常数.为考虑速度场空间相关性,采用CBB(Circular Block Bootstrap)方法实现均值和方差估计(Politis et al.,1992),相对于经典bootstrap方法,该方法在抽样前基于特定长度和步长将样本分为若干块,则各块中保留了数据间的相关关系.本文首先将InSAR和GPS速度场按照0.05°×0.05°均值采样,原始块数据长度以及步长分别设置为50和10,进行500次自助抽样,均值估计量为12.3712 mm·a-1,估计量方差为0.0109 mm·a-1.去除框架影响后的GPS和InSAR采样点速度分布如图 8所示,除部分数据受局部形变特征影响外,两组数据整体分布相似.

|
图 8 自助抽样法平面拟合结果 Fig. 8 Plane fitting results of CBB |
为了统计去除框架影响后GPS速度场和InSAR速度场的形变值差异,利用bootstrap方法统计对应点差值的均值分布,并将大于95%右侧置信区间的数据点认定为差异较大,并设为拒绝阈值(图 9).大型断裂带的震间速度场一般由断裂带两侧块体的长波形变信号和蠕滑导致的跨断层不连续性形变构成.由第2节分析结果可知,炉霍—道孚段蠕滑速率沿走向表现出明显的差异性,为了保留近断层的局部速度变化特征,我们使用自适应四叉树采样算法(Jonsson,2002)进行采样,而GPS原始点位稀疏,并未表现出明显的局部变化,因此梯度计算只使用InSAR数据,GPS速度场按照InSAR窗口分割指令进行同步采样,对于大于拒绝阈值的数据点,只保留InSAR数据,其余数据点取GPS和InSAR的均值.远场数据使用0.025°×0.025°均值采样方法,而对于大于拒绝阈值的数据点,只使用GPS速度,保留整体运动特征.图 10为GPS、InSAR采样结果和速度场融合结果,融合后的速度场(图 10c)保留了近场局部细节形变和远场长波形变.

|
图 9 GPS和InSAR差异值自助抽样的频数分布 Fig. 9 Frequency distribution of difference between GPS and InSAR velocities using the bootstrap method |

|
图 10 (a) GPS形变采样;(b) InSAR形变采样;(c) GPS和InSAR形变融合 速度场均为平行断层方向速率.(c)中插图对应P1-P2段(黑色实线)的历史强震破裂区域. Fig. 10 The fault-parallel velocity component (a) Sampled GPS Data; (b) Sampled InSAR data; (c) Integrated deformation of GPS and InSAR The inset in (c) shows the rupture area of historical strong earthquakes in P1-P2 section (solid black line). |
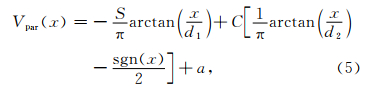
为了同时考虑浅层蠕滑和断层两侧块体深部长期的运动特征,我们建立了一个均质弹性半空间的简易螺旋位错模型(图 11).深度d1以下以速率S自由滑动,地表至深度d2以速率C进行蠕滑运动,d2至d1之间断层闭锁,积累弹性应变(Weertman and Weertman, 1964;Savage and Burford, 1973;Savage,1983).平行断层地表形变速率Vpar与断层运动参数之间关系可由式(5)表示(Hussain et al.,2016;Tymofyeyeva et al.,2019):

|
图 11 包含浅层蠕滑、中部闭锁和深部滑动的断层运动模型 图中单侧箭头表示左旋走滑运动,浅褐色区域表示断层面,d1、d2分别表示闭锁区深度和浅层蠕滑深度,闭锁区厚度为d1-d2,C和S分别表示浅层蠕滑速率和深部滑动速率,深褐色区域为深部滑动区,其中的双侧箭头表示断层右侧块体深部滑动方向. Fig. 11 Schematic representation of fault motion model including shallow creep, intermediate locked and deep slip layers The one-sided arrows in the figure represent sinistral strike-slip movement; the light brown area shows the fault plane; d1 and d2 represent the depths of the locked zone and the shallow creep zone, respectively, and d1-d2 represents the thickness of the locked layer, C and S represent the shallow creep rate and the deep slip rate, the dark brown area indicates deep slip, and the double-sided arrow indicates the deep slip direction of the block on the right side of the fault. |
|
(5) |
其中,a表示存在的静态偏移,x表示数据点到断层的垂直距离, sgn是阶跃函数.
使用贝叶斯方法对模型参数进行估计,基于仿射不变集合采样实现马尔可夫链蒙特卡罗方法(Markov Chain Monte Carlo, MCMC)(Goodman and Weare, 2010).在算法实现过程中,每个马尔可夫链的下一次迭代需要从集合中随机选择另外一条马尔可夫链,并且根据walker(预先建立的随机步长集合)位置的任意线性组合确定新的随机点位置,从而运行多个平行的马尔可夫链,以此计算各个参数的后验概率密度函数(Posterior Probability density function, PDF),得到参数的最大后验概率估计值(Maximum a Posteriori, MAP)和不确定度.相对于常用的Metropolis-Hasting和Gibbs采样算法,该算法缩短了收敛时间,提高了计算效率,并具有高效获取大幅不规则概率分布的优点(Foreman-Mackey et al.,2013).
参考前人对鲜水河断裂带炉霍—道孚段的研究结果(表 1),对参数取值范围进行先验约束,并且假定各参数在约束范围内服从高斯分布.由表 1可知,大地测量和地质考察获得的滑动速率差异较大,我们将滑动速率S约束在7 mm·a-1至15 mm·a-1之间,根据95%地震活动分布与深部自由滑动深度之间的经验关系,约束闭锁深度d1小于等于21 km(Smith-Konter at al.,2011;Zhang et al.,2018).相关研究表明,活动断裂带浅层蠕滑最大深度受沉积物覆盖层厚度的限制(Marone et al.,1990;Wei et al.,2013),鲜水河断裂带地震学剖面分析结果显示该断裂沉积物覆盖层厚度在0.5 km至10 km之间变化(Wang et al.,2007),因此约束0≤d2≤10;其余参数满足-7<C<7,-5<a<5(Zhang et al.,2018).同时,约束最大蠕滑深度小于等于震间闭锁深度,即d2≤d1.
|
|
表 1 鲜水河断裂带炉霍—道孚段相关研究结果 Table 1 Related research results of the Luhuo-Daofu section of the Xianshuihe Fault |
以提取的鲜水河断裂带炉霍—道孚段两侧的GPS和InSAR融合速度场数据为约束,对模型参数进行贝叶斯反演分析.在反演过程中,首先在初始值附近构建高斯球,形成100个walker集合,经过300000次迭代产生21000个独立的随机样本,用于获取各个参数在先验区间中的后验概率分布.图 12为式(5)中各个参数的自相关系数变化曲线和概率分布,自相关系数随迭代步长的增加而减小,马尔可夫链完成收敛;除浅层蠕滑深度d2以外,其余参数均近似服从正态分布,基于已有研究成果的先验信息,对d1<21、d2<10的强约束可以保证其余参数反演结果更加可靠,减小参数相关性影响.同时,为了研究断层蠕滑、闭锁状态沿断层走向的差异,增加两个局部剖面AA′和BB′(图 10c).根据图 10c中历史地震破裂区域可知,AA′处最近一次发生的大地震为1973年M7.6地震,BB′处为1981年发生的M6.9地震,增加这两个局部剖面也是为了进一步确定这两次地震的震源区活动特征.

|
图 12 应用MCMC方法反演炉霍—道孚段断层滑动结果 σ为样本集与反演结果之间的数模方差,其余参数见图 11注释,右上插图为马尔可夫链自相关图. Fig. 12 Inversion results of Luhuo-Daofu section using the MCMC method σ is the data-model variance between the sample sets and the inversion results, other parameters are same as Fig. 11, the upper right figure shows the autocorrelation of Markov Chains. |
对炉霍—道孚段、AA′和BB′的剖面反演结果如图 13所示.结果显示该段深部滑动(构造加载)速率约为8.74 mm·a-1,在95%置信区间滑动速率为8.12 mm·a-1至9.30 mm·a-1;浅层蠕滑速率约3.80 mm·a-1,蠕滑运动从地表延伸至深度9.85 km,向下至16.87 km断层闭锁.95%置信区间内,蠕滑深度d2满足7.87≤d2≤9.95,闭锁深度d1满足13.38≤d1≤20.24.假定该段远场构造加载速率一致,在反演两个局部剖面之前,调整先验约束为8.12≤S≤9.30,剖面AA′和BB′的反演结果显示沿断层面走向蠕滑速率和闭锁状态差异较大,AA′蠕滑深度约9.14 km,浅层蠕滑速率约3.18 mm·a-1,BB′蠕滑深度约9.66 km,浅层蠕滑速率约4.35 mm·a-1.AA′蠕滑速率略低于BB′,剖面反演结果与InSAR形变剖面分析获取的地表蠕滑速率变化一致(图 5).BB′闭锁深度约17.14 km,闭锁区域达到7.48 km,略高于整段反演结果,AA′闭锁范围为9.14 km至11.97 km,存在厚度约3 km的闭锁层,远小于BB′反映出的断层面闭锁区域,从AA′至BB′表现出闭锁增强的特征.

|
图 13 InSAR和GPS速度场剖面数据分布和位错模型反演结果图中黑色实线为模型速度. Fig. 13 Data distributuion of velocity profiles and modelled fault-parallel velocities by the screw dislocation model The black solid line shows the modelled velocities. |
随着多个SAR卫星的发射升空和GPS测站的不断增加,获取高时空分辨率的地壳形变场成为可能,联合InSAR和GPS已逐渐成为研究断裂带形变的主要手段.相对于InSAR而言,GPS台站分布稀疏,在进行速度场融合时,一般将GPS点位速率转换至LOS向,参考每个台站附近的InSAR数据去除GPS参考框架影响,与常规方法相比,本文提出的数据融合思路具有如下优势:使用InSAR数据去除GPS参考框架影响过程中,当存在原始GPS测站或相应的局部InSAR数据误差较大时,使用Gaussian/Voronoi细胞加权函数预插值处理,减小了该部分数据的权重,并且为实现CBB抽样统计提供充分的样本量,同时考虑样本具有的空间相关性,可获得可靠的参数估计值.连续覆盖的InSAR形变场较GPS捕获到更多的形变细节信息,去除GPS参考框架影响后,我们使用bootstrap方法统计了两组数据存在的差异,并将该值作为反映形变场细节特征的参量.地表形变是断裂带震间运动特征的体现,主要由远场构造加载和近断层浅层蠕滑造成,相较于常规方法,本文分开考虑近场和远场的局部形变信息,分别采用自适应四叉树和均值采样算法合理取舍GPS和InSAR数据,能够针对性地提取断裂带震间活动的形变信息.
5.2 与已有断层滑动速率结果的对比本文联合InSAR和GPS速度场的MCMC反演结果,显示出鲜水河断裂带炉霍—道孚段滑动速率为8.12~9.30 mm·a-1,与前人利用GPS、InSAR等大地测量手段和地质考察、地震矩张量反演得到的结果大致相近(表 1),存在的差别主要由不同的数据源、数据时间跨度、反演模型等因素造成.基于野外实地调查、断错地貌面高精度测量得到鲜水河北西段全新世左旋走滑速率为~15 mm·a-1(Allen et al., 1991;徐锡伟等,2003),相对于大地测量手段获得的滑动速率偏高,主要是因为其反映长期构造运动特征,而大地测量反映的是断层近期运动特征.Shen等(2005)、王阎昭等(2008)使用时间跨度相近的GPS数据分别使用剖面投影和连接断层元方法拟合鲜水河断裂北西段走滑速率,分别为10±2 mm·a-1和15.7±1.4 mm·a-1,结果相差~6 mm·a-1,多源大地测量数据联合反演结果显示该段滑动速率为9~12 mm·a-1(Wang et al., 2009),与本文结果和Shen等(2005)结果相当,明显小于王阎昭等(2008)研究结果,推测由于GPS台站数目稀疏导致使用连接断层元方法引入较大的偏差.另外,本文基于InSAR速度场等间距剖面分析,发现炉霍—道孚段蠕滑特征明显.建立包括浅层蠕滑层、中间闭锁层和深部滑动层的断层滑动模型(图 11),并联合InSAR和GPS数据反演该段滑动速率,反演结果为~8.74 mm·a-1,而目前的大地测量研究成果多数并未考虑该段浅层蠕滑效应(Shen et al.,2005;Wang et al.,2009),这可能是本文给出的滑动速率最优解略小于前人结果的原因.
5.3 炉霍—道孚段蠕滑特征和成因分析自Allen等(1991)发现鲜水河断裂带炉霍—道孚段存在浅层蠕滑以来,已有一系列基于蠕变仪、短基线观测数据的相关研究成果发表(杜方等,2010;刘冠中等,2013;Zhang et al.,2018),但尚缺乏高空间分辨率大地测量数据约束的系统性研究.浅层蠕滑在InSAR干涉图中表现为断层地表迹线两侧的不连续性,即速度场跨断层偏移量近似为断层蠕滑速率,InSAR提供的高空间分辨率速度场可为研究蠕滑沿断层走向的变化特征提供充分的数据源.本文基于InSAR形变场分析结果表明,炉霍—道孚段地表蠕滑速率沿走向存在明显差异,自炉霍至道孚表现出速率增大、减小、再次增大的变化特征,根据InSAR成像几何关系将10 km跨断层长度(单侧)得到的LOS向蠕滑速率转换至平行断层方向(图 14),左旋蠕滑速率大致分布于1.0~5.2 mm·a-1,与Zhang等(2018)利用跨断层水准、短基线资料得到的结果存在部分差异.从格篓至虾拉沱,跨断层资料与InSAR结果均表明该段落蠕滑速率增加,格篓和墟虚处跨断层资料得到的蠕滑速率略低于InSAR结果,李铁明等(2019)基于探槽资料、强震活动背景推测两处站点只跨过分支断裂,并未跨过主断裂,而InSAR获取的高空间分辨率速度场能提供更充分的跨断层形变差异信息,从而得到更为合理的蠕滑速率;从虾拉沱至道孚,跨断层资料呈现出速率减小特征,而InSAR结果表明该段落仍处于高速蠕滑状态,与Jiang等(2015)研究结果一致,且InSAR结果表明沟普北西侧出现明显的蠕滑速率增加、至道孚南东侧速率再次减小的变化特征,与1981年道孚地震地表同震破裂相对应,推测是道孚地震的震后影响.

|
图 14 InSAR和跨断层资料得到的左旋蠕滑速率 暗青色、黄绿色、橄榄色区域分别表示1973年M7.6地震、1923年M7.3地震和1981年M6.9地震同震滑动量,黑色实线和虚线分别表示跨断层资料和InSAR得到的地表左旋蠕滑速率,虚线两侧灰色区域对应95%置信区间分布,蓝色误差棒代表MCMC反演结果,历史强震同震滑动量参考闻学泽(1995)、李天祒等(1997)和Papadimitriou等(2004). Fig. 14 Sinistral creep rate obtained from InSAR and fault-crossing surveys Dark cyan, yellow-green, and olive areas indicate the coseismic slip of the 1973 M7.6 earthquake, the 1923 M7.3 earthquake and the 1981 M6.9 earthquake, respectively. The black solid line and the dotted line represent the sinistral creep rate obtained by fault-crossing surveys and InSAR data, respectively. The gray area on both sides of the dotted line corresponds to the 95% confidence interval distribution, and the blue error bar represents the MCMC inversion result. Coseismic slip of historic strong earthquakes refer to Wen (1995), Li et al. (1997) and Papadimitriou et al. (2004). |
以InSAR和GPS融合速度场为约束的位错模型反演结果显示出炉霍—道孚段浅层蠕滑深度达7.87~9.95 km,浅层蠕滑速率为3.27~4.18 mm·a-1,其中AA′和BB′剖面反演得到的蠕滑速率为3.18(2.10~4.41,95%置信区间(c.i.))mm·a-1和4.35(3.53~4.94,95% c.i.)mm·a-1;蠕滑深度略大于跨断层资料结果(Zhang et al.,2018),但与建立观测方程(式(1))得到的蠕滑速率基本一致(图 14).
炉霍—道孚段历史强震频发,沿该段落最近发生的地震分别为1973年M7.6地震、1923年M7.3地震和1981年M6.9地震,其中1923年M7.3地震和1981年M6.9地震同震滑动量与断层蠕滑速率表现出较好的一致性(图 14).有研究认为长时间蠕滑运动(10~100年)是断层发生强震后的一种特殊余滑形式,受到下地壳和上地幔或者更深处的松弛作用持续影响(akir et al.,2005,2012;Hearn et al.,2009).但Hussain等(2016)对强震形成的蠕滑运动的时间序列分析发现,蠕滑速率符合震后余滑的时间衰减定律,不能达到近百年时间尺度上的持续高速滑动,并且如果以衰减定律向前推算,震后一段时间内的蠕滑速率将会远大于断层深部滑动速率,与实际情况不符合(Harris,2017).Bilham等(2016)对1944年发生在土耳其北安那托利亚断层的M7.4地震的震后影响进行研究,发现该断层绝大多数段落的现今蠕滑运动主要受构造加载驱动,即历史强震会造成一定影响,但并不是造成持续性蠕滑运动的主要原因.
影响断层蠕滑运动的物理因素包括温度、孔隙流体压力和矿物岩石类型(Avouac,2015).在地震破裂的初始阶段,断层面快速摩擦升温,孔隙流体压力迅速上升(Tanikawa and Shimamoto, 2009).但同震摩擦升温只会持续较短时间,且震后阶段断层逐渐愈合,孔隙流体压力再次回升(Kato et al.,2003;Giger et al.,2007),1923年M7.3地震距今已近百年,几乎不存在震后影响,但破裂区断层蠕滑速率仍与同震滑动量呈现出一致性,且该地区上地幔、下地壳流体上涌以及地壳高度破裂的相关研究表明历史强震有可能对断层蠕滑运动产生间接影响(王琼等,2015;Hu and Wang, 2018;刘冠男等,2020),如同震破裂造成断层浅部脆性区域大量裂缝开启,为流体上涌提供较为顺畅的通道,震后以及震间持续的水-岩反应导致矿物蚀变分解,在浅层同震滑动区形成摩擦系数较低的黏土矿物,从而促进浅层蠕滑运动.而对于发震时间距今更短的1973年炉霍地震而言,其破裂区断层蠕滑速率与同震滑动量并没有明显的对应关系.因此历史强震是否对炉霍—道孚段蠕滑运动产生长期促进作用还需进一步研究.
目前众多关于圣安德烈斯、海沃德等断层蠕滑段岩石采样分析研究发现,蛇绿岩中的矿物滑石能够大大降低断层的剪切强度,从而使断层稳定滑动,并且这种特殊摩擦属性可存在于地表至10 km以下深度(Louderback,1942;Moore and Rymer, 2007;Harris,2017).地质调查研究发现炉霍—道孚段也存在蛇绿岩分布,空间上受控于炉霍—道孚构造带(张宽忠等,2008),蛇绿岩的存在降低了该段断层浅部的岩石摩擦系数,使炉霍—道孚段发生稳定蠕滑.而由于鲜水河断裂带尚未进行大地热流测量工作,炉霍—道孚段热参数与其他段落存在的差别尚无法讨论(姜光政等,2016).
5.4 炉霍—道孚段闭锁状态和地震危险性分析对鲜水河断裂带闭锁深度的研究多数并未考虑浅层蠕滑的影响,并且差别较大.如王阎昭等(2008)绘制断层锁定深度和GPS拟合残差之间的关系曲线,确定70%置信区间内闭锁深度为11~19 km.Wang等(2009)使用蒙特卡罗方法估计鲜水河北西段震间闭锁深度为3~6 km.本文基于反向滑动理论建立并扣除与构造运动方向相反的滑动量以表示断层浅部蠕滑运动,利用MCMC方法进行反演,结果显示炉霍—道孚段平均闭锁深度为13.38~20.24 km,闭锁区域厚度为3.5~10.4 km.如图 15所示,1973年M7.6炉霍地震的AA′剖面闭锁深度为11.97(8.81~16.78,95% c.i.)km,1981年M6.9道孚地震的BB′剖面闭锁深度为17.14(13.10~19.85,95% c.i.)km,该段南东侧闭锁程度明显高于北西侧,且南东侧闭锁层厚度~7.5 km,与区域跨断层资料分析结果一致(Zhang et al.,2018).

|
图 15 断层运动参数和地震分布 图中蓝色曲线表示地表左旋蠕滑速率,灰色矩形面表示断层面,圆点表示近十年发生的地震,红色五角星位置表示2011年4月10日MW5.4地震震源,粉色虚线表示浅层蠕滑深度,断层面上两个渐变色矩形框表示闭锁深部在95%置信区间的分布,颜色最深处(褐色)代表反演得到的最优解,红色虚线框为最优解表示的闭锁区. Fig. 15 Fault motion parameters and earthquake distribution The blue curve represents the surface sinistral creep rate, the gray rectangle represents the fault plane, the dots represent the earthquakes that occurred in the past ten years, the red pentagram represents the focal source of the MW5.4 earthquake on April 10, 2011, and the pink dotted line represents the shallow creep depth, the two gradient color rectangles on the fault plane represent the distribution of the locked depth within 95% confidence interval, and the brown color represents the optimal solution for the inversion, the red dashed box is the locked area corresponding to the optimal solution. |
本文基于螺旋位错模型的反演结果表明,该段北西侧存在厚度~3 km的闭锁层(图 15),并不具备发生~M7地震的能力,这与1973年发生M7.6地震的实际情况不一致,推测由于炉霍段断层面在1973年地震后摩擦状态改变造成,同时也有可能该段目前仍处于炉霍地震的震后阶段.由近十年的地震震源分布可见,该闭锁区域在2011年发生了一次M5.4地震,并且近十年震源分布不存在明显无震区,我们分析可能是使用了震前13年的GPS数据所引入的偏差.因此我们单独使用AA′剖面的InSAR数据反演该段断层参数,得到蠕滑深度~9.18 km,闭锁深度~10.45 km,闭锁区域厚度仅~1 km,表明目前该段不具备产生中等地震的潜势.
断层面近十年来的地震震源分布具有明显差异,北西侧近似均匀分布,主要由断层面上不规则分布的小型凹凸体形成;而南东侧分布较为集中且存在部分无震区域,多数为1981年道孚地震的余震(蒋长胜等,2014;Zhang et al.,2018).根据远场构造加载速率S和断层面滑动速率C计算炉霍—道孚段浅层平均闭锁系数(Inter-Seismic Coupling,
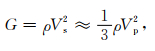
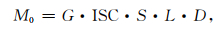
Wang等(2009)基于强震破裂尺度与滑动量之间的经验关系估算1973年炉霍地震和1981年道孚地震滑动量分别为~2 m和~1 m,利用ERS/Envisat和GPS联合反演的滑动速率计算炉霍和道孚地震复发间隔分别为166~200年和83~110年.Shan等(2013)对前人成果总结认为,1973年炉霍地震和1981年道孚地震滑动量分别是~3.35 m和~0.55 m,我们结合AA′和BB′的剖面反演滑动速率,估计两处地震复发周期分别为370~410年和59~65年,发现短期内炉霍段地震危险性较低,而道孚段则明显偏高.由于道孚段存在明显的浅层蠕滑区,可以通过无震滑移的方式释放部分应变能,为了定量研究该段落近年来产生的能量积累,我们基于CRUST1.0(https://igppweb.ucsd.edu/~gabi/crust1.html)地壳分层模型,根据式(8)计算该地区地壳剪切模量G约为21 GPa,并依此计算地震矩积累量.
|
(8) |
|
(9) |
式中,G为剪切模量,ρ为密度,Vs和Vp分别是S波和P波速度.M0为地震矩积累率,L和D分别是断层的长度和深度,ISC表示断层闭锁系数,S表示构造加载速率.
BB′剖面反演结果表明,道孚段蠕滑深度~9.66 km,浅层蠕滑速率~4.35 mm·a-1,远场构造加载速率为9.22(8.38~9.27,95% c.i.)mm·a-1,对应闭锁深度为17.14(13.09~19.85,95% c.i.)km.假设~15 km的无震区域(图 15)沿断层走向运动特征一致,则根据式(9)可计算该段远场构造加载能量为3.46×10¹⁶至5.80×10¹⁶ Nm·a-1,地震矩积累率为9.05×10¹⁵至1.97×10¹⁶ Nm·a-1;蠕滑运动释放的能量为~1.32×10¹⁶ Nm·a-1,占构造加载能量的23%~38%(Aki and Richards, 2002).以1981年道孚M6.9地震为上次能量集中释放时间,距今为止能量积累的总时间为40年,则闭锁区的地震矩积累量达到3.62×10¹⁷~7.88×10¹⁷ Nm,相当于一个MW5.6~MW5.9地震所释放的能量(Hanks and Kanamori, 1979),因此道孚段近期的地震危险性值得关注.
6 结论本文利用永久散射体方法对Sentinel-1A数据进行时序处理,研究了鲜水河断裂带炉霍—道孚段地表蠕滑特征,并提出了一种适用于InSAR和GPS震间速度场的数据融合方法,将GPS插值为连续形变场,借助InSAR速度场去除GPS参考框架影响后,综合考虑近断层细节形变和远场构造运动,对InSAR和GPS速度场进行融合.同时,基于MCMC算法反演了鲜水河断裂带炉霍—道孚段蠕滑速率和闭锁状态,并分析其地震危险性.主要认识如下:
(1) 基于InSAR观测数据分析揭示出炉霍—道孚段具有明显的蠕滑特征,且沿断层走向存在差异,道孚段蠕滑速率明显高于炉霍段,具体表现为从北西至南东蠕滑速率逐渐增大、减少、再次增大的特征.不同的跨断层距离得到的地表LOS向蠕滑速率差异较小,为0~1.0 mm·a-1,速率整体分布在0.3~3.5 mm·a-1之间,其中10 km跨断层距离分析结果对应的左旋蠕滑速率为1.0~5.2 mm·a-1.
(2) 强震造成的蠕滑运动满足震后余滑衰减规律,而长时间蠕滑运动主要受构造加载驱动,炉霍—道孚段部分区域现今地表蠕滑速率与强震同震滑动量之间表现出对应关系,1981年道孚地震同震破裂区可能存在震后影响,而1923年M7.3地震是否对该区域现今蠕滑运动产生影响还需进一步研究.
(3) 基于MCMC算法的螺旋位错模型反演结果表明,鲜水河断裂带炉霍—道孚段深部滑动速率在95%置信水平为8.12~9.30 mm·a-1,与前人研究成果相近,浅层蠕滑深度为~9.8 km,蠕滑速率为3.27~4.18 mm·a-1,北西侧和南东侧剖面浅层蠕滑速率分别为3.18(2.10~4.41,95% c.i.)mm·a-1和4.35(3.53~4.94,95% c.i.)mm·a-1,与建立观测方程(式(1))得到的蠕滑速率基本一致.
(4) 闭锁深度反演结果显示炉霍—道孚段南东侧存在厚度~7.5 km的闭锁层,说明道孚段在1981年M6.9地震后已经开始积累弹性应变;而北西侧闭锁区较小,1973年M7.6地震后发生的小震主要是断层面不规则分布的小型凹凸体形成,并未开始积累产生中等地震的能量.
(5) 基于1973年炉霍地震和1981年道孚地震的滑动量和本文剖面反演得到的远场构造加载速率,计算炉霍和道孚地震复发周期分别为370~410年和59~65年,其中道孚段距上次地震时间已有40年,接近地震复发周期,~15 km无震区域的浅层蠕滑运动每年释放的能量~1.32×10¹⁶ Nm,占构造加载能量的23%~38%,40年地震矩积累量达3.62×10¹⁷至7.88×10¹⁷ Nm,相当于一个MW5.6~MW5.9地震所释放的能量,具有发生显著性地震的可能性,因此道孚段近期地震危险性较高.
致谢 本文使用欧洲空间局(ESA)提供的Sentinel-1A卫星数据,Caltech/Stanford发布的ISCE开源SAR处理平台,文中多数图件利用GMT软件绘制,三位审稿专家提出了宝贵的修改意见,在此一并致谢.
Aki K, Richards P G. 2002. Quantitative Seismology. Sausalito, CA. USA: University Science Books.
|
Allen C R, Luo Z L, Qian H, et al. 1991. Field study of a highly active fault zone: the Xianshuihe fault of southwestern China. GSA Bulletin, 103(9): 1178-1199. DOI:10.1130/0016-7606(1991)103<1178:FSOAHA>2.3.CO;2 |
Avouac J P. 2015. From geodetic imaging of seismic and aseismic fault slip to dynamic modeling of the seismic cycle. Annual Review of Earth and Planetary Sciences, 43: 233-271. DOI:10.1146/annurev-earth-060614-105302 |
Bürgmann R, Fielding E, Sukhatme J. 1998. Slip along the Hayward fault, California, estimated from space-based synthetic aperture radar interferometry. Geology, 26(6): 559-562. DOI:10.1130/0091-7613(1998)026<0559:SATHFC>2.3.CO;2 |
Bilham R, Ozener H, Mencin D, et al. 2016. Surface creep on the North Anatolian Fault at Ismetpasa, Turkey, 1944—2016. Journal of Geophysical Research: Solid Earth, 121(10): 7409-7431. DOI:10.1002/2016JB013394 |
Bock Y, Melgar D. 2016. Physical applications of GPS geodesy: A review. Reports on Progress in Physics, 79(10): 106801. DOI:10.1088/0034-4885/79/10/106801 |
akir Z, Akoglu A M, Belabbes S, et al. 2005. Creeping along the Ismetpasa section of the North Anatolian fault (Western Turkey): Rate and extent from InSAR. Earth and Planetary Science Letters, 238(1-2): 225-234. DOI:10.1016/j.epsl.2005.06.044 |
akir Z, Ergintav S, zener H, et al. 2012. Onset of aseismic creep on major strike-slip faults. Geology, 40(12): 1115-1118. DOI:10.1130/G33522.1 |
Du F, Wen X Z, Zhang P Z. 2010. Post-seismic slip and deformation on the Luhuo segment of the Xianshuihe fault zone. Chinese Journal of Geophysics (in Chinese), 53(10): 2355-2366. |
Efron B, Tibshirani R. 1986. Bootstrap methods for standard errors, confidence intervals, and other measures of statistical accuracy. Statistical Science, 1(1): 54-75. |
Fattahi H, Simons M, Agram P. 2017. InSAR time-series estimation of the ionospheric phase delay: an extension of the split range-spectrum technique. IEEE Transactions on Geoscience and Remote Sensing, 55(10): 5984-5996. DOI:10.1109/TGRS.2017.2718566 |
Ferretti A, Prati C, Rocca F. 2001. Permanent scatterers in SAR interferometry. IEEE Transactions on Geoscience and Remote Sensing, 39(1): 8-20. DOI:10.1109/36.898661 |
Foreman-Mackey D, Hogg D W, Lang D, et al. 2013. EMCEE: The MCMC hammer. Publications of the Astronomical Society of the Pacific, 125(925): 306-312. DOI:10.1086/670067 |
Giger S B, Tenthorey E, Cox S F, et al. 2007. Permeability evolution in quartz fault gouges under hydrothermal conditions. Journal of Geophysical Research: Solid Earth, 112(B7): B07202. DOI:10.1029/2006JB004828 |
Goodman J, Weare J. 2010. Ensemble samplers with affine invariance. Communications in Applied Mathematics and Computational Science, 5(1): 65-80. DOI:10.2140/camcos.2010.5.65 |
Hanks T C, Kanamori H. 1979. A moment magnitude scale. Journal of Geophysical Research: Solid Earth, 84(B5): 2348-2350. DOI:10.1029/JB084iB05p02348 |
Harris R A. 2017. Large earthquakes and creeping faults. Reviews of Geophysics, 55(1): 169-198. DOI:10.1002/2016RG000539 |
Hearn E H, Mcclusky S, Ergintav S, et al. 2009. Izmit earthquake postseismic deformation and dynamics of the North Anatolian Fault Zone. Journal of Geophysical Research: Solid Earth, 114(B8): B08405. DOI:10.1029/2008JB006026 |
Hooper A, Bekaert D, Spaans K, et al. 2012. Recent advances in SAR interferometry time series analysis for measuring crustal deformation. Tectonophysics, 514-517: 1-13. DOI:10.1016/j.tecto.2011.10.013 |
Hu Y P, Wang Z. 2018. Plate interactions, crustal deformation and magmatism along the eastern margins of the Tibetan Plateau. Tectonophysics, 740-741: 10-26. DOI:10.1016/j.tecto.2018.05.011 |
Hussain E, Wright T J, Walters R J, et al. 2016. Geodetic observations of postseismic creep in the decade after the 1999 Izmit earthquake, Turkey: implications for a shallow slip deficit. Journal of Geophysical Research, 121(4): 2980-3001. DOI:10.1002/2015JB012737 |
Ji L Y, Zhang W T, Liu C J, et al. 2020. Characterizing interseismic deformation of the Xianshuihe fault, eastern Tibetan Plateau, using Sentinel-1 SAR images. Advances in Space Research, 66(2): 378-394. DOI:10.1016/j.asr.2020.03.043 |
Jiang C S, Fang L H, Han L B, et al. 2014. Study on seismological methods to identify active-fault segments with mid- and long-term risk of major earthquakes (in Chinese). A Final Technique Report of the Project No. 03 of National Key Technology Research and Development Program, No. 2012BAK19B01. China Earthquake Administration.
|
Jiang G Y, Xu X W, Chen G H, et al. 2015. Geodetic imaging of potential seismogenic asperities on the Xianshuihe-Anninghe-Zemuhe fault system, southwest China, with a new 3-D viscoelastic interseismic coupling model. Journal of Geophysical Research, 120(3): 1855-1873. DOI:10.1002/2014JB011492 |
Jiang G Z, Gao P, Rao S, et al. 2016. Compilation of heat flow data in the continental area of China (4th edition). Chinese Journal of Geophysics (in Chinese), 59(8): 2892-2910. |
Jolivet R, Lasserre C, Doin M P, et al. 2012. Shallow creep on the Haiyuan Fault (Gansu, China) revealed by SAR Interferometry. Journal of Geophysical Research: Solid Earth, 117(B6): B06401. DOI:10.1029/2011JB008732 |
Jonsson S. 2002. Fault slip distribution of the 1999 MW7.1 Hector mine, California, earthquake, estimated from satellite radar and GPS measurements.. Bulletin of the Seismological Society of America, 92(4): 1377-1389. DOI:10.1785/0120000922 |
Kato A, Sakaguchi A, Yoshida S, et al. 2003. Permeability measurements and precipitation sealing of basalt in an ancient exhumed subduction-zone fault. Bulletin of Earthquake Research Institute, 78: 83-89. |
Li T M, Zhu Y Q, Yang Y L, et al. 2019. The current slip rate of the Xianshuihe fault zone calculated using multiple observational data of crustal deformation. Chinese Journal of Geophysics (in Chinese), 62(4): 1323-1335. |
Li T T, Du Q F, You Z L, et al. 1997. Xianshuihe Active Fault Zone and Evaluation of Risk for Strong Earthquakes (in Chinese). Chengdu: Chengdu Cartographic Publishing House.
|
Liu G N, Wang Z. 2020. Correlations of the deep structural characteristics, tidal stress variation and earthquake initiation along the Xianshuihe-Anninghe fault zone. Chinese Journal of Geophysics (in Chinese), 63(3): 928-943. |
Liu G Z, Ma J, Zhang H X, et al. 2013. Study on activity features of Xianshuihe fault zone with fault creep and short baseline observation for the last 20 years. Chinese Journal of Geophysics (in Chinese), 56(3): 878-891. |
Louderback G D. 1942. Faults and earthquakes. Bulletin of the Seismological Society of America, 32(4): 305-330. DOI:10.1785/BSSA0320040305 |
Marone C, Raleigh C B, Scholz C H. 1990. Frictional behavior and constitutive modeling of simulated fault gouge. Journal of Geophysical Research: Solid Earth, 95(B5): 7007-7025. DOI:10.1029/JB095iB05p07007 |
Maurer J, Johnson K. 2014. Fault coupling and potential for earthquakes on the creeping section of the central San Andreas Fault. Journal of Geophysical Research: Solid Earth, 119(5): 4414-4428. DOI:10.1002/2013JB010741 |
Moore D E, Rymer M J. 2007. Talc-bearing serpentinite and the creeping section of the San Andreas fault. Nature, 448(7155): 795-797. DOI:10.1038/nature06064 |
Papadimitriou E, Wen X Z, Karakostas V, et al. 2004. Earthquake triggering along the Xianshuihe fault zone of western Sichuan, China. Pure and Applied Geophysics, 161(8): 1683-1707. DOI:10.1007/s00024-003-2471-4 |
Politis D N, Romano J P, Lai T L. 1992. Bootstrap confidence bands for spectra and cross-spectra. IEEE Transactions on Signal Processing, 40(5): 1206-1215. DOI:10.1109/78.134482 |
Reid H F. 1911. The elastic-rebound theory of earthquakes. University of California Department of Geology Bulletin, 6(19): 413-444. |
Rosen P, Werner C, Fielding E, et al. 1998. Aseismic creep along the San Andreas Fault northwest of Parkfield, CA measured by radar interferometry. Geophysical Research Letters, 25(6): 825-828. DOI:10.1029/98GL50495 |
Rosen P A, Gurrola E, Sacco G F, et al. 2012. The InSAR scientific computing environment. //EUSAR 2012; 9th European Conference on Synthetic Aperture Radar.. Nuremberg, Germany: VDE.. |
Salvi S, Stramondo S, Funning G J, et al. 2012. The Sentinel-1 mission for the improvement of the scientific understanding and the operational monitoring of the seismic cycle. Remote Sensing of Environment, 120: 164-174. DOI:10.1016/j.rse.2011.09.029 |
Savage J C, Burford R O. 1973. Geodetic determination of relative plate motion in central California. Journal of Geophysical Research, 78(5): 832-845. DOI:10.1029/JB078i005p00832 |
Savage J C. 1983. A dislocation model of strain accumulation and release at a subduction zone. Journal of Geophysical Research: Solid Earth, 88(B6): 4984-4996. DOI:10.1029/JB088iB06p04984 |
Scheiber R, Moreira A. 2000. Coregistration of interferometric SAR images using spectral diversity. IEEE Transactions on Geoscience and Remote Sensing, 38(5): 2179-2191. DOI:10.1109/36.868876 |
Shan B, Xiong X, Wang R J, et al. 2013. Coulomb stress evolution along Xianshuihe-Xiaojiang Fault System since 1713 and its interaction with Wenchuan earthquake, May 12, 2008. Earth and Planetary Science Letters, 377-378: 199-210. DOI:10.1016/j.epsl.2013.06.044 |
Shen Z K, Lyu J M, Wang M, et al. 2005. Contemporary crustal deformation around the southeast borderland of the Tibetan Plateau. Journal of Geophysical Research: Solid Earth, 110(B11): B11409. DOI:10.1029/2004JB003421 |
Shen Z K, Wang M, Zeng Y H, et al. 2015. Optimal interpolation of spatially discretized geodetic data. Bulletin of the Seismological Society of America, 105(4): 2117-2127. DOI:10.1785/0120140247 |
Smith-Konter B R, Sandwell D T, Shearer P. 2011. Locking depths estimated from geodesy and seismology along the San Andreas fault system: implications for seismic moment release. Journal of Geophysical Research: Solid Earth, 116(B6): B06401. DOI:10.1029/2010JB008117 |
Sun J Z, Shi S Y, Zhou S Y, et al. 1994. Inversion of the present kinematic characteristics of Xianshuihe fault zone from seismic moment tensor. Crustal Deformation and Earthquake (in Chinese), 14(4): 9-15. |
Tanikawa W, Shimamoto T. 2009. Frictional and transport properties of the Chelungpu fault from shallow borehole data and their correlation with seismic behavior during the 1999 Chi-Chi earthquake. Journal of Geophysical Research: Solid Earth, 114(B1): B01402. DOI:10.1029/2008JB005750 |
Thomas M Y, Avouac J P, Champenois J, et al. 2014. Spatiotemporal evolution of seismic and aseismic slip on the Longitudinal Valley Fault, Taiwan. Journal of Geophysical Research: Solid Earth, 119(6): 5114-5139. DOI:10.1002/2013JB010603 |
Tymofyeyeva E, Fialko Y, Jiang J L, et al. 2019. Slow slip event on the southern San Andreas fault triggered by the 2017 MW8.2 Chiapas (Mexico) earthquake.. Journal of Geophysical Research: Solid Earth, 124(9): 9956-9975. DOI:10.1029/2018JB016765 |
Wang C Y, Han W B, Wu J P, et al. 2007. Crustal structure beneath the eastern margin of the Tibetan Plateau and its tectonic implications. Journal of Geophysical Research: Solid Earth, 112(B7): B07307. DOI:10.1029/2005JB003873 |
Wang H, Wright T J, Biggs J. 2009. Interseismic slip rate of the northwestern Xianshuihe fault from InSAR data. Geophysical Research Letters, 36(3): L03302. DOI:10.1029/2008GL036560 |
Wang M, Shen Z K. 2020. Present-day crustal deformation of continental China derived from GPS and its tectonic implications. Journal of Geophysical Research: Solid Earth, 125(2): e2019JB018774. DOI:10.1029/2019JB018774 |
Wang Q, Gao Y, Shi Y T. 2015. Rayleigh wave azimuthal anisotropy on the southeastern front of the Tibetan Plateau from seismic ambient noise. Chinese Journal of Geophysics (in Chinese), 58(11): 4068-4078. |
Wang Y Z, Wang E N, Shen Z K, et al. 2008. GPS-constrained inversion of present-day slip rates along major faults of the Sichuan-Yunnan region, China. Science in China Series D: Earth Sciences, 51(9): 1267-1283. DOI:10.1007/s11430-008-0106-4 |
Weertman J, Weertman J R. 1964. Elementary Dislocation Theory. New York: The Macmillan Company.
|
Wei M, Kaneko Y, Liu Y J, et al. 2013. Episodic fault creep events in California controlled by shallow frictional heterogeneity. Nature Geoscience, 6(7): 566-570. DOI:10.1038/ngeo1835 |
Wen X Z. 1995. Quantitative Estimates of Seismic Potential on Active Faults (in Chinese). Beijing: Seismological Press.
|
Wen X Z, Ma S L, Xu X W, et al. 2008. Historical pattern and behavior of earthquake ruptures along the eastern boundary of the Sichuan-Yunnan faulted-block, southwestern China. Physics of the Earth and Planetary Interiors, 168(1-2): 16-36. DOI:10.1016/j.pepi.2008.04.013 |
Xu X W, Wen X Z, Zheng R Z, et al. 2003. Pattern of latest tectonic motion and its dynamics for active blocks in Sichuan-Yunnan region, China. Science in China Series D: Earth Sciences, 46(S2): 210-226. DOI:10.1360/03dz0017 |
Zhang J, Wen X Z, Cao J L, et al. 2018. Surface creep and slip-behavior segmentation along the northwestern Xianshuihe fault zone of southwestern China determined from decades of fault-crossing short-baseline and short-level surveys. Tectonophysics, 722: 356-372. DOI:10.1016/j.tecto.2017.11.002 |
Zhang K Z, Li Z J, Huang C, et al. 2008. Discovery and significance of the Luhuo-Dawu ophiolites in western Sichuan. Sedimentary Geology and Tethyan Geology (in Chinese), 28(4): 106-110. |
Zhang P Z, Deng Q D, Zhang G M, et al. 2003. Active tectonic blocks and strong earthquakes in the continent of China. Science in China Series D: Earth Sciences, 46(S2): 13-24. |
杜方, 闻学泽, 张培震. 2010. 鲜水河断裂带炉霍段的震后滑动与形变. 地球物理学报, 53(10): 2355-2366. DOI:10.3969/j.issn.0001-5733.2010.10.009 |
蒋长胜, 房立华, 韩立波等. 2014.大地震中长期活动断裂危险段落判定方法研究专题编号2012BAK19B01-03.中国地震局.
|
姜光政, 高堋, 饶松, 等. 2016. 中国大陆地区大地热流数据汇编(第四版). 地球物理学报, 59(8): 2892-2910. DOI:10.6038/cjg20160815 |
李天祒, 杜其方, 游泽李, 等. 1997. 鲜水河活动断裂带及强震危险性评估. 成都: 成都地图出版社.
|
李铁明, 祝意青, 杨永林, 等. 2019. 综合利用多种地壳形变观测资料计算鲜水河断裂带现今滑动速率. 地球物理学报, 62(4): 1323-1335. DOI:10.6038/cjg2019L0723 |
刘冠男, 王志. 2020. 鲜水河—安宁河断裂带深部构造特征、固体潮应力变化与地震触发相关性研究. 地球物理学报, 63(3): 928-943. DOI:10.6038/cjg2020N0206 |
刘冠中, 马瑾, 张鸿旭, 等. 2013. 二十年来蠕变和短基线观测反映的鲜水河断裂带活动特征. 地球物理学报, 56(3): 878-891. DOI:10.6038/cjg20130317 |
孙建中, 施顺英, 周硕愚, 等. 1994. 利用地震矩张量反演鲜水河断裂带现今运动学特征. 地壳形变与地震, 14(4): 9-15. |
王琼, 高原, 石玉涛. 2015. 青藏高原东南缘基于背景噪声的Rayleigh面波方位各向异性研究. 地球物理学报, 58(11): 4068-4078. |
王阎昭, 王恩宁, 沈正康, 等. 2008. 基于GPS资料约束反演川滇地区主要断裂现今活动速率. 中国科学D辑:地球科学, 38(5): 582-597. DOI:10.3321/j.issn:1006-9267.2008.05.006 |
闻学泽. 1995. 活动断裂地震潜势的定量评估. 北京: 地震出版社.
|
徐锡伟, 闻学泽, 郑荣章, 等. 2003. 川滇地区活动块体最新构造变动样式及其动力来源. 中国科学(D辑), 33(S1): 151-162. |
张宽忠, 李振江, 黄成, 等. 2008. 炉霍—道孚蛇绿岩的发现及其意义. 沉积与特提斯地质, 28(4): 106-110. |
张培震, 邓起东, 张国民, 等. 2003. 中国大陆的强震活动与活动地块. 中国科学(D辑), 33(S1): 12-20. |