 2020, Vol. 63


2. 自然资源部构造成矿成藏重点实验室, 成都理工大学, 成都 610059
2. Ministry of Natural Resources Key Laboratory of Structural Mineralization and Reservoir Formation, Chengdu University of Technology, Chengdu 610059, China
作为地壳热量输出的主要方式,洋中脊热液对流系统的热输出量可占全球地壳热量输出的~25%(Stein and Stein, 1994),同时也是地球化学循环的重要驱动方式(Elderfield and Schultz, 1996).在洋中脊扩张中心,海水向下渗透至洋壳,在岩浆熔体等热源的加热和驱动下与围岩发生热化学反应并上涌形成烟囱体及热液矿产.
洋壳渗透率在一定程度上决定了热液上涌的流速和有效对流通道的位置(Driesner, 2010; Andersen et al., 2015).虽然其空间分布目前来说仍知之甚少,但通过岩心和洋底温度、热流分布的测量可间接获得局部的渗透率数值(Wilcock and Fisher, 2004; Lowell et al., 2013; Barreyre et al., 2018).构造伸展作用导致了洋壳的破裂和蚀变,使洋壳渗透率分布发生变化,其中,伸展断裂带常表现出异常高的渗透率,使其更倾向于作为热液对流主要通道(McCaig et al., 2007; Andersen et al., 2015).然而尽管慢速-超慢速扩张洋中脊广泛分布的拆离断层为大型热液活动的发育场所,但并无热液活动发育于其终止线上(Escartín et al., 2017),与断裂带作为热液对流主要通道相悖(Herzig and Hannington, 1995),从而促使了洋壳渗透率分布对热液对流的影响研究.
由于洋底特殊环境的限制,数值模拟成为研究海底热液对流与成矿机制的有效方式.结合实际的观测结果(German et al., 2010; Baker, 2007; Kelley et al., 2001, 2005; Barreyre et al., 2014),可对海底热液的循环模式与演化历史进行研究.本文统计了大西洋洋中脊发育的不同类型热液活动(图 1a)和部分经实测/推测得出的洋壳平均渗透率(图 1b),并将渗透率作为单一变化因素来探究洋壳渗透率结构对洋壳内部热液对流形态与热液输出(喷发温度、热流值、热液喷发位置)的影响.

|
图 1 大西洋洋中脊热液活动分布规律(a)和部分热液区下伏洋壳渗透率测算(b) 热液区的位置引自Ernst et al., 2000; Zhao et al., 2012; Wheeler et al., 2013; Lalou et al., 1990; Charlou et al., 2000; Pedersen et al., 2010; Langmuir et al., 1997; Escartín et al., 2017; Dias et al., 2011; Fouquet et al., 2008; German et al., 2010; Kelley et al., 2005; Melchert et al., 2008; Murton et al., 1995; Haase et al., 2009, 渗透率测算结果引自Lowell et al., 2013. Fig. 1 Axial distribution of the hydrothermal fields of Mid-Atlantic Ridge (a) and their crustal permeability (b) The location of hydrothermal fields are from Ernst et al., 2000; Zhao et al., 2012; Wheeler et al., 2013; Lalou et al., 1990; Charlou et al., 2000; Pedersen et al., 2010; Langmuir et al., 1997; Escartiín et al., 2017; Dias et al., 2011; Fouquet et al., 2008; German et al., 2010; Kelley et al., 2005; Melchert et al., 2008; Murton et al., 1995; Haase et al., 2009, and the permeabilities are from Lowell et al., 2013. |
由于洋壳温度相关的弹-塑特性和静岩压力的压实作用,洋壳渗透率垂向上表现为逐渐减小的趋势,且洋壳上部喷发玄武岩层的渗透率要明显高于下部的席状岩墙层(Morgan and Chen, 1993a, 1993b),而岩浆热源和地幔部分则一般被认为是非渗透性层(Theissen-Krah et al., 2016).岩浆热源内部的热量经上覆热传导边界层(CBL)传导至洋壳渗透层,在热传导边界层,温度逐渐减小(由热源处的~1200 ℃至渗透层底部的~600 ℃, Lowell, 2010).在热传导边界层顶部的加热作用下,洋壳渗透层发生海水-围岩的热化学反应和热液对流活动(图 2),驱动上覆热液对流系统的运转,维持源源不断的海水下渗(recharge)与热液上涌(discharge)循环.

|
图 2 洋中脊热液区下伏洋壳结构与渗透率分布示意图 Fig. 2 Sketch for the crustal structure and permeability under hydrothermal fields in mid-ocean ridges |
不同于洋壳渗透率的垂向变化,其水平方向的变化并无特定规律.一般来说,伸展构造活动越集中,表现为高渗透率的局部集中,反之则表现为相对较低的渗透性.同时,洋壳蛇纹石化等蚀变反应引发的局部破裂也会导致渗透率的局部增加(Lowell, 2010).
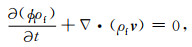
2 热力学数值模拟 2.1 热对流控制方程本文的数值模拟基于布辛涅斯克近似定义(Boussinesq approximation, Crone and Wilcock, 2005).在进行模拟工作之前,首先给出单相流体充填、各向均一介质的热对流基本控制方程,包括流体的物质守恒方程、热量守恒方程(方程(1), (2)):
|
(1) |
|
(2) |
T为温度,t为时间,ф为模型基质孔隙度,ρ为密度,v为对流速度,Cp为比热容,λ为热传导系数.参数下标m和f分别代表围岩-流体混合体和流体的属性(下同).
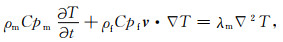
根据孔隙流体的达西定律,洋壳内部热流体的对流速度可由其所处介质的渗透率、流体性质和压力梯度获得(方程(3)):
|
(3) |
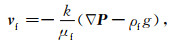
μ为动力学黏度,k为渗透率.基于流体实验的结果,本文应用基于流体实验的、温压相关的非线性流体性质(Pitzer et al., 1984; Anderko and Pitzer, 1993; Holzbecher, 1998)数据,在该数据中,不同的温压值对应唯一的流体属性组合(密度、黏度、比热容等).本文的解析模型则基于简化的线性流体方程(方程(4)):
|
(4) |
其中,ρf0表示温度T=T0时海水的密度.以100 ℃为界,流体的运动学黏度表现为两种不同的规律(Schoofs 2000,Schoofs and Hansen, 2000,方程(5), (6)),即:
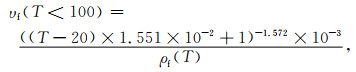
|
(5) |
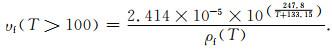
|
(6) |
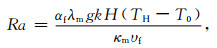
洋壳下伏热量的传递和释放主要通过热扩散和热对流两种方式,而当热对流速度远大于热扩散速度时,洋壳内部的热液对流得以发生,二者比值,即瑞丽数(Ra, Rayleigh number, 方程(7))为:
|
(7) |
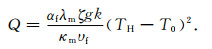
α为热扩张系数,κ为热扩散系数,υ为流体的运动学黏度,TH为热源温度.Ra揭示了热液对流系统的强度,当Ra大于特定的临界值(Rac)时,热液对流最终产生,这种临界值会根据模型的形状、参数而变化,具体数值可由实验获得.Ra越大,热液对流越剧烈,反之则越微弱.
热扩散的热量输出可由海底温度与下伏热源温度差、模型深度等参数获得(方程(8)):
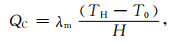
|
(8) |
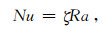
洋底的总热量输出和热扩散输出比值为纳赛尔数(Nu, Nusselt number, 方程(9), Nu>1),即:

|
(9) |
其与对流系统的Ra表现为线性相关(ζ~0.1, 方程(10)):
|
(10) |
因此,洋中脊总热量输出(包括扩散与对流,方程(11))可最终获得:
|
(11) |
本文使用基于孔隙介质达西流体的控制体积法进行数值模拟工作,模型为长方形块体,代表洋中脊跨轴一定距离(L)和深度(H)的二维剖面.模型主体为固定孔隙度(3%)的渗透层,代表以喷发性玄武岩、席状辉绿岩墙为主的上部洋壳(图 2).模型上界为恒定压力(20 MPa,模拟~2000 m的海水深度)和温度(0 ℃),且对流体开放的海底面.另外,模型的左右边界和底界均被设置为绝热、封闭的边界(图 3).

|
图 3 参数设置与边界条件 (a)垂向线性分布的渗透率结构; (b)水平方向上呈正弦分布的洋壳渗透率分布. Fig. 3 Parameter settings and boundary conditions (a) Vertical linear distribution of permeability; (b) Horizontally sinusoidal variation of permeability. |
模型的其他参数(渗透率、温度结构等)设置为不同的分布结构,以模拟实际的洋壳岩石圈.首先,对于渗透率垂向分布规律的研究,我们在模型(20 km×10 km)中分别设置了三个具有固定渗透率的节点,其中上界和底界分别设为kt和kb(kt>kb),中部节点(5 km深度)渗透率为介于上述两者间的固定值(kb≤kmid≤kt),在此基础上,上下两个层位的渗透率在垂向上呈严格的线性分布,以更好地区分洋壳内部不同圈层.另外,模型底界设置宽度为2 km的高温热源(500 ℃).
对于渗透率水平分布规律的研究,我们假设模型(10 km×5 km)水平方向渗透率变化表现为不同数量的正弦波动形态,其中,渗透率的峰值为kp(如, 1×10-14 m2),谷值则为ktr(如, 1×10-18 m2),热源位置对应不同相位,指示不同的渗透率水平变化率,且底部热源的位置和尺寸同前者相同,但温度设置为更高的700 ℃(图 3b).另外,洋壳内高温区域一般对应低渗透率或非渗透性层,Morgan和Chen(1993a)和Fontaine等(2011)均将高于600 ℃的洋壳设为非渗透性层,因此我们将模型深度4 km以下设置为均一的低渗层(1×10-18 m2).为了清晰地显示洋壳内部热液对流的形态并尽量缩减运行时间,模型的计算网格(单个控制体积)分别被设置为100 m和50 m.
基于上述模型的初始条件,本文将各模型分别运行至2~10 ka,以保证各模型均已运行至稳态条件.
3 数值模拟结果需要注意的是,本文应用的渗透率较已知的实测/推测值更低,Lowell等(2013)和Driesner(2010)的研究表明,洋壳渗透率分布在1×10-14 m2至1×10-13 m2之间才可得出符合实际观测的热液喷发特征(图 1b),然而全球洋中脊绝大部分洋壳的渗透率难以有效地测得,且前人模拟表明,较高渗透率(如, >1×10-13 m2)的洋壳难以维持相对高温(>200 ℃)的热液对流系统,这符合在高渗透性洋壳内,热液流体流速过快,难以经过持续加热的理论(Driesner, 2010).针对这种高渗透率模型,需要极小的网格来模拟模型中的热传导边界层.因此,基于流体性质参数的有效范围和运行成本,本文选择相对更冷、渗透性较低的基质来模拟渗透性洋壳.
3.1 均一性渗透率分布在探究洋壳渗透率的空间分布对热液对流形态和模型输出参数(喷发温度和热流值)的影响之前,我们首先运行了均衡加热(500 ℃)、均一渗透率(1×10-16~1×10-14 m2)和不同尺寸(h=2 km、5 km、8 km和10 km)的一系列参考模型.根据均一模型的运行结果,洋壳内部单个热液对流单元的宽度(L, 图 4a)与模型渗透率和热源深度成反相关和正相关关系(图 4b,Lowell and Germanovich, 2004),符合:L~hRa0.5, 其中h为模型高度(方程(7)).图 4b直接揭示了这种关系.

|
图 4 均一渗透率模型示意图(a, L为单个热液对流单元的宽度)与模型运行结果(b) Fig. 4 Cartoon for homogeneous permeability models (a, L is the width of a single convection cell) and simulation results (b) |
另外,在高度为10 km,渗透率为5×10-15 m2的均一模型中,如图 5a所示,稳态下等距发育7个等宽(~2000 m)的上升热液羽,热液最大喷发温度可达250 ℃,热液羽间的低温区为海水下渗的区域.

|
图 5 数值模拟结果 (a)均一渗透率(5×10-15 m2)、均衡加热的数值模拟结果,图中箭头表示海水或热液的运动速度(下同);(b, c)渗透率垂向线性分布、集中加热的数值模拟结果,其中,(b)模型顶界渗透率为5×10-15 m2,底界和中部节点渗透率均为5×10-17 m2,(c)模型顶界和中部节点渗透率为5×10-15 m2,底界渗透率为5×10-17 m2. Fig. 5 Simulation results (a) Homogeneous permeability (5×10-15 m2) with continuous heat source, arrows indicate the speed of seawater and hydrothermal fluid (same below); (b, c) Vertical linear distribution of permeability with localized heat source, top permeability: 5×10-15 m2, central and bottom permeability: 5×10-17 m2 in (b); and bottom permeability: 5×10-17 m2, central and top permeability: 5×10-15 m2 in (c). |
依据模拟结果,以顶、底界渗透率分别为5×10-15 m2和5×10-17 m2的垂向线性模型为例,若中部渗透率为较低的5×10-17 m2(图 5b),即模型下层为均一低渗层,热液羽表现为“上细下粗”的形态,喷发温度约为100 ℃.与前者相反,若中部渗透率为5×10-15 m2,模型平均渗透率高于前者,上涌热液羽规模明显缩小,垂向上的规模变化更不明显(图 5c).上述模拟结果表明,洋壳渗透率直接影响热液羽的规模和形态(Coumou et al., 2006; Driesner, 2010),渗透率越高,热液羽规模越小,反之则越大.
相对于快速扩张洋中脊小规模的热液活动,慢速-超慢速扩张洋中脊多发育规模巨大(如, TAG, 龙旂, Rona et al., 1993; Tao et al., 2012)的高温热液活动(Hannington et al., 2011; German et al., 2016).依据上述研究结果可推测,慢速-超慢速扩张洋中脊可能并不会因为构造应变率的增加(Behn and Ito, 2008)而显著提升其洋壳平均渗透率,甚至导致洋壳平均渗透率较快速扩张洋中脊更低(从而形成较快速扩张洋中脊更大规模的热液喷发活动),另外,热液上涌过程中矿物的沉淀、堆积也会一定程度上降低其上涌通道的渗透率(Fontaine et al., 2011),形成更大的热液羽和喷发规模.在这种情况下,构造伸展作用(Barreyre et al., 2018)对渗透性的提升可能只集中于洋壳浅层,平均渗透率的变化或决定于深部岩浆活动相关的挤压裂缝.
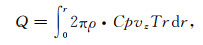
在上述数值模拟结果的基础上,我们收集了不同模型的最大热液喷发温度,并将二维模拟结果中的热液羽转化为理想的三维热液羽形态,从而获得单个热液羽的总热流值(方程(12), 图 6),即:

|
图 6 不同垂向渗透率分布模型的输出结果(喷发温度和总热流值) (a, b)顶部渗透率为1×10-14 m2; (c, d)底部渗透率为1×10-16 m2; (e, f)底部渗透率为5×10-17 m2; (g, h)不同渗透率分布的均衡加热模型. Fig. 6 Outputs for different vertical permeability distribution (venting temperature and total heat flux) (a, b) Top permeability of 1×10-14 m2; (c, d) Bottom permeability of 1×10-16 m2; (e, f) Bottom permeability of 5×10-17 m2; (g, h) Homogeneous heating models with different permeabilities. |
|
(12) |
其中,vz为流体上涌速度,r为热液羽喷发半径.
依据统计结果,洋壳平均渗透率是控制热液喷发温度和热流值的主要因素,且洋壳平均渗透率分别与二者成反相关和正相关关系,即渗透率越大,热量输出越大(方程(11)),而热液喷发温度则减小(图 6),在顶界渗透率为5×10-17 m2的模拟结果中(图 6a, b),最高喷发温度为~150 ℃,最大热流值为~11 MW;在底界渗透率为1×10-16 m2的结果中(图 6c, d),最高喷发温度为~150 ℃,最大热量输出为~8 MW;而当底界渗透率为5×10-17 m2(图 6e, f),最高喷发温度为~155 ℃,最大输出功率为~5 MW.另外,当模型上层渗透率结构固定,提升下层的渗透率有助于产生更高的喷发温度和输出功率(图 6a, b);而当模型下层渗透率固定,上层渗透率的提升则导致了热量输出规模的减小(图 6c, d).这说明若要得到规模巨大的高温热液喷发系统,增强洋壳深部渗透率的效果更为明显.相较于各洋中脊热液区的实际输出(Lowell et al., 2013),本文的模拟结果偏低,真实环境中洋壳内部的岩浆热源可能具有更大的规模(如Lucky Strike热液区下伏岩浆透镜体,Singh et al., 2006),更浅的位置(如东太平洋洋隆9°30′N下岩浆透镜体,Toomey et al., 1994),以及更高的温度,洋壳内部也应具有更高的渗透率(图 1,Lowell et al., 2013),从而形成多个上升热液羽,聚集于热液喷口下伏洋壳.与此同时,岩浆熔体结晶释放的潜热和洋壳内部蛇纹石化等放热蚀变反应也可为上覆热液对流系统提供额外热源供给,从而形成高于本文数值模拟结果一个数量级的热量输出和更高的喷发温度.
3.3 水平方向变化的渗透率结构相较于渗透率的垂向变化,为了模拟不同的洋壳渗透率水平变化,本文将模型底界的岩浆热源放置在垂向均一,水平方向正弦分布渗透率的不同相位(图 3b)之下,以检验稳态下洋壳渗透率的水平变化对热液对流形态的影响.
依据模拟结果,当模型包含一个正弦周期(360°)的水平渗透率变化,且热源位于0°相位时(图 7a, b, c),热液的上涌并未沿渗透率的水平坡度由热源右侧的高渗区喷发,而是汇集于热源左侧0°~-90°相位间,右侧高渗区则发育广泛的海水下渗,使高渗区表现为低温和海水缓慢下渗的特点(图 7b, c).若将热源置于270°相位,即渗透率谷值位置(图 7d)时,热源上覆洋壳几乎只发挥热传导作用,在热源两侧高渗区则形成两个独立的热液对流循环,海水下渗和热液上涌的聚集位置与0°相位模拟结果相似.

|
图 7 水平方向正弦分布渗透率模型数值模拟结果 (a, b, c)单个正弦,热源位于0°相位(a)的稳态温度(b)与速度结构(c); (d, e, f)单个正弦,热源位于270°相位(d)的稳态温度(e)与速度结构(f); (g, h, i) 2.5个正弦,热源位于0°相位(g)的稳态温度(h)与速度结构(i); (j, k, l) 2.5个正弦,热源位于270°相位(j)的稳态温度(k)与速度结构(l). Fig. 7 Simulation results with horizontal sinusoidal distribution permeability (a, b, c) Temperature (b) and venting velocity field (c) with the heat source on 0° and a single sine (a); (d, e, f) Temperature (e) and venting velocity field (f) with the heat source on 270° and a single sine (d); (g, h, i) Temperature (h) and venting velocity field (i) with the heat source on 0° and 2.5 sines (g); (j, k, l) Temperature (k) and venting velocity field (l) with the heat source on 270° and 2.5 sines (j). |
增加水平渗透率变化正弦的个数(如, 2.5个,图 7g),即0°相位水平渗透率变化率增加至一定程度时(如, 4.5×10⁻¹⁶ m2/m),洋壳内热液对流形态开始受到渗透率水平变化率的影响,表现为热液流体沿渗透率水平坡度向高渗区转移并上涌,同时高渗区的海水下渗使洋壳内部形成完整的对流循环.除此之外,上涌热液在洋壳深部产生向热源左侧高渗区移动的分支,并最终在-90°~-270°相位范围内发育另一个相对较小的对流循环系统(图 7h, i),本文称之为远程热液释放区(图 8a).当热源置于-270°相位时(图 7j, k, l),热液对流形态与前者(图 7d, e, f)类似,只是对流系统的规模相对减小.

|
图 8 渗透率水平分布模型输出结果 (a)不同渗透率分布模型的稳态热流值剖面,热源均位于0°相位; (b)不同渗透率分布模型的热液羽形态变化规律,横轴表示热源处渗透率水平变化率,纵轴为热源-热液喷发位置相位差. Fig. 8 Outputs of simulations with horizontal variations of permeability (a) Heat flux profile of steady-state models with different permeability distributions, heat source is located at 0°; (b) Geometry of plumes with different permeability distribution, horizontal axis shows horizontal slope of permeability, and vertical axis is the phase-lag between heat source and venting. |
上述结果表明,热液上涌和喷发并非只是简单地汇集于高渗区,最终的热液上涌形态和喷发位置往往是热液上涌与海水下渗间的平衡结果.只有渗透率水平变化率到达一定程度,热液的上涌才会沿着这种水平坡度向高渗区转移.
为了直观显示渗透率水平变化对热液对流的偏移影响,本文整理了稳态模型的热流值剖面(图 8a),以及热液喷发位置与热源(固定于0°相位,图 8b)间的相位差来表示热液羽的水平偏移程度和渗透率水平变化之间的关系.
结果显示,热源上覆渗透率水平变化率为(1.8~4.5)×10-16 m2/m时,热液喷发位置由负相位逐渐向热源中心靠拢,热流值逐渐升高.每个稳态模型都在热源左侧渗透率谷值两翼存在两个不同规模的热量输出,且二者呈现相似的变化规律.另外,图 7b表明热液喷发位置随着0°相位渗透率的水平变化率逐步向热源右侧高渗相位转移,但只有在特定的渗透率水平变化范围内((4.5~6.3)×10-16 m2/m),热液的上涌和喷发分裂为两个规模近似的分支.
4 讨论洋中脊的构造伸展作用直接提升了洋壳的渗透性,如洋中脊断裂带的伸展作用和强烈的水-岩蚀变使其成为热液对流的主要通道(McCaig et al., 2007; Andersen et al., 2015).目前的调查进展表明,广泛发育在慢速-超慢速扩张洋中脊的拆离断层是该类扩张中心热液活动的主要聚集地带,并分别在其上下盘发育TAG、龙旂、Rainbow、Semenov Ⅱ、Von Damm等大规模、持续发育的热液活动区,且部分热液区下伏发现了可作为热源的地震波低速体(Canales et al., 2017; Escartín et al., 2017; Harding et al., 2017).然而,在这些大型拆离断层的终止线附近却未发现任何热液活动(Escartín et al., 2017),这也间接证明了只有在特定的渗透率变化规律下,热液才会跟随渗透率坡度,沿局部高渗区(断层)上涌和喷发,在其他情况下,断层等局部高渗区则往往优先作为海水向下充注的区域.
以发育于大西洋洋中脊26°N的TAG活动热液区为例,该热液区位于拆离断层上盘,地震层析结果显示其下伏存在可作为热液对流系统热源的低波速异常(Zhao et al., 2012),并与拆离断层的根部存在密切的关系.结合数值模拟与实际观测的结果可最终推测该热液系统在洋壳内部的对流形态(图 9),即海水下渗集中于断裂带及其周缘高渗区,热液的上涌虽在洋壳深部受到断裂带高渗透率的影响而产生横向偏移,但至少在洋壳浅层,上涌的热液会脱离高渗区的影响,并直接喷发于拆离断层上盘.

|
图 9 洋壳渗透率变化对热液对流与喷发位置的影响模型(以TAG热液区为例, 热液喷发和岩浆热源的位置参考deMartin et al., 2007; Zhao et al., 2012) Fig. 9 Cartoon for the influence of permeability variation on hydrothermal convection and venting location (taking TAG as an example, the venting and heat source location are referred to deMartin et al., 2007; Zhao et al., 2012) |
(1) 洋中脊热力学数值模拟表明洋壳渗透率是影响洋壳内部热液对流形态、热液喷发位置和热输出效率的主要因素,且渗透率越大,热液对流单元越小,反之,热液对流单元越大.
(2) 洋壳平均渗透率分别与热液最大喷发温度和热量输出功率呈反相关和正相关的关系,符合达西流体热对流的解析规律.并且洋壳深部渗透率的增强对于形成大规模高温热液喷发系统的影响较调节浅层渗透率更为明显.
(3) 在局部热源集中加热的前提下,洋壳渗透率的垂向线性变化不会使其内部的热液对流形态发生偏离,只会导致热液羽规模发生垂向上的规律变化.
(4) 洋壳渗透率的水平变化是引发热液羽和喷发位置偏移的主要因素,且只有在特定的渗透率水平变化率范围内,才会发生向高渗区的明显偏移,这也符合现今拆离断层相关的热液系统几乎没有任何发育在断层终止线的事实.
(5) 大西洋TAG热液区下伏洋壳内热液上涌必然受到其相邻断裂带高渗区的影响,但渗透率水平变化率的局限导致热液羽最终脱离高渗区的控制,喷发于拆离断层上盘.
Anderko A, Pitzer K S. 1993. Equation-of-state representation of phase equilibria and volumetric properties of the system NaCl-H2O above 573 K. Geochimica et Cosmochimica Acta, 57(8): 1657-1680. DOI:10.1016/0016-7037(93)90105-6 |
Andersen C, Rüpke L, Hasenclever J, et al. 2015. Fault geometry and permeability contrast control vent temperatures at the Logatchev 1 hydrothermal field, Mid-Atlantic Ridge. Geology, 43(1): 51-54. |
Baker E T. 2007. Hydrothermal cooling of midocean ridge axes:do measured and modeled heat fluxes agree?. Earth and Planetary Science Letters, 263(1-2): 140-150. DOI:10.1016/j.epsl.2007.09.010 |
Barreyre T, Escartín J, Sohn R A, et al. 2014. Temporal variability and tidal modulation of hydrothermal exit-fluid temperatures at the Lucky Strike deep-sea vent field, Mid-Atlantic Ridge. Journal of Geophysical Research:Solid Earth, 119(4): 2543-2566. DOI:10.1002/2013JB010478 |
Barreyre T, Olive J A, Crone T J, et al. 2018. Depth-dependent permeability and heat output at basalt-hosted hydrothermal systems across mid-ocean ridge spreading rates. Geochemistry, Geophysics, Geosystems, 19(4): 1259-1281. DOI:10.1002/2017GC007152 |
Behn M D, Ito G. 2008. Magmatic and tectonic extension at mid-ocean ridges:1. Controls on fault characteristics. Geochemistry, Geophysics, Geosystems, 9(8): Q08O10. DOI:10.1029/2008GC001965 |
Canales J P, Dunn R A, Arai R, et al. 2017. Seismic imaging of magma sills beneath an ultramafic-hosted hydrothermal system. Geology, 45(5): 451-454. DOI:10.1130/G38795.1 |
Charlou J L, Donval J P, Douville E, et al. 2000. Compared geochemical signatures and the evolution of Menez Gwen (37°50'N) and lucky strike (37°17'N) hydrothermal fluids, south of the Azores triple junction on the mid-Atlantic Ridge. Chemical Geology, 171(1-2): 49-75. DOI:10.1016/S0009-2541(00)00244-8 |
Coumou D, Driesner T, Geiger S, et al. 2006. The dynamics of mid-ocean ridge hydrothermal systems:Splitting plumes and fluctuating vent temperatures. Earth and Planetary Science Letters, 245(1-2): 218-231. DOI:10.1016/j.epsl.2006.02.044 |
Crone T J, Wilcock W S D. 2005. Modeling the effects of tidal loading on mid-ocean ridge hydrothermal systems. Geochemistry, Geophysics, Geosystems, 6(7): Q07001. DOI:10.1029/2004GC000905 |
deMartin B J, Sohn R A, Canales P J, et al. 2007. Kinematics and geometry of active detachment faulting beneath the Trans-Atlantic Geotraverse (TAG) hydrothermal field on the Mid-Atlantic Ridge. Geology, 35(8): 711-714. DOI:10.1130/G23718A.1 |
Dias Á S, Früh-Green G L, Bernasconi S M, et al. 2011. Geochemistry and stable isotope constraints on high-temperature activity from sediment cores of the Saldanha hydrothermal field. Marine Geology, 279(1-4): 128-140. DOI:10.1016/j.margeo.2010.10.017 |
Driesner T. 2010. The interplay of permeability and fluid properties as a first order control of heat transport, venting temperatures and venting salinities at mid-ocean ridge hydrothermal systems. Geofluids, 10(1-2): 132-141. |
Elderfield H, Schultz A. 1996. Mid-ocean ridge hydrothermal fluxes and the chemical composition of the ocean. Annual Review of Earth and Planetary Sciences, 24: 191-224. DOI:10.1146/annurev.earth.24.1.191 |
Ernst G G J, Cave R R, German C R, et al. 2000. Vertical and lateral splitting of a hydrothermal plume at Steinahóll, Reykjanes Ridge, Iceland. Earth and Planetary Science Letters, 179(3-4): 529-537. DOI:10.1016/S0012-821X(00)00140-0 |
Escartín J, Mével C, Petersen S, et al. 2017. Tectonic structure, evolution, and the nature of oceanic core complexes and their detachment fault zones (13°20'N and 13°30'N, mid Atlantic ridge). Geochemistry, Geophysics, Geosystems, 18(4): 1451-1482. DOI:10.1002/2016GC006775 |
Fontaine F J, Olive J A, Cannat M, et al. 2011. Hydrothermally-induced melt lens cooling and segmentation along the axis of fast-and intermediate-spreading centers. Geophysical Research Letters, 38(14): L14307. DOI:10.1029/2011GL047798 |
Fouquet Y, Cherkashev G, Charlou J L, et al. 2008. Serpentine cruise ultramafic hosted hydrothermal deposits on the Mid-Atlantic Ridge:First submersible studies on Ashadze 1 and 2, Logatchev 2 and Krasnov vent fields. InterRidge News, 17: 15-19. |
German C R, Thurnherr A M, Knoery J, et al. 2010. Heat, volume and chemical fluxes from submarine venting:A synthesis of results from the Rainbow hydrothermal field, 36°N MAR. Deep Sea Research Part Ⅰ:Oceanographic Research Papers, 57(4): 518-527. DOI:10.1016/j.dsr.2009.12.011 |
German C R, Petersen S, Hannington M D. 2016. Hydrothermal exploration of mid-ocean ridges:where might the largest sulfide deposits be forming?. Chemical Geology, 420: 114-126. DOI:10.1016/j.chemgeo.2015.11.006 |
Haase K M, Koschinsky A, Petersen S, et al. 2009. Diking, young volcanism and diffuse hydrothermal activity on the southern Mid-Atlantic Ridge:The Lilliput field at 9°33'S. Marine Geology, 266(1-4): 52-64. DOI:10.1016/j.margeo.2009.07.012 |
Hannington M, Jamieson J, Monecke T, et al. 2011. The abundance of seafloor massive sulfide deposits. Geology, 39(12): 1155-1158. DOI:10.1130/G32468.1 |
Harding J L, Van Avendonk H J A, Hayman N W, et al. 2017. Magmatic-tectonic conditions for hydrothermal venting on an ultraslow-spread oceanic core complex. Geology, 45(9): 839-842. DOI:10.1130/G39045.1 |
Herzig P M, Hannington M D. 1995. Polymetallic massive sulfides at the modern seafloor a review. Ore Geology Reviews, 10(2): 95-115. |
Holzbecher E O. 1998. Modeling Density-Driven Flow in Porous Media. Principles, Numerics, Software. Berlin: Springer Science & Business Media. https://www.researchgate.net/publication/234015204_Modeling_Density-Driven_Flow_in_Porous_Media
|
Kelley D S, Karson J A, Blackman D K, et al. 2001. An off-axis hydrothermal vent field near the Mid-Atlantic Ridge at 30°N. Nature, 412(6843): 145-149. DOI:10.1038/35084000 |
Kelley D S, Karson J A, Früh-Green G L, et al. 2005. A serpentinite-hosted ecosystem:the Lost City hydrothermal field. Science, 307(5714): 1428-1434. DOI:10.1126/science.1102556 |
Lalou C, Thompson G, Arnold M, et al. 1990. Geochronology of TAG and Snakepit hydrothermal fields, Mid-Atlantic Ridge:witness to a long and complex hydrothermal history. Earth and Planetary Science Letters, 97(1-2): 113-128. DOI:10.1016/0012-821X(90)90103-5 |
Langmuir C, Humphris S, Fornari D, et al. 1997. Hydrothermal vents near a mantle hot spot:the Lucky Strike vent field at 37°N on the mid-Atlantic ridge. Earth and Planetary Science Letters, 148(1-2): 69-91. DOI:10.1016/S0012-821X(97)00027-7 |
Lowell R P, Germanovich L N. 2004. Hydrothermal processes at mid-ocean ridges: Results from scale analysis and single-pass models.//German C R, Lin J, Parson L M eds. Mid-Ocean Ridges: Hydrothermal Interactions Between the Lithosphere and Oceans. Washington DC: American Geo-physical Union, 219-244. https://www.researchgate.net/publication/280299534_Hydrothermal_Processes_at_Mid-Ocean_Ridges_Results_from_Scale_Analysis_and_Single-Pass_Models
|
Lowell R P. 2010. Hydrothermal circulation at slow spreading ridges: analysis of heat sources and heat transfer processes.//Rona P A, Devey C W, Dyment J, et al eds. Diversity of Hydrothermal Systems on Slow Spreading Ocean Ridges. Washington DC: Geophysical Monograph Series, 188: 11-26. https://www.researchgate.net/publication/258390991_Hydrothermal_Circulation_at_Slow_Spreading_Ridges_Analysis_of_Heat_Sources_and_Heat_Transfer_Processes
|
Lowell R P, Farough A, Hoover J, et al. 2013. Characteristics of magma-driven hydrothermal systems at oceanic spreading centers. Geochemistry, Geophysics, Geosystems, 14(6): 1756-1770. DOI:10.1002/ggge.20109 |
McCaig A M, Cliff R A, Escartin J, et al. 2007. Oceanic detachment faults focus very large volumes of black smoker fluids. Geology, 35(10): 935-938. DOI:10.1130/G23657A.1 |
Melchert B, Devey C W, German C R, et al. 2008. First evidence for high-temperature off-axis venting of deep crustal/mantle heat:The Nibelungen hydrothermal field, southern Mid-Atlantic Ridge. Earth and Planetary Science Letters, 275(1-2): 61-69. DOI:10.1016/j.epsl.2008.08.010 |
Morgan J P, Chen Y J. 1993a. The genesis of oceanic crust:Magma injection, hydrothermal circulation, and crustal flow. Journal of Geophysical Research:Solid Earth, 98(B4): 6283-6297. DOI:10.1029/92JB02650 |
Morgan J P, Chen Y J. 1993b. Dependence of ridge-axis morphology on magma supply and spreading rate. Nature, 364(6439): 706-708. DOI:10.1038/364706a0 |
Murton B J, Van Dover C, Southward E. 1995. Geological setting and ecology of the Broken Spur hydrothermal vent field:29°10'N on the mid-Atlantic ridge. Geological Society, London, Special Publications, 87(1): 33-41. DOI:10.1144/GSL.SP.1995.087.01.04 |
Pedersen R B, Thorseth I H, NygåRd T E, et al. 2010. Hydrothermal activity at the Arctic mid-ocean ridges.//Rona P A, Devey C W, Dyment J, et al eds. Diversity of Hydrothermal Systems on Slow Spreading Ocean Ridges. Washington DC: Geophysical Monograph Series, 67-89. https://www.researchgate.net/publication/258390867_Hydrothermal_Activity_at_the_Arctic_Mid-Ocean_Ridges
|
Pitzer K S, Peiper J C, Busey R H. 1984. Thermodynamic properties ofaqueous sodium chloride solutions. Journal of Physical and Chemical Reference Data, 13(1): 1-102. DOI:10.1063/1.555709 |
Rona P A, Bogdanov Y A, Gurvich E G, et al. 1993. Relict hydrothermal zones in the TAG hydrothermal field, Mid-Atlantic Ridge 26°N, 45°W. Journal of Geophysical Research:Solid Earth, 98(B6): 9715-9730. DOI:10.1029/93JB00552 |
Schoofs S, Hansen U. 2000. Depletion of a brine layer at the base of ridge-crest hydrothermal systems. Earth and Planetary Science Letters, 180(3-4): 341-353. DOI:10.1016/S0012-821X(00)00184-9 |
Singh S C, Crawford W C, Carton H, et al. 2006. Discovery of a magma chamber and faults beneath a Mid-Atlantic Ridge hydrothermal field. Nature, 442(7106): 1029-1032. DOI:10.1038/nature05105 |
Stein C A, Stein S. 1994. Constraints on hydrothermal heat flux through the oceanic lithosphere from global heat flow. Journal of Geophysical Research:Solid Earth, 99(B2): 3081-3095. DOI:10.1029/93JB02222 |
Tao C H, Lin J, Guo S Q, et al. 2012. First active hydrothermal vents on an ultraslow-spreading center:Southwest Indian Ridge. Geology, 40(1): 47-50. |
Theissen-Krah S, Rüpke L H, Hasenclever J. 2016. Modes of crustal accretion and their implications for hydrothermal circulation. Geophysical Research Letters, 43(3): 1124-1131. DOI:10.1002/2015GL067335 |
Toomey D R, Solomon S C, Purdy G M. 1994. Tomographic imaging of the shallow crustal structure of the East Pacific Rise at 9°30'N. Journal of Geophysical Research:Solid Earth, 99(B12): 24135-24157. DOI:10.1029/94JB01942 |
Wheeler A J, Murton B, Copley J, et al. 2013. Moytirra:Discovery of the first known deep-sea hydrothermal vent field on the slow-spreading Mid-Atlantic Ridge north of the Azores. Geochemistry, Geophysics, Geosystems, 14(10): 4170-4184. DOI:10.1002/ggge.20243 |
Wilcock W S D, Fisher A T. 2004. Geophysical constraints on the subseafloor environment near mid-ocean ridges.//Wilcock W S D, Delong E F, Kelley D S, et al eds. The Sub-seafloor Biosphere at Mid-Ocean Ridges. Washington D C: Geophysical Monograph Series.
|
Zhao M H, Canales J P, Sohn R A. 2012. Three-dimensional seismic structure of a Mid-Atlantic Ridge segment characterized by active detachment faulting (Trans-Atlantic Geotraverse, 25°55'N-26°20'N). Geochemistry, Geophysics, Geosystems, 13(11): Q0AG13. DOI:10.1029/2012GC004454 |