 2020, Vol. 63


随着印度板块和欧亚板块的不断挤压和碰撞,新生代以来青藏高原持续隆升,在构造和气候的作用下,形成了今天的青藏高原地貌格局.晚更新世以来,青藏高原周缘和内部的不同类型的活动构造依旧存在不同程度的活动,控制着整个青藏高原地区的强震空间分布(Molnar and Tapponnier, 1975;邓起东等, 2002, 2009).在地球动力学研究中,这些不同类型的活动构造作为边界断裂,将整个青藏高原分割成了不同块体,控制或调节着块体之间的构造变形过程和构造转换关系.青藏高原东北缘作为高原向外扩张的前缘部位,是研究高原隆升的动力学理论、高原地壳运动学模式、探索地震孕育和发生机制的天然实验室(邓起东等,2002).该区晚新生代到现今的构造活动强烈,主要发育着以北西西走向以及北北西走向为主的两组断裂,前者包含阿尔金断裂、海原断裂、东昆仑断裂等大型左旋走滑断裂,在区域构造应变分配中起着主要的控制作用,后者包括鄂拉山、日月山等右旋走滑断裂(图 1),主要调节了不同块体之间的差异运动,这些断裂的活动特征与青藏高原变形机制紧密关联.
地震的孕育发生与地壳运动、尤其是活动块体及其边界带的构造变形密切相关,基于现代大地测量数据,如GPS(Global Positioning System)和InSAR(Interferometric Synthetic Aperture Radar),反演断层上孕震凹凸体的分布,即断层的闭锁状态,已成为评价断裂孕震潜能的重要手段(Jolivet et al., 2013;Moreno et al., 2014;Jiang et al., 2015;Bedford et al., 2016;Hamiel et al., 2016;Wang et al., 2017a;Li et al., 2018; 赵静等,2015).对青藏高原东北缘的断裂震间闭锁及地震危险性的研究主要集中于块体边界的大型断裂,如海原断裂(Gaudemer et al., 1995;Bowman et al., 2003;Jolivet et al., 2013;Li et al., 2017;Wang et al., 2017b;Guo et al., 2019;郝明等,2017)和东昆仑断裂(Van Der Woerd et al., 1998;Wang et al., 2001;Kirby et al., 2007;He and Chéry, 2008;Wang et al., 2017b;李琦等,2019).然而,对次级断裂的关注相对较少,从而在区域地震危险性的评估中出现信息缺失.鄂拉山断裂作为分隔柴达木盆地、茶卡—共和盆地的一条重要边界断裂,其震间闭锁状态和孕震潜能目前尚不明确,近二十年以来在青藏高原东北缘布设的密集GPS台网可为研究该断裂的深部构造变形提供地表约束,也为更加深入的探索区域地壳形变模式、了解应力加载-成核过程、探索地震发生机制等科学问题提供重要的数据支撑(Cavalié et al., 2008;李彦川等,2016).
以往研究对青藏高原东北缘主要边界断裂(如海原断裂)的变形方式、积累运动幅度及滑动速率等取得了较好的认识(Gaudemer et al., 1995;Tapponnier et al., 2001;Jing et al., 2007;Gan et al., 2007;Zheng et al., 2013;李彦川等, 2016),但现有一些研究对鄂拉山断裂构造活动特征的认识有限,同时研究结果也存在一些差异.如袁道阳(2003)通过对鄂拉山断裂带的航卫片解译和野外考察,认为该断裂晚更新世晚期以来地质体错段达9~12 km,平均水平滑动速率为4.1±0.9 mm·a-1、垂直滑动速率为0.15±0.1 mm·a-1;此后,通过测年的方法更新该断裂的走滑速率为1.1±0.3 mm·a-1(Yuan et al., 2011),并以此推断青藏高原东北缘向东的挤出和逃逸是非常有限的,即青藏高原东北缘在区域性北东向挤压的作用之下,应变在地壳发生弥散分解(Duvall and Clark, 2010).周德敏(2005)利用青藏高原东北缘1999—2004年的GPS数据,基于断层位错模型反演得到鄂拉山断裂走滑速率为3.6±0.8 mm·a-1,并存在~0.3 mm·a-1的逆冲分量.李煜航等(2015)利用1999—2007年相对密集的GPS速度场,基于块体运动学模型反演得到鄂拉山断裂南段走滑速率明显大于北段,南段速率达到2.6 mm·a-1,同时还具有1.7 mm·a-1的拉张速率.上述研究成果可能一方面反映了断层长期构造活动速率与现今构造活动速率之间存在的较大差异,另一方面反映了鄂拉山断层沿走向的闭锁状态可能有变化.因此,利用现今更加密集的GPS数据以及可靠的断层运动学建模,开展鄂拉山断裂闭锁状态与滑动速率的研究,是深入理解区域地震危险的重要基础.
本文以位于青藏高原东北缘的鄂拉山断裂作为研究对象,利用青藏高原东北缘1998—2018年的GPS速度场数据(Zheng et al., 2017; Yu et al., 2019),在贝叶斯反演的框架下,利用马尔科夫链蒙特卡罗(Markov Chain Monte Carlo,MCMC)方法进行断层运动学建模,定量研究鄂拉山断裂的滑动分布和闭锁状态,并对其现今构造变形特征、孕震潜能进行讨论.最后,考虑到现有GPS台网分布稀疏、观测能力有限的问题,给出了有限预算情况下的优化增设GPS台站的建议.
1 研究区域和GPS观测数据 1.1 区域构造背景鄂拉山断裂位于青藏高原东北缘、东昆仑与西秦岭结合部的鄂拉山隆起带东侧,北端与青海南山断裂带斜接,向南贯穿哇洪山、鄂拉山中央谷地,南端在兴海温泉附近与昆中断裂带相接,总体走向NW20°,全长约207 km,主要由六条规模较大的右阶羽列次级断裂带组成,阶距1~3.5 km(袁道阳,2003).该断裂分隔了柴达木盆地、乌兰盆地与茶卡—共和盆地(李永祥等,2011).鄂拉山地区晚新生代以来发育了强烈的右行走滑构造活动,受走滑运动控制的晚新生代盆地也发生了剧烈变形,鄂拉山断裂在第四纪初期由挤压逆冲转换为右行走滑(袁道阳,2003).Duvall和Clark(2010)认为由于印度板块碰撞欧亚板块,青藏高原东北缘NE向的形变在东昆仑断裂—海原断裂之间的上地壳发生弥散,地壳形变以微块体旋转方式被分解.
对鄂拉山断裂形变特征的研究主要可分为地质学方法和大地测量方法,前者主要采用测量典型地质体错位及测年等方式来计算其长期滑动速率,得到的右旋滑动速率在1.1±0.3~4.1±0.9 mm·a-1(Wang and Burchfiel, 2004;Yuan et al., 2011;袁道阳,2003).而采用大地测量数据(GPS)研究鄂拉山断裂形变主要集中于用块体运动学模型确定其右旋滑动速率,得到的结果在1.6~4.4 mm·a-1(Loveless and Meade, 2011;Zheng et al., 2013;Wang et al., 2017b;Li et al., 2018;王敏等,2003).
现代仪器记录以来,鄂拉山地区几乎没发生过大地震,而在鄂拉山北部的海原断裂发生过1920年8.5级海原大地震、1927年8级的古浪地震,在鄂拉山南部的东昆仑断裂发生过2001年8.1级昆仑大地震,在鄂拉山东部的共和盆地发生过1990年6.9级共和地震(图 1).尽管沿鄂拉山地区只发生过一些小的地震,但作为上百公里长的走滑型断层,其潜在地震危险性值得仔细考量,这对该地区的地震风险评估意义重大.

|
图 1 鄂拉山地区构造背景 灰色的圆圈代表从1960年到2014年该地区发生的地震(震级小于5级,地震目录来自于中国地震台网中心),圆圈的大小与震级成比例,青色的圆圈是该区域5级以上的地震分布,蓝色的圆圈表示历史大地震震中位置.黑色的箭头表示断层面的运动方向;红色空心箭头表示地壳缩短方向. Fig. 1 Tectonic setting of the study area Gray circles represent earthquakes with magnitudes smaller than 5 between 1960 and 2014, which were obtained from the China Earthquake Networks Center. The size of circles is proportional to earthquake magnitudes. Cyan circles correspond to earthquakes with magnitudes larger than 5, and blue circles represent epicenters of historical earthquakes. Black arrows show the movement of faults, and the red hollow arrow indicates the direction of crustal shortening. |
本文使用的GPS站点速度场数据来自Zheng等(2017)和Yu等(2019).前者采用Panda软件处理了中国地壳运动观测网络工程和中国大陆构造环境监测网络1991—2015年的GPS数据,并将速度结果转换至稳定欧亚块体参考框架下.后者则在ITRF-2014框架,采用Bernese软件,处理了1998—2018年之间较新的观测.通过统一参考框架,我们对比了两套观测数据,发现二者的差异不大.由于Zheng等(2017)的数据在本研究区比Yu等(2019)的数据多七个台站,因此,本研究主要基于Zheng等(2017)的数据进行建模,与此同时,也基于Yu等(2019)的数据进行对比分析,考察建模结果的一致性和可靠性.
考虑到青藏高原东北缘复杂的地壳构造形变,为尽量减小边界断裂(如海原断裂、东昆仑断裂)对研究结果的影响,本文从Zheng等(2017)的数据中,共选取了51个位于鄂拉山断裂两侧的GPS测站数据,如图 2a黑色箭头所示.我们将该速度场分解到平行于和垂直于鄂拉山断裂,根据图 3的结果,横跨鄂拉山断裂存在明显的左旋走滑分量,正交于断裂的运动分量不显著.据Savage和Burford(1973),间震期的断层蠕滑可以用一个简单的反正切函数加以描述,

|
(1) |

|
图 2 (a) GPS速度场.蓝色圆圈表示GPS台站位置,黑色箭头是GPS观测速度矢量,误差椭圆表示95%的误差置信区间,红色箭头是本研究的模型拟合值;品红色箭头是根据GPS观测值确定的内部应变率;黑色的线框表示图 3中GPS速度剖面的位置;紫色线框表示图 7中选取的微震所在范围;蓝色的箭头表示GPS站点速度拟合残差.(b)残差直方图 Fig. 2 (a) GPS velocity field. Blue dots show the position of GPS station. Black and red arrows represent the observed and modeled GPS velocities respectively. Error ellipses indicate 95% confidence level. The magenta arrows indicate the internal strain rate determined from the GPS observations. Black rectangle shows the position of the GPS velocity profile in Fig. 3. Purple rectangle marks the micro-seismicity profile in Fig. 7. Blue arrows represent the GPS velocity fitting residuals. (b) Histogram of residuals |

|
图 7 鄂拉山断裂的闭锁状态 黑色的虚线框为本研究识别出的强闭锁区,蓝色的点表示图 2a中蓝色框范围的地震(大于3级)分布. Fig. 7 Fault coupling along the Elashan fault Black dashed polygon outlines the strong locked patch identified in this study, and the blue dots represent earthquakes with magnitudes larger than 3 outlined by the blue polygon in Fig. 2a. |

|
图 3 GPS速度剖面 (a)平行于断层的速率.灰色曲线代表用蒙特卡罗方法对公式(1)进行采样得到的模型分布,蓝色曲线代表概率最大模型; (b)垂直于断层的速率.误差棒表示1-σ误差.(c)对公式(1)中s参数的采样结果. Fig. 3 GPS velocity profile (a) Fault parallel components. Gray curves represent the model distribution obtained by sampling the formula (1) using a Monte Carlo method, and the blue curve highlights the optimal solution; (b) Fault perpendicular components. Error bars show 1-σ uncertainties; (c) The sampled s parameter in Eq.(1). |
其中,v为平行于断层的速率,x为台站与断层的垂直距离,d为闭锁深度,s为闭锁深度之下的蠕滑速率,A为常系数.利用蒙特卡罗方法,我们对图 3a的速度剖面用公式(1)进行拟合,结果如图中灰色曲线所示.蒙特卡罗方法对s参数的采样如图 3c所示,得到平行于鄂拉山断裂的深部滑动速率约为4.7 mm·a-1.由于GPS观测的垂直分量含有较大误差,并且研究区域的断层以走滑为主,本研究只利用GPS速度的水平分量.另外,图 3的速度剖面也显示,平行于鄂拉山断裂的日月山断裂,右旋走滑速率不明显,因此,研究中没有考虑其局部影响作用.
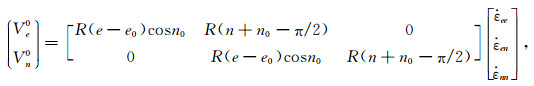
2 研究方法 2.1 正演模型参考前人对地壳形变的认识(McCaffrey et al., 2007),GPS在地表的观测值可分解为块体整体平移分量、地壳内部应变分量和断层闭锁作用产生的局部形变(back-slip):

|
(2) |
其中,

|
(3) |
(3) 式中的(e0, n0)为假设应变为0的参考点,(e, n)为GPS站点的经纬度坐标,R是地球半径(Meade and Loveless, 2009).
V断层滑动是断层面蠕滑/闭锁在地表产生的速度分量,可根据位错模型计算,V断层滑动=Gn×mbm×1,其中b为断层面的滑动速率,G为格林函数,n为地表观测点个数,m为断层面离散化后小断层的个数.在给定断层几何参数的条件下,可通过弹性半空间的解析解(Okada, 1992;Meade, 2007)或数值解(Aagaard et al., 2013)来计算.综上所述,本研究所涉及的模型参数空间为θ(m+5)×1={Ve1, Vn1, 
大地测量数据(如GPS、InSAR)被广泛应用于地壳形变的研究中,数据反演理论、方法也随之应用于火山形变、地震形变、冰层负荷变化、含水层储存变化以及地热开采等引发地壳形变的地球物理过程中(Elliott et al., 2016;Bagnardi and Hooper, 2018).常用的反演方法,如最小二乘法通过最小化观测值和模拟值之间的残差来确定最佳参数.尽管该算法在诸多反演模型中被广泛应用(Sambridge and Mosegaard, 2002),然而,反演是多维、不确定的问题,所以直接搜索的方法并不能完全刻画反演参数的多解特征.近年来,贝叶斯方法被广泛应用到断层运动学(Minson et al., 2013;Wang et al., 2014;Jolivet et al., 2015;Bagnardi and Hooper, 2018)和动力学的物理建模中(Wang, 2018).
针对2.1节中描述的运动学模型,本文假定模型误差(e)只与数据的观测误差(Σd)有关,且服从高斯分布,e~N(0, Σd).那么,根据贝叶斯理论,在给定模型参数θ条件下,模型与观测数据之间的似然函数为

|
(4) |
其中以y作为GPS的观测值,V(θ)为模拟的地表形变,则误差e=y-V(θ).
根据物理上合理的取值范围(如,[A,B]),定义先验函数

|
(5) |
为描述断层蠕滑和闭锁状态沿断层走向的变化,往往把断层面离散化成很多小单元,从而导致反演问题欠定,由此引入断层滑动满足平滑特征的先验信息Lb~N(0, α2I),其中L是m×m的拉普拉斯矩阵,I是单位矩阵,α2称为超参数(Fukuda and Johnson, 2008;Wang, 2018),体现了拉普拉斯算子的平滑程度.当α2较小时,拉普拉斯算子对断层面滑动分布有强约束,产生较平滑的结果;反之,为弱约束,断层滑动有强的不均匀特征.因此定义关于断层滑动分布(b)的先验函数为

|
(6) |
根据贝叶斯定理(Daston, 1995),后验概率密度函数(Posterior Probability Density Functions,PDFs)为

|
(7) |
针对所构建的后验概率密度函数,本文采用马尔科夫链蒙特卡罗方法(MCMC)对参数空间进行采样.通过构建模型参数的样本空间,获得满足观测数据和建模条件的最优解及其误差分布.该方法是一种非线性算法,它基于马尔科夫链和Metropolis-Hastings准则建立目标函数的样本空间.MCMC方法,首先以随机产生的初始值θ0计算后验概率密度函数,然后在(θ0-Δθ,θ+Δθ)之间重新产生一个随机数θ′作为试验值,其中Δθ是MCMC的采样步长.如果

|
图 4 (a) 后验概率密度的对数随MCMC迭代次数增加的变化;(b) MCMC采样的深部滑动速率分布;(c)当深部滑动速率为5.0 mm·a-1时,MCMC采样得到的闭锁深度分布 Fig. 4 (a) The logarithm of the posterior probability density as a function of the number of MCMC iterations; (b) Histogram of the deep slip rate obtained from the MCMC sampling; (c) Locking depth distribution with 5.0 mm·a-1 of deep slip rate obtained from the MCMC sampling |

|
图 5 (a) MCMC采样得到的东西向的整体位移速率,(b)南北向的整体位移速率,(c)东西向的内部应变率,(d)南北向的内部应变率,(e)剪应变率 Fig. 5 (a) The common mode motion of the east component obtained by MCMC sampling, (b) the common mode motion of the north component, (c) internal strain rate in the east-west direction, (d) internal strain rate in the north-south direction, (e) shear strain rate |
考虑到研究区域的GPS观测台网,尤其是断层近场,相对稀疏,对断层运动状态的约束能力有限,本研究采用从低阶到高阶的逐步建模思路.在可靠低阶建模的基础上,再进一步通过高阶模型,理解断层更为详细的运动状态.基于以往的地质/地球物理调查以及GPS速度场分布(Yuan et al., 2011;Zheng et al., 2013;袁道阳,2003),我们尝试了用区域地震活动来粗略约束断层的倾角,但遗憾的是,该地区仪器记录以来的地震事件太少,无法提供有效信息.另外,目前的GPS台网观测密度,也不足以解析断层的倾角.因此,参考了其他学者的模型研究(Loveless and Meade, 2011;Wang et al., 2017b),采用了简化的直立断层.由于本文所用的GPS台站离断层面比较远,对断层深部的几何差异并不敏感,因此本研究简化鄂拉山断层为直立走滑型断层(Loveless and Meade, 2011;Wang et al., 2017b;李煜航,2018),并且在建模中也仅考虑走滑分量.
3.1 均匀断层滑动模型
在均匀断层滑动建模中,只考虑断层的深部滑动速率(S)和闭锁深度(Z),而不考虑可能存在的断层闭锁状态沿走向的变化.同时,考虑稳定欧亚框架下,研究区域的整体运动速率(Ve1, Vn1)和在长期构造加载作用下的区域内部应变率(
图 4a给出MCMC采样过程,可以看出,经过~102次迭代之后,生成样本的后验概率密度(图中的log-PDF为取对数后的值)达到高值,且趋于稳定,说明优化过程经过102次迭代之后,开始收敛到模型最优解.
采样得到的深部断层滑动速率分布,如图 4b所示,它接近于一个均值为5,标准偏差为1.5的正态分布,也说明观测数据对断层深部滑动速率的约束较好.在深部滑动速率为5 mm·a-1条件下,断层的闭锁深度为15.0±5.5 km(见图 4c).研究得到在稳定欧亚框架下,研究区域的整体运动速率为向东9.4±0.2 mm·a-1(图 5a)和向北4.5±0.2 mm·a-1 (图 5b),反映了在印度板块向北推挤作用下,鄂拉山区域的运动状态.研究区域的内部应变率结果见图 5c—5e,我们得到东西方向的应变率为(-0.54±0.21)×10-9,南北方向的应变率为(-1.18±0.30)×10-9,剪应变率为(-2.07±0.19)×10-9.由此得到的主应变率沿北东-南西方向(如图 2a品红色箭头所示),反映了在印度板块向欧亚大陆俯冲作用下,青藏高原东北缘沿北东-南西方向的缩短.
我们根据反演得到的最优解为θ={9.4 mm·a-1,4.5 mm·a-1,-0.54×10⁻⁹,-1.18×10⁻⁹,-2.07×10-9,5.0 mm·a-1,15.0 km}, 模型可以比较好地解释GPS观测数据,计算的VR值(Variance Reduction)约为98.3%,其中

该部分的建模重点是刻画断层滑动/闭锁状态沿走向的变化,因此,我们采用3.1节中低自由度均匀建模得到的区域整体平移、内部应变率和深部滑动速率,仅反演断层浅部的滑动和闭锁分布.反演得到的最优滑动分布如图 6a所示,可以看出沿断层走向的明显变化.整体而言,在鄂拉山断裂的中段,断层发生弯曲的位置,滑动速率比较小,约为1~2 mm·a-1,南段和北段的滑动速率稍大,约为3~4 mm·a-1.图 6b给出了根据模拟的样本(参见图 6a中的直方图)确定的模型误差分布.很显然,除了断层中部位置,现有的观测数据对断层滑动的约束较好外,南段和北段的断层滑动都有较大的误差,显示出现有GPS观测台网对这些位置的约束能力有限.我们的最优模型产生的地表速率场,如图 2a中红色箭头所示,可以发现模拟值与观测值有很好的一致性.对观测值与模拟值之间计算GPS站点拟合残差分布,根据图 2a中蓝色箭头,可以看出残差方向具有随机性.同时分析残差的直方图(图 2b),可以看出残差属于高斯分布,说明该残差不是本文的模型导致的.同时,由于模型假设的条件是地壳属于均匀介质,没有考虑介质不均匀性、形变不均匀性等因素,这在一定程度上增加了反演结果的误差(张希等,2013).

|
图 6 (a) 反演得到最优断层滑动分布,蓝色圆圈标识Yuan等(2011)进行地质调查的位置,蓝色直方图为该位置断层滑动速率的MCMC采样结果;(b)滑动速率的不确定性分布 Fig. 6 (a) The optimal fault slip distribution from inversion. The blue circle shows the position of the geological survey by Yuan et al. (2011), and the blue histogram is the MCMC sampling result of the fault slip rate. (b) The distribution of fault slip rate uncertainties |
根据断层面上的滑动状态(b)和远场构造加载速率(b0),我们可以进一步计算断层的闭锁系数(interseismic fault coupling, ISC= 
同时,为了进一步考察上述建模结果的可靠性,本研究也基于Yu等(2019)较新的1998—2018年中国大陆GPS速度场,转换到和Zheng等(2017)同一参考框架下,采用前文所述同样的建模方法,分析鄂拉山断层滑动状态.结果表明(参见附图 2),断层面的深部滑动速率为4.6±1.5 mm·a-1,在鄂拉山断裂的中段,滑动速率约为1~2 mm·a-1,南段和北段的滑动速率稍大,约为2.5~3.5 mm·a-1.沿着断层走向具有明显的走滑闭锁特征,与基于Zheng等(2017)的GPS数据的建模结果基本一致.

|
图 附图 2 基于Yu等(2019)数据反演得到的最优滑动分布 Fig. 附图 2 The optimal fault slip distribution determined based on Yu et al. (2019) |
本研究基于近二十年GPS观测速度场,采用贝叶斯反演方法,研究得到鄂拉山断层的整体右旋走滑速率为5.0±1.5 mm·a-1,其反映了断层受到的远场构造加载速率.在浅部的孕震层,有明显沿断层走向的闭锁状态变化.在断层中部位置,由于断层发生弯曲,形成一个凹凸体,从而断层发生强闭锁.本研究得到的鄂拉山断层5.0±1.5 mm·a-1右旋走滑速率,与袁道阳(2003)早期得到的断裂晚更新世以来右旋走滑速率4.1±0.9 mm·a-1的结果相当,同时也与Wang和Burchfiel(2004)计算得到~4 mm·a-1的结果接近.
最近的一项研究,Yuan等(2011)通过地貌位错和测年的方式将该断裂的滑动速率修正为1.1±0.3 mm·a-1,与本研究的结果存在较大的差异.但我们通过详细分析发现,Yuan等(2011)的测点位置位于本研究的强闭锁区.图 6a中的蓝色圆圈标记Yuan等(2011)的测量点,本研究得到该点的滑动速率值为2.2±1.0 mm·a-1,接近于Yuan等(2011)野外地质调查的1.1±0.3 mm·a-1,同时根据图 6a中的直方图可以发现,该点的采样结果接近标准正态分布,表明较强的收敛性,说明观测台网对断层的中部有较好的约束能力.所以,考虑二者在时间尺度上的差异,地质学方法获取的断层上万年尺度的平均滑动速率与大地测量学的近二十年尺度平均滑动速率,两个研究结果并不相悖.
前人基于大地测量数据,针对大区域(如整个中国大陆或整个青藏高原东北缘)的研究,也提供了一些鄂拉山断层的滑动速率结果,但结果不尽相同.如王敏等(2003)基于早期的GPS数据对整个中国大陆的主要断裂带进行建模,估算鄂拉山断裂的平均滑动速率为~4 mm·a-1.Loveless和Meade(2011)采用1998—2007年的GPS数据,针对整个青藏高原进行运动学建模,得到鄂拉山断裂在北段的走滑速率为1.0±0.8 mm·a-1、在南段为4.2±0.4 mm·a-1.然而,Li等(2018)基于同样的GPS数据,研究了青藏高原东北缘的断层活动,得到鄂拉山的滑动速率仅为1.6 mm·a-1.Wang等(2017b)采用1998—2015年更密集的GPS数据,研究了整个青藏高原的断层滑动状态,得到该断裂的滑动速率为3.2±0.2~2.5±0.2 mm·a-1.这些结果之间很大的差异,主要归结为以下两方面原因:(1)由于研究区域大,这些工作的断层滑动建模都是基于各自差异的块体模型,不同的区域块体考虑,必然对断层滑动模拟结果有很大的影响;(2)反演的多解性是客观存在的,因此,这也警示我们在建模的过程中,如何一方面刻画多解性,另一方面尽可能降低多解性,使结果较为可靠.
针对第一个问题,本研究只考虑了鄂拉山的局部区域,从而避免了以往研究中由于块体划分带来的不确定性.虽然,研究区域包括日月山断层,但图 3的结果显示,日月山断层的滑动速率很小;虽然鄂拉山断裂被海原断裂和昆仑山断裂所夹持,但本研究在选取GPS台站的时候,尽可能远离这两个断裂.虽然所选取的台站中,涉及了两个分别距海原断裂和昆仑山断裂相对较近的台站,它们均距鄂拉山断层有上百公里.有效约束断层面上孕震层的蠕滑/闭锁状态的测站,主要是位于断层两侧约2~3倍的闭锁深度范围内(Shen et al., 2005).对于鄂拉山断层,约为距50 km的范围.因此,该四个距离鄂拉山断裂较远的台站主要在约束区域内部应变率和鄂拉山断层两侧块体的相对运动(也即本研究得到的~5 mm·a-1深部滑动速率)起作用.因此,周围断层对本研究中鄂拉山断层的建模,影响不大.针对有关反演多解性的问题,本研究一方面采用贝叶斯方法,构建模型参数的样本空间,客观描述了反演结果的多解特征.另一方面,采用从低阶模型到高阶模型的建模思路,从而,保证了有限数据所约束的低阶模型结果的稳定性,既降低高阶模型的自由度,提高结果的可靠性;又保证低阶和高阶模型之间结果的一致性.
4.2 对区域GPS台站优化增设的建议鄂拉山地区目前的GPS观测台站比较稀疏,对断层滑动状态的约束能力有限.根据图 6b的模型误差,很显然除了断层中部断层滑动的约束较好外,断层的南段和北段的模型误差都较大.为了便于后续的研究,更有效地开展针对断层滑动状态的观测,本研究尝试提出GPS台站优化增设的方案.求解断层滑动可以表示为如下的线性问题:

|
(8) |
在给定α2时,断层滑动的解析解为(Wang et al., 2014):

|
(9) |
其中y是GPS的观测值,Σy-1是y的协方差矩阵,G是格林函数.同时滑动速率

|
(10) |
Σb1/2的对角线元素是
(1) 对研究区域,均匀分布0.1°间距的虚拟GPS台站;
(2) 对于每个虚拟台站,计算在现有台网基础上增加该台站后的F值;
(3) 从所有虚拟台站中,找到最小F值对应的台站,作为最有效的台站增设位置;
(4) 用类似的办法,找到后续的台站增设位置.
对鄂拉山地区的研究结果如图 8和9所示.图 8显示,随着台站增加,滑动模型的标准差减小.当增加前5个台站时(相应的台站位置见表 1),标准差减少最快,之后标准差下降减缓.图 9a, 9b, 9c示例性地给出第一、第二和第三个优化增设台站位置,及其相应的增设台站后断层滑动标准差分布.随着台站的增多,滑动误差逐渐降低.图 9d为增设30个台站的分布,显而易见,此时的台网对整条断层都有良好的约束.

|
图 8 (a) 断层滑动的平均标准差随增设台站数量的变化;(b)断层面上标准差减少速率随增设台站数量的变化 Fig. 8 (a) The average standard deviation of fault slip as a function of the number of stations added; (b) The decrease rate of the standard deviation on the fault plane as a function of the number of stations added |

|
图 9 优化增设GPS台站的分布 等值线图显示增加各虚拟台站(0.1°间距网格)时,断层滑动标准差F值分布,以及根据最小F值得到(浅蓝色三角标识)的最佳增设台站位置:(a)第1个;(b)第2个;(c)第3个.相应的断层面上滑动标准差分布也在其下方给出.(d)当增设30个台站时的结果.黑色三角形为现有的GPS台站,蓝色三角形为优化台站增设位置. Fig. 9 The distribution of optimized GPS stations The contours show the distribution of the standard deviation F value of the fault slip when adding each virtual station (0.1 pitch grid), and the optimal station location based on the minimum F value (light blue triangle): (a) 1st; (b) 2nd; (c) 3rd. The corresponding standard deviation of the slip on the fault plane are given below. (d) The result when 30 stations are added. Black triangles show the existing GPS stations, and blue triangles show the optimized stations. |
|
|
表 1 GPS台站优化增设位置 Table 1 The proposed locations for new GPS stations |
地震是断层面上凹凸体位置产生弹性应变能积累,在达到断层强度极限后发生快速能量释放的结果,定量估算断层面的滑动亏损,即等效地震矩,是评估断裂地震潜能的有效方式(Cavalié et al., 2008).根据反演得到的断层面的震间滑动分布(图 6a),可计算地震矩积累率M0=ΣμsA,其中μ为岩石的剪切模量(取30 GPa),s是断层面上的滑动亏损率,A是断层面的面积.对于本研究得到的凹凸体(图 7中的虚线框标记),我们计算得到该凹凸体的矩积累率为M0=2.35×10¹⁷N·m/a,等效于MW5.6的地震.根据图 7的区域地震活动分布,该区域的整体地震水平偏低,尤其是断层闭锁的部位,有一个明显的空区,意味着由于断层强闭锁而形成了能量积累.因此,该断裂的地震危险性值得引起关注.
5 结论本研究利用青藏高原东北缘的GPS速度场数据,在贝叶斯理论的框架下,采用MCMC迭代算法,对鄂拉山断裂的现今滑动速率及震间闭锁状态进行了研究,取得如下认识:
(1) 反演得到断层的整体平均闭锁深度为15 km;鄂拉山断裂以右旋走滑为主,在15 km深度以上,断裂中段的滑动速率约为2 mm·a-1;南段和北段的滑动速率稍大,约为3 mm·a-1;断层所受的构造加载速率为5.0±1.5 mm·a-1.
(2) 鄂拉山断裂的震间闭锁沿走向呈不均匀分布,断裂中段处于强闭锁状态,闭锁系数达到0.6~0.7,意味着该段可能由于断层几何形态的改变,形成一个凹凸体而发生强闭锁;南段和北段蠕滑性质较强,闭锁系数仅为0.2~0.3.
(3) 根据断层面的滑动/闭锁状态,得到了断裂中段凹凸体上的地震矩积累率是M0=2.35×1017N·m/a,等同于MW5.6的地震.鉴于该地区现今较低的地震活动水平,鄂拉山断裂的地震危险性值得关注.
(4) 根据断层面上的滑动标准差,我们进行了增设GPS台站的优化设计.对于鄂拉山断层,当增加5个台站的时候,断层面上的滑动误差下降最快;该GPS台网优化布设方法,有一定普适性,可应用其他地区的台网优化设计.
附录 分辨率测试为了更详细地了解沿断层走向的运动状态变化,我们尝试建立沿走向变化的断层滑动模型.为此,通过棋盘测试,来检验GPS观测台网对整个断层的解析能力.类似于前人的研究,我们首先对断层面上的每个小单元的滑移值赋予0 m和1 m相间分布(棋盘分布)的初始值作为检验的输入值.选取15 km作为闭锁深度,并设定闭锁深度以下的断层滑动为1 m.初始断层滑动见附图 1所示黑色点的位置,断层滑动为1 m,其余地方为0 m.该断层滑动,刻画了57 km尺度的滑动/闭锁/凹凸体,被进一步用来模拟地表速度场.

|
图 附图 1 棋盘测试 黑色的点表示对应的输入的初始滑移值为1 m,没有黑点的地方为0 m,颜色代表基于输入模型产生的地表速度场的反演结果. Fig. 附图 1 Checkerboard test Black dots indicate the initial slip value (1 m), and the region where no black dots is 0 m of slip. The background color represents the inversion results of the surface velocities, which are generated from the input model. |
基于模拟的地表速度场,我们反演得到的最优滑动分布如附图 1中颜色所示,表现出反演结果和输入模型的良好一致性.因此,现有的GPS台网对57 km或者更大尺度的凹凸体或者蠕滑区,有一定的解析能力.
致谢 感谢所有参与GPS数据收集的工作人员,三位匿名审稿专家给出了很好的修改建议和意见,本文部分图件由GMT软件绘制(Wessel and Smith, 1998).
Aagaard B T, Knepley M G, Williams C A. 2013. A domain decomposition approach to implementing fault slip in finite-element models of quasi-static and dynamic crustal deformation. Journal of Geophysical Research:Solid Earth, 118(6): 3059-3079. DOI:10.1002/jgrb.50217 |
Bagnardi M, Hooper A. 2018. Inversion of surface deformation data for rapid estimates of source parameters and uncertainties:A Bayesian approach. Geochemistry, Geophysics, Geosystems, 19(7): 2194-2211. DOI:10.1029/2018GC007585 |
Bedford J, Moreno M, Li S Y, et al. 2016. Separating rapid relocking, afterslip, and viscoelastic relaxation:An application of the postseismic straightening method to the Maule 2010 cGPS. Journal of Geophysical Research:Solid Earth, 121(10): 7618-7638. DOI:10.1002/2016JB013093 |
Bowman D, King G, Tapponnier P. 2003. Slip partitioning by elastoplastic propagation of oblique slip at depth. Science, 300(5622): 1121-1123. DOI:10.1126/science.1082180 |
Cavalié O, Lasserre C, Doin M P, et al. 2008. Measurement of interseismic strain across the Haiyuan fault (Gansu, China), by InSAR. Earth and Planetary Science Letters, 275(3-4): 246-257. DOI:10.1016/j.epsl.2008.07.057 |
Daston L. 1995. Classical Probability in the Enlightenment. Princeton, NJ: Princeton University Press.
|
Deng Q D, Gao X, Yang H. 2009. Fault-block tectonics, active fault-block tectonics and earthquake activity. Chinese Journal of Geology (in Chinese), 44(4): 1083-1093. |
Deng Q D, Zhang P Z, Ran Y K, et al. 2002. Basic characteristics of active tectonics of China. Science in China Series D:Earth Sciences (in Chinese), 32(12): 1020-1030. |
Duvall A R, Clark M K. 2010. Dissipation of fast strike-slip faulting within and beyond northeastern Tibet. Geology, 38(3): 223-226. DOI:10.1130/G30711.1 |
Elliott J R, Walters R J, Wright T J. 2016. The role of space-based observation in understanding and responding to active tectonics and earthquakes. Nature Communications, 7(1): 13844. DOI:10.1038/ncomms13844 |
Fukuda J I, Johnson K M. 2008. A fully Bayesian inversion for spatial distribution of fault slip with objective smoothing. Bulletin of the Seismological Society of America, 98(3): 1128-1146. DOI:10.1785/0120070194 |
Gan W J, Zhang P Z, Shen Z K, et al. 2007. Present-day crustal motion within the Tibetan Plateau inferred from GPS measurements. Journal of Geophysical Research:Solid Earth, 112(B8): B08416. DOI:10.1029/2005JB004120 |
Gaudemer Y, Tapponnier P, Meyer B, et al. 1995. Partitioning of crustal slip between linked, active faults in the eastern Qilian Shan, and evidence for a major seismic gap, the 'Tianzhu gap', on the western Haiyuan Fault, Gansu (China). Geophysical Journal International, 120(3): 599-645. DOI:10.1111/j.1365-246X.1995.tb01842.x |
Guo P, Han Z J, Mao Z B, et al. 2019. Paleoearthquakes and rupture behavior of the Lenglongling fault:implications for seismic hazards of the northeastern Margin of the Tibetan Plateau. Journal of Geophysical Research:Solid Earth, 124(2): 1520-1543. DOI:10.1029/2018JB016586 |
Hamiel Y, Piatibratova O, Mizrahi Y. 2016. Creep along the northern Jordan Valley section of the Dead Sea Fault. Geophysical Research Letters, 43(6): 2494-2501. DOI:10.1002/2016GL067913 |
Hao M, Li Y H, Qin S L. 2017. Spatial and temporal distribution of slip rate deficit across Haiyuan-Liupan Shan fault zone constrained by GPS data. Seismology and Geology (in Chinese), 39(3): 471-484. |
He J K, Chéry J. 2008. Slip rates of the Altyn Tagh, Kunlun and Karakorum faults (Tibet) from 3D mechanical modeling. Earth and Planetary Science Letters, 274(1-2): 50-58. DOI:10.1016/j.epsl.2008.06.049 |
Jiang G Y, Xu X W, Chen G H, et al. 2015. Geodetic imaging of potential seismogenic asperities on the Xianshuihe-Anninghe-Zemuhe fault system, southwest China, with a new 3-D viscoelastic interseismic coupling model. Journal of Geophysical Research:Solid Earth, 120(3): 1855-1873. DOI:10.1002/2014JB011492 |
Jolivet R, Lasserre C, Doin M P, et al. 2012. Shallow creep on the Haiyuan fault (Gansu, China) revealed by SAR interferometry. Journal of Geophysical Research:Solid Earth, 117(B6): B06401. DOI:10.1029/2011JB008732 |
Jolivet R, Lasserre C, Doin M P, et al. 2013. Spatio-temporal evolution of aseismic slip along the Haiyuan fault, China:Implications for fault frictional properties. Earth and Planetary Science Letters, 377-378: 23-33. DOI:10.1016/j.epsl.2013.07.020 |
Jolivet R, Simons M, Agram P S, et al. 2015. Aseismic slip and seismogenic coupling along the central San Andreas Fault. Geophysical Research Letters, 42(2): 297-306. DOI:10.1002/2014GL062222 |
Kirby E, Harkins N, Wang E Q, et al. 2007. Slip rate gradients along the eastern Kunlun fault. Tectonics, 26(2): TC2010. DOI:10.1029/2006TC002033 |
Li Q, Tan K, Zhao B, et al. 2019. Slip rate change of East Kunlun fault and its stress effect on 2017 Jiuzhaigou earthquake. Chinese Journal of Geophysics (in Chinese), 62(3): 912-922. DOI:10.6038/cjg2019M0302 |
Li Y C, Shan X J, Song X G, et al. 2016. Fault locking and slip rate deficit on the middle and southern segment of the Tancheng-Lujiang fault inverted from GPS data. Chinese Journal of Geophysics (in Chinese), 59(11): 4022-4034. DOI:10.6038/cjg20161108 |
Li Y C, Shan X J, Qu C Y, et al. 2017. Elastic block and strain modeling of GPS data around the Haiyuan-Liupanshan fault, northeastern Tibetan Plateau. Journal of Asian Earth Sciences, 150: 87-97. DOI:10.1016/j.jseaes.2017.10.010 |
Li Y H. 2018. Study on the lateral motion of northeastern Tibetan Plateau[Ph. D. thesis] (in Chinese). Beijing: Institute of Geology, China Earthquake Administration.
|
Li Y H, Cui D X, Hao M. 2015. GPS-constrained inversion of slip rate on major active faults in the northeastern margin of Tibet Plateau. Earth Science-Journal of China University of Geosciences (in Chinese), 40(10): 1767-1780. DOI:10.3799/dqkx.2015.158 |
Li Y H, Liu M, Wang Q L, et al. 2018. Present-day crustal deformation and strain transfer in northeastern Tibetan Plateau. Earth and Planetary Science Letters, 487: 179-189. DOI:10.1016/j.epsl.2018.01.024 |
Li Y X, Li S P, Wang S L, et al. 2011. Geochemical characteristics and tectonic environment of the continental facies volcanic rocks in Elashan Area, Qinghai Province. Northwestern Geology (in Chinese), 44(4): 23-32. |
Liu-Zeng J, Klinger Y, Xu X, et al. 2007. Millennial recurrence of large earthquakes on the Haiyuan fault near Songshan, Gansu Province, China. Bulletin of the Seismological Society of America, 97(1B): 14-34. DOI:10.1785/0120050118 |
Loveless J P, Meade B J. 2011. Partitioning of localized and diffuse deformation in the Tibetan Plateau from joint inversions of geologic and geodetic observations. Earth and Planetary Science Letters, 303(1-2): 11-24. DOI:10.1016/j.epsl.2010.12.014 |
McCaffrey R, Qamar A I, King R W, et al. 2007. Fault locking, block rotation and crustal deformation in the Pacific Northwest. Geophysical Journal International, 169(3): 1315-1340. DOI:10.1111/j.1365-246X.2007.03371.x |
Meade B J. 2007. Algorithms for the calculation of exact displacements, strains, and stresses for triangular dislocation elements in a uniform elastic half space. Computers & Geosciences, 33(8): 1064-1075. |
Meade B J, Loveless J P. 2009. Block modeling with connected fault-network geometries and a linear elastic coupling estimator in spherical coordinates. Bulletin of the Seismological Society of America, 99(6): 3124-3139. DOI:10.1785/0120090088 |
Minson S E, Simons M, Beck J L. 2013. Bayesian inversion for finite fault earthquake source models I-Theory and algorithm. Geophysical Journal International, 194(3): 1701-1726. DOI:10.1093/gji/ggt180 |
Molnar P, Tapponnier P. 1975. Cenozoic tectonics of Asia:effects of a continental collision:features of recent continental tectonics in Asia can be interpreted as results of the India-Eurasia collision. Science, 189(4201): 419-426. DOI:10.1126/science.189.4201.419 |
Moreno M, Haberland C, Oncken O, et al. 2014. Locking of the Chile subduction zone controlled by fluid pressure before the 2010 earthquake. Nature Geoscience, 7(4): 292-296. DOI:10.1038/ngeo2102 |
Okada Y. 1992. Internal deformation due to shear and tensile faults in a half-space. Bulletin of the Seismological Society of America, 82(2): 1018-1040. |
Sambridge M, Mosegaard K. 2002. Monte Carlo methods in geophysical inverse problems. Reviews of Geophysics, 40(3): 3-1. |
Savage J C, Burford R O. 1973. Geodetic determination of relative plate motion in central California. Journal of Geophysical Research, 78(5): 832-845. DOI:10.1029/JB078i005p00832 |
Savage J C. 1983. A dislocation model of strain accumulation and release at a subduction zone. Journal of Geophysical Research:Atmospheres, 88(B6): 4984-4996. DOI:10.1029/JB088iB06p04984 |
Shen Z K, Lv J N, Wang M, et al. 2005. Contemporary crustal deformation around the southeast borderland of the Tibetan Plateau. Journal of Geophysical Research:Solid Earth, 110(B11): B11409. DOI:10.1029/2004JB003421 |
Tapponnier P, Xu Z Q, Roger F, et al. 2001. Oblique stepwise rise and growth of the Tibet Plateau. Science, 294(5547): 1671-1677. DOI:10.1126/science.105978 |
Van Der Woerd J, Ryerson F J, Tapponnier P, et al. 1998. Holocene left-slip rate determined by cosmogenic surface dating on the Xidatan segment of the Kunlun fault (Qinghai, China). Geology, 26(8): 695-698. DOI:10.1130/0091-7613(1998)026<0695:HLSRDB>2.3.CO;2 |
Wang E, Burchfiel B C. 2004. Late Cenozoic right-lateral movement along the Wenquan fault and associated deformation:Implications for the kinematic history of the Qaidam Basin, northeastern Tibetan Plateau. International Geology Review, 46(10): 861-879. DOI:10.2747/0020-6814.46.10.861 |
Wang L F, Hainzl S, Zöller G, et al. 2012. Stress-and aftershock-constrained joint inversions for coseismic and postseismic slip applied to the 2004 M6.0 Parkfield earthquake. Journal of Geophysical Research:Solid Earth, 117(B7): B07406. DOI:10.1029/2011JB009017 |
Wang L F, Zöller G, Hainzl S. 2014. Joint determination of slip and stress drop in a Bayesian inversion approach:a case study for the 2010 M8.8 Maule earthquake. Pure and Applied Geophysics, 172(2): 375-388. |
Wang L F, Hainzl S, Mai P M. 2017a. To which level did the 2010 M8.8 Maule earthquake fill the pre-existing seismic gap?. Geophysical Journal International, 211(1): 498-511. DOI:10.1093/gji/ggx304 |
Wang L F. 2018. The Next M~6 event in Parkfield implied by a physical model linking interseismic, coseismic, and postseismic phase. Journal of Geophysical Research:Solid Earth, 123(10): 8858-8873. DOI:10.1029/2018JB015493 |
Wang M, Shen Z K, Niu Z J, et al. 2003. Present-day crustal movement and tectonic deformation in China continent. Sciences in China Series D: Earth Sciences, 45(10): 865-874. |
Wang Q, Zhang P Z, Freymueller J T, et al. 2001. Present-day crustal deformation in China constrained by global positioning system measurements. Science, 294(5542): 574-577. DOI:10.1126/science.1063647 |
Wang W, Qiao X J, Yang S M, et al. 2017b. Present-day velocity field and block kinematics of Tibetan Plateau from GPS measurements. Geophysical Journal International, 208(2): 1088-1102. DOI:10.1093/gji/ggw445 |
Wessel P, Smith W H F. 1998. New, improved version of generic mapping tools released. Eos, Transactions American Geophysical Union, 79(47): 579-579. DOI:10.1029/98EO00426 |
Yu J S, Tan K, Zhang C H, et al. 2019. Present-day crustal movement of the Chinese mainland based on Global Navigation Satellite System data from 1998 to 2018. Advances in Space Research, 63(2): 840-856. DOI:10.1016/j.asr.2018.10.001 |
Yuan D. 2003. Tectonic deformation features and space-time evolution in northeastern margin of the Qinghai-Tibetan Plateau since the late Cenozoic time[Ph. D. thesis] (in Chinese). Beijing: Institute of Geology, China Earthquake Administration.
|
Yuan D Y, Champagnac J D, Ge W P, et al. 2011. Late quaternary right-lateral slip rates of faults adjacent to the lake Qinghai, northeastern margin of the Tibetan Plateau. GSA Bulletin, 123(9-10): 2016-2030. DOI:10.1130/B30315.1 |
Zhang X, Hao M, Jia P, et al. 2013. Inversion of negative dislocation for GPS horizontal movement and features of strain accumulation in main tectonic areas of China. Journal of Seismological Research (in Chinese), 36(1): 1-8. |
Zhao J, Jiang Z S, Niu A F, et al. 2015. Study on dynamic characteristics of fault locking and fault slip deficit in the eastern boundary of the Sichuan-Yunnan rhombic block. Chinese Journal of Geophysics (in Chinese), 58(3): 872-885. |
Zheng G, Wang H, Wright T J, et al. 2017. Crustal deformation in the India-Eurasia collision zone from 25 Years of GPS measurements. Journal of Geophysical Research:Solid Earth, 122(11): 9290-9312. DOI:10.1002/2017JB014465 |
Zheng W J, Zhang P Z, He W G, et al. 2013. Transformation of displacement between strike-slip and crustal shortening in the northern margin of the Tibetan Plateau:Evidence from decadal GPS measurements and late Quaternary slip rates on faults. Tectonophysics, 584: 267-280. DOI:10.1016/j.tecto.2012.01.006 |
Zhou D M. 2005. A study on crustal deformation based on GPS data in the northeastern margin of the Qinghai-Tibetan Plateau[Master's thesis] (in Chinese). Beijing: China Earthquake Administration.
|
邓起东, 张培震, 冉勇康, 等. 2002. 中国活动构造基本特征. 中国科学(D辑:地球科学), 32(12): 1020-1030. |
邓起东, 高翔, 杨虎. 2009. 断块构造、活动断块构造与地震活动. 地质科学, 44(4): 1083-1093. DOI:10.3321/j.issn:0563-5020.2009.04.005 |
郝明, 李煜航, 秦姗兰. 2017. 基于GPS数据的海原-六盘山断裂带滑动速率亏损时空分布. 地震地质, 39(3): 471-484. DOI:10.3969/j.issn.0253-4967.2017.03.003 |
李彦川, 单新建, 宋小刚, 等. 2016. GPS揭示的郯庐断裂带中南段闭锁及滑动亏损. 地球物理学报, 59(11): 4022-4034. DOI:10.6038/cjg20161108 |
李永祥, 李善平, 王树林, 等. 2011. 青海鄂拉山地区陆相火山岩地球化学特征及构造环境. 西北地质, 44(4): 23-32. DOI:10.3969/j.issn.1009-6248.2011.04.004 |
李琦, 谭凯, 赵斌, 等. 2019. 东昆仑断裂滑动速率变化及其对2017年九寨沟地震的应力加载. 地球物理学报, 62(3): 912-922. DOI:10.6038/cjg2019M0302 |
李煜航, 崔笃信, 郝明. 2015. 利用GPS数据反演青藏高原东北缘主要活动断裂滑动速率. 地球科学——中国地质大学学报, 40(10): 1767-1780. |
李煜航. 2018.青藏高原东北横向扩展运动研究[博士论文].北京: 中国地震局地质研究所.
|
王敏, 沈正康, 牛之俊, 等. 2003. 现今中国大陆地壳运动与活动块体模型. 中国科学(D辑), 33(S1): 21-32. |
袁道阳. 2003.青藏高原东北缘晚新生代以来的构造变形特征与时空演化[博士论文].北京: 中国地震局地质研究所.
|
张希, 郝明, 贾鹏, 等. 2013. 全国主要构造区GPS水平运动负位错反演与应变积累特性. 地震研究, 36(1): 1-8. |
赵静, 江在森, 牛安福, 等. 2015. 川滇菱形块体东边界断层闭锁程度与滑动亏损动态特征研究. 地球物理学报, 58(3): 872-885. |
周德敏. 2005.青藏高原东北缘现今地壳形变的GPS观测研究[硕士论文].北京: 中国地震局地质研究所.
|