 2018, Vol. 61


2. 中国科学院大学, 北京 100049
 最小,中高纬地区水平波长、垂直波长随纬度增加大致有减小的趋势,库尔勒地区偏离这一趋势,波长偏大.
2. University of Chinese Academy of Sciences, Beijing 100049, China
is smallest over Korla compared with other sites. And there is a trend that horizontal (vertical) wavelength decreases with increasing latitude in mid and high latitudes, but the relatively longer wavelength over Korla deviates from this trend.大气重力波产生、传播、饱和、破碎过程,伴随着能量和动量的转移,在上下大气层耦合中有重要作用,对全球大气环流和热结构有重要影响(McLandress, 1998; Trinh et al., 2018).为了计入重力波对中高层大气结构的影响,在大气环流模式中对中小尺度的重力波活动进行参数化是非常必要的(Fritts and Alexander, 2003; Schirber et al., 2014; Garcia et al., 2017).这需要对重力波活动的分布特点有全面的认识.因此,研究重力波的时空分布特性是一个重要的前沿课题.
已有研究表明中高层大气重力波主要产生于对流层和低平流层(Alexander, 1996),重力波的全球活动特性与地形强迫、对流活动、背景风场及行星波活动关系密切(Xiao and Hu, 2010).作为对流层和低平流层重要的观测手段,无线电探空资料除了用于天气预报业务以外,还被广泛用于重力波研究(Tsuda et al., 1994; Vincent and Alexander, 2000; Wang and Geller, 2003; 马兰梦等,2012;Zhang et al., 2013, 2017; Dörnbrack et al., 2018).观测显示,下平流层惯性重力波垂直波长几公里,水平波长几百公里,扰动幅度几米每秒(Zhang and Yi, 2005).重力波活动特性在高纬和低纬有明显差异(Vincent and Alexander, 2000; Wang et al., 2005; Zhang et al., 2010),其全球分布特性和波源频谱远没有被全面认识,大气环流模式中仍普遍采用高度简化的重力波参数化方案(Preusse et al., 2009; Ehard et al., 2017),需要更多的重力波观测信息作为约束(Chen et al., 2018).
目前,中国境内下平流层重力波特性已有北京(卞建春,2004;袁 等,2009)、武汉(Zhang and Yi, 2005)、青藏高原(张灵杰和林永辉,2011)等地的观测研究,新疆库尔勒地区尚未见到相关报道.中国科学院国家空间科学中心曾于2011年组织了新疆临近空间环境科学考察实验活动.本文利用此次考察实验期间自主探测的新疆库尔勒地区(42°N,87°E)无线电探空资料,首次分析新疆库尔勒上空下平流层惯性重力波的基本参量(垂直波长、水平波长、固有频率、传播方向等),结果可促进对新疆地区重力波活动的认识.
本文使用的无线电探空数据通过科考活动自主探测得到.2011年9月至11月科考期间共施放中科院国家空间科学中心自主研制的无线电探空仪39个,成功获得了最高高度达34 km的39组大气温、湿、压和风场数据剖面.气球携带探空仪平均上升速度大约为5 m·s-1,间隔4 s采样一次,相应的风场和温度高度分辨率约为20 m,本文中所用风场和温度廓线高度间隔为100 m,通过将原始采样数据进行三次样条插值得到.探空观测的日期、时间和高度分布如图 1所示.

|
图 1 无线电探空仪探测的日期、时间、高度分布 °代表时间,*代表高度. Fig. 1 Date, time and height distributions of radiosonde Symbols ° and * denote time and height respectively. |
从温度廓线可知库尔勒上空秋季对流层顶高度约为12 km.文中选13 km到气球的探空高度作为分析重力波活动的高度区间.我们采用矢端曲线法(Hu et al., 2002; Zhang and Yi, 2005)提取重力波.对风场和温度廓线分别做一阶和二阶多项式拟合,将拟合结果作为背景廓线.原始廓线减去背景廓线就得到扰动廓线.比较纬向风、经向风和温度的扰动廓线,在39次观测中筛选出重力波活动明显可见的36组扰动廓线,并基于这36组廓线分析讨论.
记u, v, T分别为纬向风、经向风和温度的观测值,u, v, T为相应的背景值,扰动值记为u′, v′, T′,则u′=u, v′=v, T′=T.对温度扰动廓线作变换,记
扰动廓线包含很多波动成分,这里主要分析提取准单色重力波活动参量.采用扰动速度和温度功率谱中具有95%置信水平的最大值来确定单色重力波垂直波数m.然后,对扰动廓线作谐波拟合:
|
(1) |
|
(2) |

|
(3) |
其中m为垂直波数,z0为参考高度,即扰动廓线下边界.
用拟合的扰动廓线可以计算重力波参数.根据重力波线性理论, 低频的惯性重力波满足极化关系

|
(4) |
色散关系
|
(5) |
其中固有频率


|
(6) |

|
(7) |
其中Fuv=AuAvcos(θu-θv).
重力波传播方向与方位角
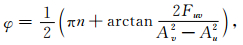
|
(8) |
其中
|
(9) |
uk=u′sin
以2011年10月6日观测数据为例给出重力波相关参量计算结果,图 2a、2b、2c分别给出纬向风、经向风和扰动廓线及相应单色重力波.我们采用传统谱分析中对采样点补零的办法,将采样点补充为512个.取功率谱Fs(m)=[Fu′(m)+Fv′(m)+

个例分析显示,观测站上空下平流层有明显的准单色大气惯性重力波活动.

|
图 2
扰动廓线与拟合廓线
(a)纬向风; (b)径向风; (c) .实线和虚线分别代表扰动和拟合廓线.
Fig. 2
Perturbation profile and fitted profile
(a) Zonal wind; (b) Meridional wind and (c) denotes . The solid line and dashed line denote perturbation profile and fitted profile respectively.
|

|
图 3
矢端曲线(a)u′与v′,(b)uk与 |
对提取出的36组准单色重力波参量做统计.图 4a、4b、4c分别给出了固有频率、垂直波长和水平波长分布,图 5给出了水平传播方向的分布.

|
图 4 频数分布图 (a)固有频率; (b)垂直波长; (c)水平波长.黑色阴影和白色阴影分别对应上传和下传重力波. Fig. 4 Histogram of the (a) intrinsic frequency, (b) vertical wavelength and (c) horizontal wavelength Black (white) shading indicates upward (downward) propagating GWs. |

|
图 5 水平传播方向分布 (a)(b)分别对应上传和下传重力波, 传播方向由自正北方向顺时针转过的角度表示. Fig. 5 Distribution of horizontal propagation direction (a) (b) denotes upward and downward propagating GWs respectively. The direction is defined to be 0° at north and increases clockwise. |
由图 4a可见,固有频率83%集中在1.1f~1.9f, 平均值为1.74f(对应的固有周期为9.1 h),其中上传(下传)重力波平均值为1.51f(2.53f).
图 4b显示垂直波长83%集中在2~4 km,平均值为2.8 km,其中上传(下传)重力波平均值为2.7 km(3.0 km);图 4c中水平波长主要集中在300~800 km,约占75%, 平均值为580 km,其中上传(下传)重力波平均值为638 km (376 km).
根据图 5,重力波垂直传播方向以能量上传为主,约占78%.水平传播方向以西北和东南为主,几乎各占1/3.
可以看到,上传和下传重力波在水平波长和固有频率的平均值方面有较大差别,在水平传播方向的分布上也有不同特点.统计而言,下传重力波固有频率较高,水平波长较短,水平传播方向以东南居多,而上传重力波水平传播方向与之相反,以西北居多.
将库尔勒地区与北半球部分站点下平流层重力波的无线电探空结果进行比较,结果如表 1所示.虽然不同站点探空数据覆盖的时间段、提取下平流层重力波所选取的高度区间和提取方法有所不同,不同站点之间显示了很多共性.相同的特点表现在垂直波长较短,固有频率较低,相应的固有周期比较长.Wang等(2005)认为探空的时间抽样间隔较长和观测到的垂直波长较短是得到的重力波固有频率较低周期较长的可能原因.
|
|
表 1 不同站点波长和固有频率平均值比较 Table 1 Mean values of wavelength and intrinsic frequency over several stations |


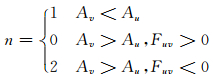
表 1中站点固有频率与科氏频率的比值

不同站点下平流层垂直传播方向都以能量上传为主.表 1中低纬两个站点水平传播方向以向东为主,中纬度武汉站点水平传播方向分布比较均匀,北京站点水平传播方向有一定不均匀性,但不是很强,主要为西北方向.36组统计显示库尔勒地区水平传播方向与低纬站点和武汉不同,和北京也有所差异.这与波源与站点的相对位置、背景大气与重力波的相互作用等有关.然而,由于探测数据较少,文中所用36组数据可能反映不了秋季季节平均状态,解释其水平传播特性时需谨慎对待.
从表 1可见,库尔勒地区固有频率与惯性频率之比
本文利用自主探测的2011年秋季探空数据,首次对新疆库尔勒上空秋季下平流层惯性重力波作了统计分析,结果给出了重力波活动的库尔勒地区特征.结果显示:垂直波长、水平波长平均值分别为2.8 km和580 km, 固有频率平均值为1.74f.垂直传播方向以上传为主,约占78%,其中下传重力波水平波长较短,固有频率较低,水平传播方向东南居多,而上传重力波水平传播方向以西北居多.与其他地区的重力波分析结果比较发现库尔勒上空下平流层重力波部分参量(如垂直波长、水平波长与垂直波长之比等)与其他中纬度站点相近,在水平传播方向上显示了不同于低纬热带和其他中纬度站点的新特征.水平波长、垂直波长在中高纬随纬度增加有减小趋势,库尔勒地区偏离了这一趋势.另外,库尔勒地区固有频率与惯性频率之比最小.这丰富了我们对大气重力波全球变化特性的认识.
Alexander M J. 1996. A simulated spectrum of convectively generated gravity waves:Propagation from the tropopause to the mesopause and effects on the middle atmosphere. Journal of Geophysical Research:Atmospheres, 101(D1): 1571-1588. DOI:10.1029/95JD02046 |
Bian J C, Chen H B, Lu D R. 2005. Statistics of gravity waves in the lower stratosphere over Beijing based on high vertical resolution radiosonde. Science in China Series D:Earth Sciences, 48(9): 1548-1558. DOI:10.1360/03yd0512 |
Chen L, Bian J C, Liu Y, et al. 2018. Statistical analysis of inertial gravity wave parameters in the lower stratosphere over Northern China. Climate Dynamics, (8): 1-13. DOI:10.1007/s00382-018-4156-9 |
Chun H Y, Song I S, Baik J J. 2006. Seasonal variations of gravity waves revealed in Rawinsonde data at Pohang, Korea. Meteorology and Atmospheric Physics, 93(3-4): 255-273. DOI:10.1007/s00703-005-0164-5 |
Dörnbrack A, Gisinger S, Kaifler N, et al. 2018. Gravity waves excited during a minor sudden stratospheric warming. Atmospheric Chemistry and Physics. DOI:10.5194/acp-2018-228 |
Ehard B, Malardel S, Dörnbrack A, et al. 2017. Comparing ECMWF high resolution analyses to lidar temperature measurements in the middle atmosphere. Quarterly Journal of the Royal Meteorological Society. DOI:10.1002/qj.3206 |
Fritts D C, Alexander M J. 2003. Gravity wave dynamics and effects in the middle atmosphere. Reviews of Geophysics, 41(1). DOI:10.1029/2001RG000106 |
Garcia R R, Smith A K, Kinnison D E, et al. 2017. Modification of the gravity wave parameterization in the whole atmosphere community climate model:Motivation and results. Journal of the Atmospheric Sciences, 74(1): 275-291. DOI:10.1175/JAS-D-16-0104.1 |
Hu X, Liu A Z, Gardner C S, et al. 2002. Characteristics of quasi-monochromatic gravity waves observed with Na lidar in the mesopause region at Starfire Optical Range, NM. Geophysical Research Letters, 29(24): 2169. DOI:10.1029/2002GL014975 |
Ma L M, Zhang S D, Yi F. 2012. Radiosonde observations of lower atmospheric gravity wave momentum flux spectra at a single mid-latitude station. Chinese Journal of Geophysics (in Chinese), 55(10): 3194-3202. DOI:10.6038/j.issn.0001-5733.2012.10.002 |
McLandress C. 1998. On the importance of gravity waves in the middle atmosphere and their parameterization in general circulation models. Journal of Atmospheric and Solar-Terrestrial Physics, 60(14): 1357-1383. DOI:10.1016/S1364-6826(98)00061-3 |
Preusse P, Eckermann S D, Ern M, et al. 2009. Global ray tracing simulations of the SABER gravity wave climatology. Journal of Geophysical Research: Atmospheres, 114(D8): D08126. DOI:10.1029/2008JD011214 |
Schirber S, Manzini E, Alexander M J. 2014. A convection-based gravity wave parameterization in a general circulation model:Implementation and improvements on the QBO. Journal of Advances in Modeling Earth Systems, 6(1): 264-279. DOI:10.1002/2013MS000286 |
Trinh Q T, Ern M, Doornbos E, et al. 2018. Satellite observations of middle atmosphere-Thermosphere vertical coupling by gravity waves. Annales Geophysicae, 36(2): 425-444. DOI:10.5194/angeo-36-425-2018 |
Tsuda T, Murayama Y, Wiryosumarto H, et al. 1994. Radiosonde observations of equatorial atmosphere dynamics over Indonesia:1. Equatorial waves and diurnal tides. Journal of Geophysical Research:Atmospheres, 99(D5): 10491-10505. DOI:10.1029/94JD00354 |
Vincent R A, Alexander M J. 2000. Gravity waves in the tropical lower stratosphere:An observational study of seasonal and interannual variability. Journal of Geophysical Research:Atmospheres, 105(D14): 17971-17982. DOI:10.1029/2000JD900196 |
Wang L, Geller M A. 2003. Morphology of gravity-wave energy as observed from 4 years (1998-2001) of high vertical resolution U.S. radiosonde data. Journal of Geophysical Research:Atmospheres, 108(D16): 4489. DOI:10.1029/2002JD002786 |
Wang L, Geller M A, Alexander M J. 2005. Spatial and temporal variations of gravity wave parameters. Part I:Intrinsic frequency, wavelength, and vertical propagation direction. Journal of the Atmospheric Sciences, 62(1): 125-142. DOI:10.1175/JAS-3364.1 |
Wang X L. 2006. Gravity wave activity in the tropical lower stratosphere with high vertical resolution radiosonde data[Master's thesis] (in Chinese). Nanjing: Nanjing University of Information Science and Technology, doi: 10.7666/d.y868386.
|
Xiao C Y, Hu X. 2010. Analysis on the global morphology of stratospheric gravity wave activity deduced from the COSMIC GPS occultation profiles. GPS Solutions, 14(1): 65-74. DOI:10.1007/s10291-009-0146-z |
Yuan W, Xu J Y, Wu Y F, et al. 2010. Statistics of gravity wave spectra in the troposphere and lower stratosphere over Beijing. Science in China Series D:Earth Sciences, 53(1): 141-149. DOI:10.1007/s11430-010-0002-6 |
Zhang L J, Lin Y H. 2011. Observational characteristics of gravity waves in lower stratosphere over a Tibetan Plateau station. Meteorological Science and Technology (in Chinese), 39(6): 768-771. DOI:10.3969/j.issn.1671-6345.2011.06.017 |
Zhang S D, Yi F. 2005. A statistical study of gravity waves from radiosonde observations at Wuhan (30°N, 114°E) China. Annales Geophysicae, 23(3): 665-673. DOI:10.5194/angeo-23-665-2005 |
Zhang S D, Yi F, Huang C M, et al. 2010. Latitudinal and seasonal variations of lower atmospheric inertial gravity wave energy revealed by US radiosonde data. Annales Geophysicae, 28(5): 1065-1074. DOI:10.5194/angeo-28-1065-2010 |
Zhang S D, Yi F, Huang C M, et al. 2013. Latitudinal and altitudinal variability of lower atmospheric inertial gravity waves revealed by U.S. radiosonde data. Journal of Geophysical Research:Atmospheres, 118(14): 7750-7764. DOI:10.1002/jgrd.50623 |
Zhang S D, Huang C M, Huang K M, et al. 2017. Latitudinal and seasonal variations of vertical wave number spectra of three-dimensional winds revealed by radiosonde observations. Journal of Geophysical Research:Atmospheres, 122(24): 13174-13190. DOI:10.1002/2017JD027602 |
卞建春, 陈洪滨, 吕达仁. 2004. 用垂直高分辨率探空资料分析北京上空下平流层重力波的统计特性. 中国科学D辑:地球科学, 34(8): 748-756. DOI:10.1360/zd2004-34-8-748 |
马兰梦, 张绍东, 易帆. 2012. 中纬低层大气重力波动量通量谱的探空观测. 地球物理学报, 55(10): 3194-3202. DOI:10.6038/j.issn.0001-5733.2012.10.002 |
王雪莲. 2006. 利用高分辨探空资料分析热带下平流层重力波活动[硕士论文]. 南京: 南京信息工程大学, doi: 10.7666/d.y868386.
|
王雪莲, 陈泽宇, 吕达仁, 等. 2006. 热带下平流层重力波的季节和年际变化特征. 自然科学进展, 16(12): 1583-1590. DOI:10.3321/j.issn:1002-008X.2006.12.009 |
袁 , 徐寄遥, 吴永富, 等. 2009. 北京上空对流层和下平流层重力波谱统计特性. 中国科学D辑:地球科学, 39(11): 1505-1514. DOI:10.1360/zd2009-39-11-1505 |
张灵杰, 林永辉. 2011. 青藏高原红原站平流层下部重力波观测特征分析. 气象科技, 39(6): 768-771. DOI:10.3969/j.issn.1671-6345.2011.06.017 |