 2018, Vol. 61


2. 国土资源部海底矿产资源重点实验室, 中国地质调查局广州海洋地质调查局, 广州 510760
2. Key Laboratory of Marine Mineral Resources, Ministry of Land and Resources, Guangzhou Marine Geological Survey, China Geological Survey, Guangzhou 510760, China
雾状层(NL, Nepheloid Layer)是一种常见的水体现象,广泛发育在湖泊、陆架、陆坡、海底峡谷以及深海盆地等环境中(Hawley, 2004b; Liu et al., 2010; Wilson et al., 2015).雾状层内悬浮颗粒物含量比相近两层或一层水体的都要高(Eittreim et al., 1969).根据其悬浮颗粒物含量的垂向分布,大陆边缘的雾状层可以分为3类:表层雾状层、中间雾状层和底部雾状层(Biscaye and Eittreim, 1977; Oliveira et al., 2002).其中底部雾状层大多由海底沉积物再悬浮形成,在陆架坡折处经常会分离形成向海延伸的舌状中间雾状层,而表层雾状层则主要受海洋表面生物活动或者河流颗粒物大量输入的影响(McCave, 1986; Oliveira et al., 2002; Inthorn et al., 2006).雾状层的厚度变化较大,从几米到几百米都有(Hoshika et al., 2003; McPhee-Shaw et al., 2004; Inthorn et al., 2006).其中的沉积颗粒物含量在零点几毫克到数百毫克之间(张晓飞, 2012).雾状层的厚度和强度会随着时间和空间变化,主要取决于局部水动力和沉积条件(Eittreim et al., 1969; McCave, 1986; McPhee-Shaw et al., 2004).雾状层内悬浮颗粒物横向上的通量远大于其垂向通量,是陆架、陆坡沉积颗粒物向深海横向输送的主要载体(Ribbe and Holloway, 2001; Inthorn et al., 2006).其中涉及的营养盐、碳、铁和其他陆源矿物的跨大陆边缘输送对深海循环系统意义重大(Lorenzoni et al., 2009; Masunaga et al., 2015).
形成和维持雾状层的因素很多(McCave, 1986).Cacchione和Southard(1974)曾提出内孤立波(ISW, Internal Solitary Wave)在大陆边缘区域的浅化会导致近海底流速和剪切应力增强,使得沉积物再悬浮,形成和维持底部雾状层(Cacchione and Drake, 1986; Richards et al., 2013).后续一系列现场观测和数值模拟也证实了内孤立波在沉积物悬浮和雾状层形成中的作用(Bogucki and Redekopp, 1999; Chronis et al., 2000; Quaresma et al., 2007; Bourgault et al., 2014).研究和分析雾状层的方法也有很多,传统方法利用声学或光学传感器来测量水体的温度、盐度、密度、浊度、流速和悬浮颗粒物含量,对雾状层进行研究(Hawley, 2004a; 张晓飞等, 2014; Anastasiou et al., 2015),或者通过水体采样来分析雾状层悬浮颗粒物含量及其生物化学组成(Pilskaln et al., 2014).本文,我们介绍一种新的方法—地震海洋学来研究南海北部的沉积物再悬浮和雾状层现象.水体中高含量的悬浮颗粒物导致雾状层和周围水体产生较大波阻抗差异,在地震海洋学剖面上形成异常强反射(Vsemirnova et al., 2012).基于地震海洋学方法,我们能够进一步研究南海北部上陆坡区域雾状层的特征及分布,讨论内孤立波对雾状层成因及特征的影响.
1 研究区域概况本文研究区域(图 1)位于南海北部东沙岛附近,水深在150~1000 m之间,横跨陆架和上陆坡两个区域.研究区域包含的主要地貌是东沙海台,因此该区域地形较平缓,平均坡度仅为0.01.海底表面富含砂质沉积,发育大量的巨型沙丘,并且有3条不规则洼地、陡坡组成的侵蚀条带沿陆坡分布,表明该区域沉积物源丰富且受海水侵蚀强烈(栾锡武等, 2011; 耿明会等, 2017).此外,该海域水体层结显著,内孤立波非常发育,Zhao等(2003, 2004)在南海东北部观测到许多大振幅内孤立波,尤其是在靠近东沙岛的陆架和陆坡区域.内孤立波在陆坡区域会发生浅化,在此过程中会耗散大量的能量(Lien et al., 2005; Bai et al., 2017).南海北部丰富的物源和独特的水动力条件为雾状层的形成提供了物质和动力基础.

|
图 1 南海北部雾状层研究区域 其中黑色方框内为研究区域,白线代表地震海洋学剖面位置,红线代表雾状层在剖面方向上的延伸,数字标识了雾状层序列号,NL-8剖面附近灰色小框代表罗又郎等(1985)的沉积物采样点位置. Fig. 1 The study area of the nepheloid layers in the northern South China Sea The black square indicates the study area. The white lines represent the seismic oceanography profiles and the red lines represent the nepheloid layers identified on the seismic oceanography profiles. The serial numbers of the profiles are labelled. The grey square near the NL-8 represents the position of sediment sampling acquired by Luo et al. (1985). |
本文主要采用的是广州海洋地质调查局2009年采集的2D多道反射地震数据.采集电缆长度为6000 m,共480道(道间距12.5 m).气枪容量为5080 in3(1 in=2.54 cm),炮间距25 m.地震子波主频为35 Hz,垂向采样点为2 ms,以平均声速1500 m·s-1计算地震剖面垂向分辨率10 m左右.多道反射地震数据经过非常规手段重新处理,可以获得反映水体反射特征的地震海洋学剖面,具体的处理流程可以参考Ruddick等(2009).同时利用Seismic Unix (SU, http://www.cwp.mines.edu/cwpcodes/)获取了剖面的其他属性信息,包括瞬时相位、瞬时频率、瞬时振幅.其中瞬时振幅剖面反映了目标层反射强度的横向变化,刻画了雾状层在剖面上的延伸范围,瞬时频率和目标层自然频率属性相关,雾状层顶部反射比周围水体的频率高,综合利用这些信息可以总结、分析南海北部雾状层的分布及特征.
除地震海洋学数据之外,图 1中所用的水深数据来源于General Bathymetric Chart of the Oceans(GEBCO, http://www.gebco.net/),经Generic Mapping Tools(GMT, http://gmt.soest.hawaii.edu/)软件成图后分辨率为1′×1′(ca.1.85 km).
3 结果 3.1 沉积物再悬浮和雾状层的异常特征在地震海洋学剖面上,海洋中水层的地震反射同相轴应该是大致平行的,随着水深的增加,海水混合更为强烈,不同水层之间波阻抗差异越来越小,因此反射同相轴振幅也会减小.一般会在海底附近形成一个反映海底湍流边界层的席状披盖反射,其内几乎全部透明,部分可能会残留一些弱反射特征(陈江欣等, 2016).然而在图 2所示的地震海洋学剖面上,除透明的席状披盖反射之外,在海底附近还出现了两段增强的异常反射,被认为是雾状层的顶界反射(Vsemirnova et al., 2012).产生原因是周围较为“洁净”的水体和含高浓度悬浮颗粒物的雾状层之间存在较大波阻抗差异,在混合强烈的海底附近形成了异常的强反射特征.在瞬时相位剖面上(图 3a),该异常反射的相位比周围水层更加连续清晰.在瞬时频率剖面上(图 3b),该异常反射表现为高频,其下出现低频.在瞬时振幅剖面上(图 3c),雾状层表现更加明显,周围水体全部表现为弱振幅,唯有雾状层顶界反射表现为强振幅.

|
图 2 底部雾状层(NL-2、NL-3)和沉积物再悬浮的地震海洋学剖面 其中图(b),(c)都是图(a)放大部分. Fig. 2 The seismic oceanography profiles of the sediment resuspension and bottom nepheloid layers (BNL) (NL-2 and NL-3) Panels (b) and (c) are the magnified maps of the squares in panel (a). |

|
图 3 底部雾状层(NL-2)的瞬时相位(a)、频率(b)、振幅(c)剖面 图(b),(c)是图(a)中蓝框区域放大. Fig. 3 The instantaneous phase (a), frequency (b) and amplitude (c) profiles of the bottom nepheloid layer (BNL) (NL-2) Panels (b) and (c) are the magnified maps of the blue square in panel (a). |
图 2展示了两个底部雾状层(BNL, Bottom Nepheloid Layer),左边雾状层(图 1标注的NL-3,图 2b)接近海底表面,其顶界位于平均水深658.7 m处,距离海底平均21.4 m,在剖面方向上延伸了3625 m.右边的底部雾状层(图 1标注的NL-2,图 2c)顶界距离海底平均104.5 m,平均水深751.5 m,在剖面方向延伸了7000 m.除雾状层之外,海底表面还发育了一种特殊的毛发状异常反射,表现为不连续、强振幅的异常反射特征,其以一定角度向水中延伸了30 m,且距离海底越远,振幅越小.此异常反射指示了海底表面沉积物的再悬浮(陈江欣等, 2016).
如图 4a所示,海水层中观测到一段明显增强的异常反射,除此之外其他水层的反射都相对较弱,但是同相轴起伏却和这段强反射保持了高度的一致性.这个舌状的强异常反射从海底陆架150 m水深处向海延伸,被认为是中间雾状层(INL, Intermediate Nepheloid Layer)的顶界反射.该中间雾状层(图 1标注的NL-8)在剖面方向上的延伸长度达到16250 m,平均水深161.5 m,平均厚度31.6 m,在其头部有一个上抬型内孤立波群发育,而中部则发育一个下凹型内孤立波,导致雾状层的几何形态(形状、深度、厚度)发生了局部变化.由于水深较浅,因此在瞬时相位剖面(图 4b)上看,周围水层和雾状层顶界的反射都较为连续,只是中间雾状层顶部反射的频率(图 4c)和振幅(图 4d)较周围水体反射更高、更强.

|
图 4 中间雾状层(NL-8)的地震海洋学(a)、瞬时相位(b)、瞬时频率(c)和瞬时振幅(d)剖面 Fig. 4 The seismic oceanography (a), instantaneous phase (b), frequency (c) and amplitude (d) profiles of the intermediate nepheloid layer (INL) (NL-8). ISW: internal solitary wave |
研究区域超过4000 km的多道反射地震数据被重新处理得到地震海洋学剖面,用来研究雾状层的分布和特征.地震海洋学剖面上,雾状层的主要特征是其顶界反射同相轴相位清晰连续,频率较高,振幅明显强于周围水体的反射(图 3、4).我们在14条剖面上发现了15个雾状层,它们的位置和编号见图 1,特征参数见表 1.南海北部东沙海域雾状层发育广泛,大部分的雾状层都靠近海底,属于底部雾状层,在剖面方向上的延伸长度从几千米到几十千米,厚度在十几米到一百米范围内,深度从135 m到751.5 m都有,横跨陆架和上陆坡区域.
|
|
表 1 南海北部雾状层的特征参数表,其编号和位置见图 1 Table 1 The characteristic parameters table of the nepheloid layers identified on the seismic oceanography profiles in the northern South China Sea. The serial numbers of the nepheloid layers are presented in Fig. 1, and their locations are highlighted by red lines |
雾状层会随着时间而发生变化.图 5是不同时间、同一位置重复采得的一段地震海洋学剖面(NL-10),其中图 5a采集时间为2009年7月16日周四11:36:30到15:39:45 UTC.可见一条明显的雾状层顶界强反射位于海底附近,其平均深度301.4 m,在剖面方向延伸了15313 m,距离海底53.9 m,海底附近还存在一个表征湍流边界层的透明席状披盖反射.而图 5b展示剖面采集时间则要比图 5a晚一个多月,为8月26日周三07:43:31到11:36:02 UTC.和前者相比,此时整个水体反射细结构变化明显,周围水层的反射更加清晰连续,表明此时海水成层性更好.如图 6所示,拾取反射同相轴定量计算之后发现,一个月以后,强反射异常表征的雾状层在剖面方向上延伸的更长达到25625 m.但是该雾状层顶界平均水深变化不大,前后都在300 m左右,雾状层厚度也变化不大,均沿着陆坡向下减薄.海底附近海水混合仍然强烈,表征湍流边界层的透明席状披盖反射也一直存在.

|
图 5 不同时间、同一位置采集的底部雾状层(NL-10)的地震剖面图 该底部雾状层位置见图 1.其中图(a)采集时间为2009年7月16日周四11:36:30到15:39:45 UTC,图(b)采集时间为2009年8月26日周三07:43:31到11:36:02 UTC. Fig. 5 The seismic oceanography profiles of the bottom nepheloid layer (BNL) (NL-10) See its location in Fig. 1. Two profiles record the same place acquired at a different time. Panel (a) is acquired on Thur, 16 Jul 2009 between 11:36:30 and 15:39:45 UTC. Panel (b) is acquired on Wed, 26 Aug 2009 between 07:43:31 and 11:36:02 UTC. |

|
图 6 底部雾状层(NL-10)的地震剖面图(a, b)和厚度变化图(c) (a, b)不同剖面上红、蓝线代表雾状层顶界和对应的海底表面的反射同相轴,图(c)中红、蓝线代表了相应剖面上该雾状层厚度. Fig. 6 Seismic oceanography profiles (a and b) and thicknesses (c) of the bottom nepheloid layer (BNL) (NL_10) Red and blue lines in panels (a) and (b) indicate the enhanced reflections and the corresponding seafloors. Red and blue lines in panel (c) represent the thicknesses of the bottom nepheloid layer on different profiles. |
在此次地震勘探中,三条剖面(图 1中的NL-9、10、15)在不同时间、不同位置记录到了同一个底部雾状层.NL-10剖面共采集了两次(图 5),其中一次(图 5b、7a)的采集时间为2009年8月26日07:43:31到11:36:02 UTC,NL-9剖面(图 7b)的采集时间是当天的13:54:17到16:10:18 UTC,二者采集时间临近,而且相互平行,均垂直陆坡NW-SE向延伸.NL-15剖面(图 7c)与NL-9、10剖面垂直相交,交点在图 7中有标识,延伸方向平行陆坡,采集时间较早为2009年7月29日05:35:32到09:37:15 UTC.三条剖面因记录时间、位置的不同,因此得到的相关参数也不同,就连测线交点处观测到的参数也有较大差别.雾状层的顶界水深都在300多米处,但在剖面方向的延伸长度和厚度都有差异(表 1、图 8).在平行陆坡的NE-SW(NL-15)剖面方向上,该雾状层延伸最长达到了30469 m.垂直陆坡方向靠近中间位置的NL-10剖面上,雾状层延伸较长有25625 m,而靠近南部的NL-9剖面上,该雾状层延伸最短仅有9375 m.该雾状层在8月26日中间厚度达到49 m,南部仅有30 m,一个月前其NE-SW向上平均厚度才28.3 m(表 1).总体来说,该雾状层处于水深300 m以下,大致呈椭球体状,长轴超过30 km,短轴9 km多,椭球体最厚时可达50 m以上.

|
图 7 不同时间、不同位置采集的同一雾状层地震海洋学剖面 剖面位置见图 1.蓝线标识NL-10(图a)和NL-15(图c)交点位置,红线标识NL-9(图b)和NL-15(图c)交点位置. Fig. 7 Three seismic oceanography profiles acquired at different times and different places, but across the same bottom nepheloid layer (BNL) See locations in Fig. 1. Blue lines indicate the intersecting point of the NL-10 (panel a) and the NL-15 (panel c). Red lines indicate the intersecting point of the NL-9 (panel b) and the NL-15 (panel c). ISW: internal solitary wave. |

|
图 8 不同时间、不同位置得到的同一雾状层的地震海洋学剖面(a, b, c, d)和该雾状层在各剖面上的厚度分布图(e) (a, b, c, d)不同剖面上彩色线表征了雾状层顶界和对应的海底表面,(e)图中不同彩色线代表了相应剖面上该雾状层厚度. Fig. 8 Seismic oceanography profiles (a, b, c, d) acquired at different times and different places, but across the same bottom nepheloid layer, and thicknesses (e) of the bottom nepheloid layer on different profiles Colorful lines on seismic oceanography profiles (a, b, c, d) indicate the enhanced reflections and the corresponding seafloors. The colorful lines in panel (e) represent the thicknesses of the bottom nepheloid layer on different profiles. |
除表征雾状层的强反射特征以外,剖面还记录到了其他特征,如NL-9剖面(图 7b)上底部雾状层发育在上抬型内孤立波和下凹型内孤立波中间,其上有很多高频震荡反射发育.NL-15剖面(图 7c)上层水体反射混乱且不连续,唯有表征雾状层的强反射连续分布在海底表面之上.
4 讨论雾状层在时间和空间上都是变化的(图 5和7),可以长期存在或暂时存在.其中的沉积颗粒物,粒径越小,越难沉降下来.粒径较大的悬浮颗粒物沉降下来需要几天、几周的时间,而稀薄雾状层中的细粒沉积物沉降时间甚至需用年计(McCave, 1986).在南海北部,两个采集时间相差40天的地震海洋学剖面(图 5),也在同一位置观测到同一底部雾状层.而地震采集得到的雾状层剖面(图 5、图 7),耗时不超过4小时,远小于雾状层的生命周期,表明可以利用地震海洋学方法来研究雾状层的特征及分布.地震海洋学方法在研究雾状层方面有明显优势,首先它能在短时间内对整个水体进行成像,纵、横向分辨率较传统的研究方法也高出很多.其次利用该方法我们可以研究南海北部雾状层的分布及其三维特征参数,甚至追踪其特征参数随时间的变化,实现雾状层的“四维”观测.观测结果表明,南海北部陆架和上陆坡区域的雾状层横向延伸从几千米到几十千米都有,平均厚度从十几米到一百米,顶界水深位于135 m至715.5 m范围内,这些特征参数会随时间、地点发生变化.
导致雾状层形成的原因很多,其中内孤立波的传播、浅化会导致雾状层的形成已经得到了一些数值模拟和现场观测证据的支持(Cacchione and Southard, 1974; Cacchione and Drake, 1986; Puig et al., 2004; Richards et al., 2013).南海北部是大振幅内孤立波发育的地方(Zhao et al., 2003, 2004).内孤立波的振幅甚至和水深在同一量级上,例如Duda等(2004)在该研究区域水深340 m处就观测到一个振幅为150 m的下凹型内孤立波,如此大振幅的内孤立波在南海北部东沙海域传播,势必会对底部边界层产生影响.如图 9所示,下凹型内孤立波沿陆坡向上传播过程中,波谷处密度界面的下方会形成与其传播方向相反的近海底反向流,其强度反比于密度界面和海底之间的距离,上抬型内孤立波情况则相反(张兴阳等, 2002; 李琳静, 2012; Orr and Mignerey, 2003).内孤立波在南海北部陆坡区域发生浅化,一个重要特征就是内孤立波极性会发生变化,从下凹型转变为上抬型(Bai et al., 2017).而在研究区域地震海洋学剖面上,雾状层附近同时观测到了下凹型和上抬型内孤立波的存在(图 4a、7b),表明雾状层分布区域刚好是内孤立波传播、浅化的区域,在此处内孤立波会耗散大量的能量,引起较大的波致流速.

|
图 9 两层海洋模型中内孤立波传播和浅化示意图(据Liu et al., 1998) Fig. 9 Schematic diagram of internal solitary wave (ISW) propagation and shoaling in a two-layer ocean model (Liu et al., 1998) |
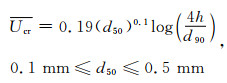
当内孤立波波致流速超过沉积物临界起动速度时,海底表面沉积物就会再悬浮(Whitmeyer and FitzGerald, 2008).沉积物再悬浮的临界起动速度取决于区域水深和沉积物粒径的大小(Rijn, 1984).以图 1所示的NL-8剖面附近海底表面为例,沉积物粒径参数由罗又郎等(1985)采样取得,该点临近区域主要覆盖生物碎屑砂,中值粒径(d50)为0.2704 mm,90%的沉积物粒径(d90)小于1.2329 mm.计算该区域沉积物临界起动速度的公式(1)来自于 van Rijn(1984):
|
(1) |
其中,粒径单位换算成m.NL-8雾状层出现区海底深度在225 m左右.计算结果表明若想NL-8附近沉积物再悬浮,海底流速要达到49 cm·s-1量级.而内孤立波与底界相互作用形成的水平流速一般可以达到70 cm·s-1,在南海北部甚至高达120 cm·s-1(张兴阳等, 2002; Orr and Mignerey, 2003).表明内孤立波在南海北部东沙海域的传播、浅化引起的波致流,足以导致沉积物再悬浮,进入水体,形成雾状层.栾锡武等(2011)和耿明会等(2017)在该区域发现了很多内孤立波作用下形成的侵蚀条带和水下沙丘,也从侧面证实了内孤立波对海底沉积物的侵蚀作用.
5 结论地震海洋学为研究南海北部雾状层的分布及特征参数变化提供了一种新的简单有效的方法,结果表明:
(1) 雾状层在南海北部陆架和上陆坡区域广泛发育,其顶界所处水深在135 m至715.5 m之间,延伸长度从几千米到几十千米,厚度最大可达100 m以上.
(2) 地震海洋学剖面上,雾状层顶界反射表现为相位连续、强振幅、高频等特征.除此之外,还伴随存在着表征底部湍流边界层的席状披盖反射和表征沉积物再悬浮的毛发状反射结构.
(3) 雾状层并非一成不变,其特征参数会随着时间、地点而发生变化.地震海洋学方法可以用于研究雾状层的三维尺寸及其时空变化.
(4) 内孤立波在南海北部密集发育,其浅化过程会导致较大的波致流速,侵蚀海底,使得沉积物再悬浮,形成和维持雾状层.
Anastasiou S, Sylaios G K, Tsihrintzis V A.
2015. Suspended particulate matter estimates using optical and acoustic sensors:application in Nestos River plume (Thracian Sea, North Aegean Sea). Environmental Monitoring and Assessment, 187(6): 392.
DOI:10.1007/s10661-015-4599-y |
|
Bai Y, Song H B, Guan Y X, et al.
2017. Estimating depth of polarity conversion of shoaling internal solitary waves in the northeastern South China Sea. Continental Shelf Research, 143: 9-17.
DOI:10.1016/j.csr.2017.05.014 |
|
Biscaye P E, Eittreim S L.
1977. Suspended particulate loads and transports in the nepheloid layer of the abyssal Atlantic Ocean. Marine Geology, 23(1-2): 155-172.
DOI:10.1016/0025-3227(77)90087-1 |
|
Bogucki D J, Redekopp L G.
1999. A mechanism for sediment resuspension by internal solitary waves. Geophysical Research Letters, 26(9): 1317-1320.
DOI:10.1029/1999GL900234 |
|
Bourgault D, Morsilli M, Richards C, et al.
2014. Sediment resuspension and nepheloid layers induced by long internal solitary waves shoaling orthogonally on uniform slopes. Continental Shelf Research, 72: 21-33.
DOI:10.1016/j.csr.2013.10.019 |
|
Cacchione D A, Southard J B.
1974. Incipient sediment movement by shoaling internal gravity waves. Journal of Geophysical Research, 79(15): 2237-2242.
DOI:10.1029/JC079i015p02237 |
|
Cacchione D A, Drake D E.
1986. Nepheloid layers and internal waves over continental shelves and slopes. Geo-Marine Letters, 6(3): 147-152.
DOI:10.1007/BF02238085 |
|
Chen J X, Bai Y, Guan Y X, et al.
2016. Geophysical analysis of abnormal seismic (oceanography) reflection characteristics of oceanic bottom boundary layer. Chinese Journal of Geophysics (in Chinese), 59(6): 2148-2161.
DOI:10.6038/cjg20160620 |
|
Chronis G, Lykousis V, Georgopoulos D, et al.
2000. Suspended particulate matter and nepheloid layers over the southern margin of the Cretan Sea (N.E. Mediterranean):Seasonal distribution and dynamics. Progress in Oceanography, 46(2-4): 163-185.
DOI:10.1016/S0079-6611(00)00017-3 |
|
Duda T F, Lynch J F, Irish J D, et al.
2004. Internal tide and nonlinear internal wave behavior at the continental slope in the northern South China Sea. IEEE Journal of Oceanic Engineering, 29(4): 1105-1130.
DOI:10.1109/JOE.2004.836998 |
|
Eittreim S, Ewing M, Thorndike E M.
1969. Suspended matter along the continental margin of the North American basin. Deep Sea Research and Oceanographic Abstracts, 16(6): 613-624.
DOI:10.1016/0011-7471(69)90062-X |
|
Geng M H, Song H B, Guan Y X, et al.
2017. The distribution and characteristics of very large subaqueous sand dunes in the Dongsha region of the northern South China Sea. Chinese Journal of Geophysics (in Chinese), 60(2): 628-638.
DOI:10.6038/cjg20170217 |
|
Hawley N.
2004a. A comparison of suspended sediment concentrations measured by acoustic and optical sensors. Journal of Great Lakes Research, 30(2): 301-309.
DOI:10.1016/S0380-1330(04)70348-2 |
|
Hawley N.
2004b. Response of the benthic nepheloid layer to near-inertial internal waves in southern Lake Michigan. Journal of Geophysical Research, 109: C04007.
DOI:10.1029/2003JC002128 |
|
Hoshika A, Tanimoto T, Mishima Y, et al.
2003. Variation of turbidity and particle transport in the bottom layer of the East China Sea. Deep Sea Research Part Ⅱ:Topical Studies in Oceanography, 50(2): 443-455.
DOI:10.1016/S0967-0645(02)00462-9 |
|
Inthorn M, Mohrholz V, Zabel M.
2006. Nepheloid layer distribution in the Benguela upwelling area offshore Namibia. Deep Sea Research Part I:Oceanographic Research Papers, 53(8): 1423-1438.
DOI:10.1016/j.dsr.2006.06.004 |
|
Li L J.
2012. Quantitative explanation of the opposite direction of internal wave propagation and sediment transport during the formation of internal wave and internal tide deposits. Sedimentary Geology and Tethyan Geology (in Chinese), 32(2): 44-48.
|
|
Lien R C, Tang T Y, Chang M H, et al.
2005. Energy of nonlinear internal waves in the South China Sea. Geophysical Research Letters, 32: L05615.
DOI:10.1029/2004GL022012 |
|
Liu A K, Chang Y S, Hsu M K, et al.
1998. Evolution of nonlinear internal waves in the East and South China Seas. Journal of Geophysical Research:Atmospheres, 103(C4): 7995-8008.
DOI:10.1029/97JC01918 |
|
Liu J T, Wang Y H, Lee I H, et al.
2010. Quantifying tidal signatures of the benthic nepheloid layer in Gaoping Submarine Canyon in Southern Taiwan. Marine Geology, 271(1-2): 119-130.
DOI:10.1016/j.margeo.2010.01.016 |
|
Lorenzoni L, Thunell R C, Benitez-Nelson C R, et al.
2009. The importance of subsurface nepheloid layers in transport and delivery of sediments to the eastern Cariaco Basin, Venezuela. Deep Sea Research Part I:Oceanographic Research Papers, 56(12): 2249-2262.
DOI:10.1016/j.dsr.2009.08.001 |
|
Luan X W, Zhang L, Peng X C.
2012. Dongsha erosive channel on northern South China Sea Shelf and its induced Kuroshio South China Sea Branch. Science China Earth Sciences, 55(1): 149-158.
DOI:10.1007/s11430-011-4322-y |
|
Luo Y L, Lao H N, Wang L Y.
1985. A preliminary study on the surface sediment types and their grain size characteristics of the northeastern part of the South China Sea. Tropic Oceanology (in Chinese), 4(1): 33-41.
|
|
Masunaga E, Homma H, Yamazaki H, et al.
2015. Mixing and sediment resuspension associated with internal bores in a shallow bay. Continental Shelf Research, 110: 85-99.
DOI:10.1016/j.csr.2015.09.022 |
|
McCave I N.
1986. Local and global aspects of the bottom nepheloid layers in the world ocean. Netherlands Journal of Sea Research, 20(2-3): 167-181.
DOI:10.1016/0077-7579(86)90040-2 |
|
McPhee-Shaw E E, Sternberg R W, Mullenbach B, et al.
2004. Observations of intermediate nepheloid layers on the northern California continental margin. Continental Shelf Research, 24(6): 693-720.
DOI:10.1016/j.csr.2004.01.004 |
|
Oliveira A, Vitorino J, Rodrigues A, et al.
2002. Nepheloid layer dynamics in the northern Portuguese shelf. Progress in Oceanography, 52(2-4): 195-213.
DOI:10.1016/S0079-6611(02)00006-X |
|
Orr M H, Mignerey P C.
2003. Nonlinear internal waves in the South China Sea:Observation of the conversion of depression internal waves to elevation internal waves. Journal of Geophysical Research:Oceans, 108(C3): 3064.
DOI:10.1029/2001JC001163 |
|
Pilskaln C H, Hayashi K, Keafer B A, et al.
2014. Benthic nepheloid layers in the Gulf of Maine and Alexandrium cyst inventories. Deep Sea Research Part Ⅱ:Topical Studies in Oceanography, 103: 55-65.
DOI:10.1016/j.dsr2.2013.05.021 |
|
Puig P, Palanques A, Guillén J, et al.
2004. Role of internal waves in the generation of nepheloid layers on the northwestern Alboran slope:Implications for continental margin shaping. Journal of Geophysical Research, 109: C09011.
DOI:10.1029/2004JC002394 |
|
Quaresma L S, Vitorino J, Oliveira A, et al.
2007. Evidence of sediment resuspension by nonlinear internal waves on the western Portuguese mid-shelf. Marine Geology, 246(2-4): 123-143.
DOI:10.1016/j.margeo.2007.04.019 |
|
Ribbe J, Holloway P E.
2001. A model of suspended sediment transport by internal tides. Continental Shelf Research, 21(4): 395-422.
DOI:10.1016/S0278-4343(00)00081-9 |
|
Richards C, Bourgault D, Galbraith P S, et al.
2013. Measurements of shoaling internal waves and turbulence in an estuary. Journal of Geophysical Research:Oceans, 118(1): 273-286.
DOI:10.1029/2012JC008154 |
|
Ruddick B, Song H B, Dong C Z, et al.
2009. Water column seismic images as maps of temperature gradient. Oceanography, 22(1): 192-205.
DOI:10.5670/oceanog.2009.19 |
|
van Rijn L C.
1984. Sediment transport, Part Ⅲ:Bed forms and alluvial roughness. Journal of Hydraulic Engineering, 110(12): 1733-1754.
DOI:10.1061/(ASCE)0733-9429(1984)110:12(1733) |
|
Vsemirnova E A, Hobbs R W, Hosegood P.
2012. Mapping turbidity layers using seismic oceanography methods. Ocean Science, 8(1): 11-18.
DOI:10.5194/os-8-11-2012 |
|
Whitmeyer S J, FitzGerald D M.
2008. Episodic dynamics of a sand wave field. Marine Geology, 252(1-2): 24-37.
DOI:10.1016/j.margeo.2008.03.009 |
|
Wilson A M, Raine R, Mohn C, et al.
2015. Nepheloid layer distribution in the Whittard Canyon, NE Atlantic Margin. Marine Geology, 367: 130-142.
DOI:10.1016/j.margeo.2015.06.002 |
|
Zhang X F. 2013. Study on the character and influencing factor of marine nepheloid layer in the northern South China Sea[Master's thesis] (in Chinese). Xiamen: Third Institute of Oceanography, State Oceanic Administration.
|
|
Zhang X F, Chen J, Xiang L H, et al.
2014. A preliminary study on the characteristics of marine nepheloid layers in the northern South China Sea and their influential factors. Acta Oceanologica Sinica (in Chinese), 36(2): 51-65.
DOI:10.3969/j.issn.0253-4193.2014.02.006 |
|
Zhang X Y, He Y B, Luo S S, et al.
2002. Deep-water sediment waves formed by internal waves. Journal of Palaeogeography (in Chinese), 4(1): 83-89.
|
|
Zhao Z X, Klemas V V, Zheng Q A, et al.
2003. Satellite observation of internal solitary waves converting polarity. Geophysical Research Letters, 30(19): 1988.
DOI:10.1029/2003GL018286 |
|
Zhao Z X, Klemas V V, Zheng Q A, et al.
2004. Remote sensing evidence for baroclinic tide origin of internal solitary waves in the northeastern South China Sea. Geophysical Research Letters, 31(6): L06302.
DOI:10.1029/2003GL019077 |
|
陈江欣, 拜阳, 关永贤, 等.
2016. 海底边界层异常(地震海洋学)反射地震特征的地球物理分析. 地球物理学报, 59(6): 2148–2161.
DOI:10.6038/cjg20160620 |
|
耿明会, 宋海斌, 关永贤, 等.
2017. 南海北部东沙海域巨型水下沙丘的分布及特征. 地球物理学报, 60(2): 628–638.
DOI:10.6038/cjg20170217 |
|
李琳静.
2012. 内波、内潮汐沉积形成过程中内波传播方向与沉积物搬运方向相反的定量解释. 沉积与特提斯地质, 32(2): 44–48.
|
|
栾锡武, 张亮, 彭学超.
2011. 南海北部东沙海底冲蚀河谷及其成因探讨. 中国科学:地球科学, 41(11): 1636–1646.
DOI:10.1007/s11430-011-4322-y |
|
罗又郎, 劳焕年, 王渌漪.
1985. 南海东北部表层沉积物类型与粒度特征的初步研究. 热带海洋, 4(1): 33–41.
|
|
张晓飞. 2012. 南海北部海洋雾状层特征及影响因素研究[硕士论文]. 厦门: 国家海洋局第三海洋研究所.
|
|
张晓飞, 陈坚, 项立辉, 等.
2014. 南海北部海洋雾状层特征及影响因素初步研究. 海洋学报, 36(2): 51–65.
DOI:10.3969/j.issn.0253-4193.2014.02.006 |
|
张兴阳, 何幼斌, 罗顺社, 等.
2002. 内波单独作用形成的深水沉积物波. 古地理学报, 4(1): 83–89.
|
|