 2015, Vol. 58


2. 中国科学院大学, 北京 100049
2. University of Chinese Academy of Sciences, Beijing 100049, China
For a single fault plane, the shear stress change on the main fault can be calculated efficiently by using the FTM, and the calculation of off-fault stress change is based on an approximate decay relation proposed by Helmstetter and Shaw. For a 2D anti-plane strain problem, we compare our numerical model with the analytical model given by Burridge and Halliday. The results show that the FTM algorithm is easy to be implemented and effectively avoid the singular values appearing in conventional stress calculation.
Based on the finite fault slip model inverted from tele-seismic data for the Wenchuan event, we obtain the stress changes on and off the fault and create a 3D view of the aftershock distribution around the main fault together with the spatial stress change pattern resulted from heterogeneous fault slip. The result of 3D view of the aftershock distribution shows that the triggered events or aftershocks are mostly concentrated in the regions with a positive stress change, and the value of the maximum positive stress change caused by the co-seismic slip is roughly equal to the localized largest stress drop (stress change is negative). We calculate the seismicity rate against time following the Wenchuan main shock based on the temporal distribution of stress changes. The results my help us better understanding the aftershock duration and seismicity reduce caused by the stress drop.
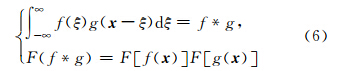
We emphasize that the fast and effective computations of stress changes on and off the fault immediately following a main shock can give us an insight into the source physics behind earthquake nucleation which provides us the plausible indicators of future potential areas of the moderate to strong aftershocks. In addition, the spatial distribution of stress change is strongly dependent on the finite fault slip model. So we discuss the influence of non-unique inversion of slip distribution on the stress change calculation.
地壳内部所发生的地震多为断层内部摩擦失稳所致.断层内部部分剪切应变能可通过同震位移得到局部释放.因此,关注主震后断层面的同震滑移分布以及静态应力变化特征已成为我们了解震源物理过程的重要研究内容之一.有关滑动位移的分布特征、静态应力降、Coulomb应力变化等物理参数的获取以及震源物理模型的建立一方面有助于震源动力学/运动学和强震地震学(用于未来地震模型的建立)的研究,另一方面,断层内部和周边应力场变化的计算则可为地震触发机制研究,余震时空分布特 征、地震迁移规律(King et al., 1994; Scholz,1998; Stein et al., 1997; Parsons,2002)等提供新的认识.近期研究成果(Kanamori and Brodsky, 2004; 刘博研等,2013)表明,中强地震无论在近场(<2~3个断层长度)还是远场都可以诱发(触发)新的地震,触发地震的成因机制一般可分为静态和动态应力触发.前者可由主震后同震位移造成的主断层内部以及周边应力变化,震后滑移(Perfettini and Avouac, 2007; Helmstetter and Shaw, 2009)和震后应力松弛(Schaff et al., 1998; Perfettini and Avouac, 2004)所致;而动态触发机制则来源于地震波能量辐射传播所造成的主断层周边断层的突发失稳,动态应力波(长周期Rayleigh波)的传播也可导致远距离的地震诱发(Hill and Prejean, 2007).有关余震的静态触发或动态触发机制讨论至今仍是学术研究的一个重要课题(Freed,2005).而主震后区域内静态Coulomb应力变化的计算(King et al., 1994; Stein,1999)已成为对余震活动性定量化描述的一种有效工具.静态Coulomb应力变化取正值的区域一般对应了区域地震活动性的明显增加;反之则对应了地震活动性的下降,形成所谓的地震影区(Harris and Simpson, 1998).事实上地震后断层面上静态应力变化和地震的动态破裂过程密不可分,因此它也和地震过程中的能量释放以及地震波辐射 相关(Ripperger and Mai, 2004).Parsons和Velasco(2009)通过对相似震级爆炸源的分析和模拟,认为近断层的余震触发主要来源于主震断层内部所形成的静态剪切应力变化.
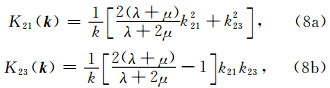
目前,虽然我们仍无法确定震前和震后断层内部的应力状态分布,但对于其应力变化的提取则获得了重要进展.基于震源表象定理,Andrews(1974,1978,1980)采用Green函数描述,给出了断层内部滑动位移分布和断层面上应力变化关系的积分表达式.对单一有限断层而言,采用傅氏变换,Andrews(1978,1980)给出了波数域内应力变化与滑动位移之间的相互关系.而Okada(1985,1992)则给出了弹性均匀半无限空间中由滑动位移求取静态应力变化的解析表达式,其解析模型已被广泛应用于Coulomb应力变化的计算中.近期运动学震源反演揭示了不同尺度下地震破裂的复杂性(Mai and Beroza, 2002).有限差分法(Ide and Takeo, 1997; Day et al., 1998)和离散波数法(Bouchon,1997)的计算则需通过断层上每一点的整个滑动时间历史,获取断层面上完整的应力的时空演化全程.而由地震数据直接求取断层面上应力分布的工作通常需要对滑动位移分布进行推断(Ripperger and Mai, 2004; Bouchon,1997),且这些方法都需要大规模和长时间的计算,尤其对于大尺度的网格节点,存在计算繁琐耗时且网格点稀疏的局限性.Andrews(1978,1980)提出的波数域中静态滑动位移分布和静态应力变化的线性关系,以波数域为媒介有效地提高了计算速度.在此基础上,Ripperger和Mai(2004)则给出了波数域内计算二维断层面上的应力变化的傅氏变换方法(FTM).
针对反平面裂纹模型求解空间不同点的位移和应力变化,传播矩阵法(Propagator Matrix Methods)(Segall,2010)给出了波数域内位移和应力随距离衰减完整表达式,其中剪切应力变化τ13同距离z的关系可写为:  其中C为一与波数有关的系数,同裂纹内部滑移函数相关,k为波数值.当给定k时,τ13随距离z呈指数衰减.在关于应力变化非均匀性和余震分布相关性研究中,Helmstetter和Shaw(2006)也提出了与上述解析模型相类似的近断层应力变化随距离呈指数衰减的近似关系.基于该近似表达式,本文将近断层周边的应力变化近似计算拓展到三维.以2008年Mw7.9汶川大地震为例,采用2D傅氏变换,获取滑动位移在波数域中的函数分布,进而计算断层内部和近断层周边的应力变化,阐述主震后强余震时空分布与空间静态应力变化之间的相关性.
2 方法原理
2.1 傅氏变换求取断层面上的应力变化分布
其中C为一与波数有关的系数,同裂纹内部滑移函数相关,k为波数值.当给定k时,τ13随距离z呈指数衰减.在关于应力变化非均匀性和余震分布相关性研究中,Helmstetter和Shaw(2006)也提出了与上述解析模型相类似的近断层应力变化随距离呈指数衰减的近似关系.基于该近似表达式,本文将近断层周边的应力变化近似计算拓展到三维.以2008年Mw7.9汶川大地震为例,采用2D傅氏变换,获取滑动位移在波数域中的函数分布,进而计算断层内部和近断层周边的应力变化,阐述主震后强余震时空分布与空间静态应力变化之间的相关性.
2 方法原理
2.1 傅氏变换求取断层面上的应力变化分布
设特征尺度为Σ(ξ)的断层埋藏于地壳内部,由断层两侧相互运动所产生的同震滑移量为Δui(ξ),且断层的运动为一双力偶源(图 1a).断层的空间位置由图 1b给出.那么经由Δui(ξ)所形成的空间内任意一点的位移可由(1)式给出(全空间解)(Aki and Richards, 1980; Segall,2010):
 |
图 1 (a)为由点源所形成的双力偶源示意图,(b)为本文所研究的断层面位置示意图 Fig. 1 (a)A double couple source formed by a point source.(b)Fault location in x1 x3 plane |
进一步,如果计算如图 1b所示,位于x2=0平面内的断层面上的位移场.当滑动位移仅沿x1方向时,公式(2)可简化写为(Andrews,1974):
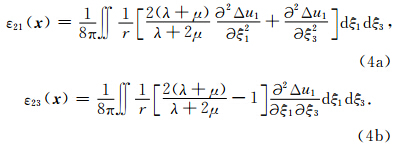
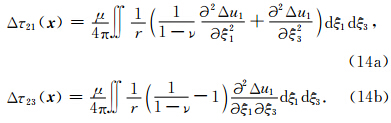
 为观测点到震源破裂点的距离.那么断层面上相应的平行和垂直于走向方向的剪切应变分量ε21和ε23分别为:
 .由此可推导出由滑动位移Δu1所产生的应变关系表达式(Andrews, 1974,1978,1980):
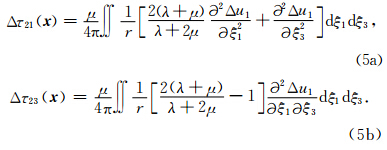
有限断层同震滑动位移场反演和震源机制的确定,已成为中强地震发生后首要进行的常规工作之一.因此,如果一旦获取了断层面上的滑动位移分布,采用上述FTM算子,可即时获得主震断层面内的剪切应力变化场,根据所得的断层面内剪应力变化分布,我们可以提取与震源破裂过程相关的物理 参数.例如应力降、地震波能量辐射(Andrews,1976)及应力变化等. 2.2 近断层区域静态应力变化的近似解
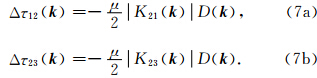
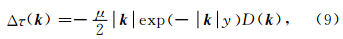
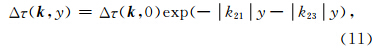
同震位移所造成的形变场主要集中于断层两侧狭窄的区域,一般正比于断层的宽度(Stein and Wysession, 2009).因此,如果我们定义近断层的距离近似为断层的宽度.对于二维反平面问题,当观测点不在断层上时,其应力变化在 k 域内有如下关系(Helmstetter and Shaw, 2006):

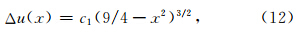
Burridge和Halliday(1971)在计算二维反平面 剪切裂纹动态破裂扩展过程中,给出了当作用于半径为 r=1的裂纹模型中,当动态应力变化满足Δτd=1-x2时,裂纹扩展产生的滑动位移场由公式(12)给出:
 ,而相应的剪切应力变化则满足:
 .在上述剪切裂纹动态扩展过程中,公式(13)所给出的静态剪切应力变化的解析解由图 2中实线给出.为验证数值模型的准确性和计算效率,我们采用快速傅氏变换的方法计算该滑动位移函数(公式(12))所对应的剪应力变化分布.为简化计算,仅计算沿圆盘径向的应力变化分布.因此公式(7)可简化为τ(k)=-μ k D(k)/2(Segall,2010).由公式(12)给出的滑移函数所计算得到的剪切应力变化的数值计算结果由图 2中星号给出.
 |
图 2 滑动位移及对应的应力变化分布图 虚线表示滑动位移的大小,实线为该滑动位移对应的应力变化分布的解析解,星号则对应了由滑动位移离散后,由FTM方法 得到的应力变化分布的数值解. Fig. 2 Slip displacement and the related stress changes Dashed line is the analytical slip function given by equation(12). Solid line shows the analytical solutions of stress change given by equation(13). Stars are the numerical solutions of stress change obtained by FTM algorithm. |
图 2给出了计算尺度为L/r=16/3的范围内,以裂纹中点为中心,裂纹半径r=1.5时,由滑动位移(公式(12))给出的裂纹内外相应的应力变化分布(公式(13)).结果表明,在发生滑动位移的区域内,数值计算所给出的应力降(应力变化取负值)最大值和解析解之间的误差随断层尺度L0和网格步长Δx而变化,当计算尺度和裂纹半径之比R0=L/r≥8,且裂纹半径r和计算步长Δx之比R1=r/Δx≥96时,其误差小于4%(如图 3绿色实线所示).而当半 径和计算步长之比R1≥96时,在滑动位移区域边界至远场,数值模型给出的计算误差则仅与计算尺度有关,图 3红色实线为滑动位移边界应力增加至极值时的误差,蓝色实线为断层边界处应力变化数值解的误差.如图所示,计算尺度越长,数值解和精确解越接近.事实上,FTM的前提假设是断层处于无限空间,不出露于地表.因此在实际计算断层面上的滑动位移时,我们通常需要将所计算的断层面进行拓宽.图 4为计算耗时与网格点个数的相关图.由图可见,随着网格点个数的增加,FTM所需的计算时间呈线性增加.而由Green函数直接求取断层面上的应力变化的方法,其计算耗时则随网格点个数N,以N2的规律增加.由此可见,对于高精度、大 尺度的应力变化分布计算,FTM计算优势更加明显.
 |
图 3 数值模型计算误差和计算精度及计算尺度的关系 图中点划线为滑动位移边界应力增加至极值的误差,该值仅和计算尺度相关,虚线为断层边界处应力变化数值解的误差.实线为滑动位移区域内应力降最大值和理论值之间的误差,当计算精度增加时,其误差逐渐减小,并有趋于滑动位移边界误差(点划线)的趋势. Fig. 3 Numerical error analysis compared with the analytical solution The dot-dashed line gives the calculation error related to the stress changes at the edge where the slip displacement is zero and the stress change reaches the maximum value. The dashed line gives the numerical error at the end of fault. Both errors are only dependent on the discretized scale. The solid lines show the numerical error of stress variation(negative stress change)at the midpoint of fault where the stress drop reaches the maximum value. |
 |
图 4 FTM计算时间和网格点数相关性 方块为应用FTM,由 Matlab计算断层面上应力变化分布时,不同网格点数对应的计算时间.实线为时间-网格点数线性拟合直线. Fig. 4 Correlation between FTM computation time and discretized grid points Squares are the computation time corresponding to different grid points by Matlab. Straight line is the linear fitting for those squares. |
2 008年5月12日汶川Mw7.9级地震发生在青藏高原东缘龙门山推覆构造带,地震同时使北川—映秀断裂和灌县—江油断裂两条倾向NW的叠瓦状逆断层发生地表破裂;其中,沿北川—映秀断裂展布的地表破裂带长约240 km,以兼有右旋走滑分量的逆断层型破裂为主,最大垂直位移6.2 m,最大右旋走滑位移4.9 m;沿灌县—江油断裂连续展布的地表破裂带长约72 km,为典型的纯逆断层型地表破裂,最大垂直位移3.5 m(徐锡伟等,2008).主震后截止到同年6月26日,共发生余震10000余个,其中震级4.0以上的有444个,其中包括Ms6.0以上强余震5次.图 5为汶川地区地形、断层及主震位置及主震后三年内的余震(M≥4.0)序列空间分布.根据远场地震波反演和有限断层模型设定,中外不同工作组都给出了主震断层面上的滑动位移分布解(Sladen,2008; Feng et al., 2010; Tong et al., 2010).本文采用前人所得有限断层滑动位移模型(Chen and Hayes, 2008),并用于进一步的应力变化求解.FTM假设了断层处于无限空间,而汶川地震断层在地表有出露且有滑动位移出现,目前通过快速傅里叶变换计算断层面上应力分布的方法,还不能够完全解析地推广到无限半空间中.在本研究中,我们将断层面向四周拓宽,人为造成无限空间,进而计算得到近似的结果.图 6即为拓宽断层面并通过三次样条插值后断层面上的滑动位移分布.从图中可以看出,滑动位移主要产生于两个较大的区域,断层两端水平方向的滑动位移较大,断层近北段以走滑为主,断层中段及南段为逆冲走滑.平行于走向方向的最大滑动位移约为8.9 m,平均位移约为 2.0 m,而平行倾向方向的最大滑动位移约为5.6 m,平均位移约为1.5 m.
 |
图 5 汶川地区地形、断层及主/余震位置(M≥4.0)序列空间分布 实线显示断层所在位置,星号为汶川主震位置,其余震以圆圈表示. Fig. 5 Map showing topography, and locations of the Wenchuan mainshock and aftershocks Solid lines represent faults in the study area. Star shows the Wenchuan main shock epicenter. Circles are aftershocks(M≥4.0). |
 |
图 6 插值后得到的汶川Mw7.9地震后断层面上的滑动位移分布(Chen and Hayes, 2008) A为断层面上沿走向方向的滑动位移分量,B为断层面上平行倾向 分量向上的滑动位移分量和C为滑动位移的矢量合成,白色箭头 为滑动位移矢量方向,色标显示其标量大小. Fig. 6 Interpolated slip distribution on the fault plane of the 2008 Mw7.9 Wenchuan earthquake(Chen and Hayes, 2008) A and B are the absolute value of slip components along the strike and down dip directions,respectively. White arrows indicate slip vectors. White rectangle shows an effective fault size. |
根据图 5所示的滑动位移分量,结合公式(7)(8)可以快速得到汶川地震后断层面上平行走向方向(图 7a)和平行倾向方向(图 8a)上的应力变化分量分布.计算结果表明,由FTM所求得的平行于走向的剪切应力变化最大值约为10.7 MPa,最大应力降为16.7 MPa,平均应力降(均方根)为ΔτsRMS=5.4 MPa.而沿倾向方向(垂直于断层走向)的应力变化最大值6.7 MPa,最大应力降为12.4 MPa,平均应力降为ΔτdRMS=3.9 MPa.由上述两个分量所产生的平均应力降则为ΔτRMS=6.6 MPa.而由位错模型Δτ=16μ /(3πW)(Starr,1928)所给出的平均应力降则约为5.2 MPa.其中断层宽度W=30 km,平均位移 =2.7 m,μ=3.0×10¹⁰ Pa·cm-2同数值计算结果相近.
 |
图 7 汶川地震后断层面及其附近平行于走向方向的应力变化 (a)为断层面上平行于走向方向的应力变化分布,(b—f)为平行 于断层面且到断层面的距离如表 1所示的截面上的平行于走 向方向的应力变化分布. Fig. 7 Stress change distributions parallel to strike direction on and off the fault (a)Stress changes on the fault plane.(b—f)Cross sections parallel to the fault plane. The distance of each cross-section to the fault plane is logarithmically spaced(Table 1). |
 |
图 8 汶川地震后断层面及其附近平行于倾向方向的应力变化 (a)为断层面上平行于倾向方向的应力变化分布,(b—f)为平行于断层面且到断层面的距离如表 1所示的截面上的平行于倾向 方向的应力变化分布. Fig. 8 Stress change distributions vertical to strike direction on and off the fault (a)Stress changes on the fault plane.(b—f)Cross-sections parallel to the fault plane. The distance of each cross-section away from the fault plane is logarithmically spaced(Table 1). |
根据所得的断层面上的应力变化分布,由公式(11)即可求得断层面附近任意一点的应力变化.图 7b—7f为平行断层面的截面上平行于走向方向的应力变化分布图,图 8b—8f为平行于断层面的截面上平行于倾向方向的应力变化分布图.各个截面到断面的距离y如表 1所示.
| 表 1 图 7和图 8中各个应力变化分布截面到断面的距离 y Table 1 Distances(y)from every cross section of stress change to the fault in Figs.7 and 8 |
对比图 6、7和8,滑动位移大的地方(破裂源点及附近)对应了静态应力变化的负值,而静态应力变化的正值,即静态应力增加,出现在离滑动位移最大处有一定距离的位置——断层的两端及深部和浅部,且应力变化随离开断层的距离呈指数衰减. 因此,根据地震的静态Coulomb应力触发机制(Dieterich,1994; King et al., 1994; Stein,1999)可知,早期余震应该集中分布在断层内部和近断层区域.这一点也同震后地震观测结果相符(吴建平等,2009;黄媛等,2008; 朱艾斓等,2008; 陈九辉等,2009).
图 9为采用双差定位后的余震(M≥ 4.0)空间分布(Wang et al., 2011)和应力变化分布的对应关系.由图 9可见,余震集中分布在应力增加或应力减少较少的空间,即主震后短期内发生的余震分布在较大滑动位移分布的周围,而鲜有余震出现在较大滑动位移分布区域.因此,我们认为主震后短期内所发生的余震应是由主震引起的局部应力增加以及震后滑移所触发的(Dieterich and Kilgore, 1996; Helmstetter and Shaw, 2006).该应力增加可能是由于断层面上滑动位移不均匀分布导致的.
 |
Fig. 9 Spatial distribution of static shear stress change parallel(a) and vertical(b)to the strike direction on and near the fault plane, and aftershock distribution within 60 days caused by the 2008 Mw7.9 Wenchuan earthquake Red solid ball denotes the hypocentral location of the main event. Fig. 9 Spatial distribution of static shear stress change parallel(a) and vertical(b)to the strike direction on and near the fault plane, and aftershock distribution within 60 days caused by the 2008 Mw7.9 Wenchuan earthquake Red solid ball denotes the hypocentral location of the main event. |
由FTM快速求解断层面上的应力分布的数值计算方法是在假设地下介质为均匀且各向同性的情况下给出的.然而实际上,地下介质的物理性质要复杂得多.根据Lamé常数和Poisson比ν之间的转换关系,公式(5)也可写为:
假设地下介质的Poisson比ν不变,考虑到地壳内部剪切波速度随深度的增加而增大,剪切模量μ 随深度增加而增大,剪应力变化量随深度而增加.因此实际应力变化值比目前计算结果偏大.例如,当深部剪切波速度较浅部增加一倍时,如果介质密度不变,深部剪切模量则较浅部增加4倍,由此较大的应力变化应出现在断层深部10~20 km深度.我们知道地震的触发和应力的变化密切相关,这也可以解释,大地震发生后区域地震活动性瞬间升高,且大部分余震深度较主震深.
由断层面上的应力变化分布,Dieterich(1994)给出了余震的静态应力触发机制理论,用于估算主震后强余震的发生位置范围、震级强度和余震持续时间.然而,断层面上的应力变化分布是直接由前人给出的断层面上的滑动位移求取的,其结果的准确性强烈依赖于滑动位移反演的结果.图 10为依据加州理工滑动位移数据库网站中所给出的汶川主震后的滑动位移分布得到的汶川地震后断层面上应力变化分布.同Chen和Hayes(2008)反演结果相比,由于滑动位移空间分布特征有着明显的差异,因此得到的应力变化的空间分布也出现了相当的差异,例如由该模型计算得到的数值应力变化(包括应力降)可达60 MPa,远大于本文所采用的滑移模型.滑动位移反演的不唯一性,会导致断层面上应力变化分布计算结果的不确定性,进而影响到未来强余震时空场的估计.从另一方面来讲,对于滑动位移分布的反演来说,主震后短期余震时空分布,则可作为断层滑动位移反演的约束条件之一,从而减小由反演方法带来的不唯一性,提高结果的可信度(Ziv,2012).
 |
图 10(a)由加州理工学院所给的滑动位移(Sladen,2008);由滑移分布计算得到的汶川地震后断层面上平行于走向方向(b)和平行于倾向方向(c)的应力变化分布 Fig. 10(a)Slip displacement distribution given by California Institute of Technology(Sladen,2008).(b) and (c)Static shear stress change distributions parallel to the strike and parallel to the dip direction,respectively |
根据Dieterich地震触发解析模型(Starr,1928),假设震前和震后远场加载过程中剪应力变化率不变,主震后其余震发生率和应力变化Δτ有如下关系:
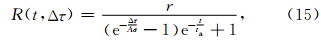
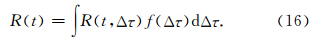
根据公式(16),对应于图 7和图 8的应力变化分布,图 11给出了由Dieterich模型(公式(15))得到的汶川地震后余震发生率的衰减曲线(蓝色实线和红色虚线),以及实际地震数据统计的余震(M≥ 3.5)个数(蓝色方块).在计算中我们取Aσ=0.1 MPa(Dieterich,1994),由余震衰减曲线的拟合可知,当 ta取75年时,由公式(15)得到的余震衰减曲线和实际地震数据最为接近.进一步,图 11中余震衰减曲线可出现R/r<1,即当t≥ 0.67ta时,余震发生率衰减到背景场,并在之后约100ta的时间内小于背景场值,之后又回到背景场地震发生率.这对于我们深入理解近断层区域应力降引起的地震影区及其 持续时间有着重要意义.并且,由于地震影区的出现,实际的余震持续时间(R/r=1时,t≈0.6ta~0.7ta)略小于拟合所得的余震持续时间ta.而由于应力变化随距离以指数规律迅速衰减,因此,可以解释大部分余震集中分布于断层内部和周边.需要注意的是,目前的计算方法无法用于判断断层终端余震的发生率和空间分布特征.
 |
图 11 汶川地震后余震R和背景地震r之比随时间t的变化 实线和虚线分别为根据公式(15)、(16),由断层面上平行于走向方向和平行于倾向的应力变化得到的汶川近断层区域余震 个数的衰减情况.方块为实际地震数据(M≥ 3.5)统计的余震 个数变化情况. Fig. 11 R/r calculated by equation(15) and (16)showing temporal distribution of seismic rates against time following the Wenchuan main shock Solid and dashed lines show the seismic rate evolution caused by the stress changes both in the strike and down dip directions,respectively. Squares are the real seismicity rates(M≥ 3.5)after the Mw7.9 Wenchuan main shock. |
从目前所获结果也可知,由滑动位移所带来的应力变化不均匀的作用是非常明显的,这种不均匀性的成因为目前地震学研究中所关注的重要课题,而不均匀性可直接影响到余震序列的衰减特征.Omori定律描述了余震序列随时间以~1/tp衰减,其中0.8<p<1.2(Hainzl and Marsan, 2008).p值的大小直接决定了余震衰减的快慢.Helmstetter和Shaw(2006)给出了指数p和应力变化分布不均 匀性的关系.如果取正值应力变化分布特征可近似 为指数分布的概率密度函数 Pτ(Δτ)~exp(-Δτ/Δτ*)所表示,其中,Δτ*为应力变化分布的特征宽度.那么,p=1-Aσ/Δτ.因此,根据断层面上的应力变化分布特征,我们可以得到余震随时间的衰减特征.或者当余震序列衰减中p值已知时,可以获知地下介质的物理参数Aσ,进而估算参数A的取值范围并同室内 实验结果比较.另外,Hainz和Marsan(2008)通过应力变化非均匀性模型,讨论了p值同主震震级的关系,随着震级增加,p值也出现相应的增加,这一切都直接地依赖于主震断层内部同震应力变化非均匀性的程度. 5 结论
由地震数据直接求取断层面上的应力分布的工作繁琐耗时(Peyrat and Olsen, 2004).借助傅氏变换的方法(Andrews,1980; Ripperger and Mai, 2004),由2008年Mw7.9汶川地震主震引起的断面上的滑动位移分布(Chen and Hayes, 2008)可以快速地求取相应的应力变化分布.在Helmstetter和Shaw(2006)的工作基础上,我们将应力变化随距离衰减的规律拓展到三维空间中,即由断层面上的应力变化,可以快速求取到断层面任意距离处的应力变化.应用该方法我们得到了汶川地震主震后断层面及其附近的应力变化分布.进而,由三维可视化软件Amira建立了汶川地震余震空间分布的3D可视化模型,以及由滑动位移分布不均匀造成的断层面及其附近应力不均匀变化的空间分布的3D可视化模型.结果显示,主震后短期内发生的余震是由主震引起的局部区域的应力增加所触发的.这些余震集中分布在应力增加或应力减少较少的空间中,在滑动位移较小的区域也可能存在余震.同时,我们也发现,余震分布并不完全同应力变化的增加一一对应,这可能归结于地震定位的不确定性或震源反演方法的多解性.另外,震后滑移、震后松弛也可以对余震时空分布产生影响(Schaff et al., 1998; Perfettini and Avouac, 2004,2007; Helmstetter and Shaw, 2009).通过对余震分布和应力变化分布关系的研究,加深了我们对Dieterich地震触发机制的了解.由此我们认为,精确定位的余震分布数据也可以作为一项重要约束参数应用在未来滑动位移解的反演中,以期提高反演结果的质量.
| [1] | Aki K, Richards P G. 1980. Quantitative Seismology. San Francisco: Freeman. |
| [2] | Andrews D J. 1974. Evaluation of static stress on a fault plane from a Green's function. Bull. Seismol. Soc. Am., 64(6): 1629-1633. |
| [3] | Andrews D J. 1976. Rupture velocity of plane strain shear cracks. J. Geophys. Res., 81(32): 5679-5687. |
| [4] | Andrews D J. 1978. Coupling of energy between tectonic processes and earthquakes. J. Geophys. Res., 83(B5): 2259-2264. |
| [5] | Andrews D J. 1980. A stochastic fault model: 1. Static case. J. Geophys. Res., 85(B7): 3867-3877. |
| [6] | Bouchon M. 1997. The state of stress on some faults of the San Andreas System as inferred from near-field strong motion data. J. Geophys. Res., 102(B6): 11731-11744. |
| [7] | Burridge R, Halliday G S. 1971. Dynamic shear cracks with friction as models for shallow focus earthquakes. Geophysical Journal International, 25(1-3): 261-283. |
| [8] | Chen J, Hayes G. 2008. Preliminary result of the May 12, 2008 Mw7.9 Eastern Sichuan, China earthquake (http://earthquake.usgs.gov/eqcenter/eqinthenews/2008/us2008ryan /finite_fault.php). |
| [9] | Chen J H, Liu Q Y, Li S C, et al. 2009. Seismotectonic study by relocation of the Wenchuan Ms8.0 earthquake sequence. Chinese Journal of Geophysics (in Chinese), 52(2): 390-397. |
| [10] | Day S M, Yu G, Wald D J. 1998. Dynamic stress changes during earthquake rupture. ,Bull. Seismol. Soc. Am. 88(2): 512-522. |
| [11] | Dieterich J H, Linker M F. 1992. Fault stability under conditions of variable normal stress. Geophys. Res. Lett., 19(16): 1691-1694. |
| [12] | Dieterich J H. 1994. A constitutive law for rate of earthquake production and its application to earthquake clustering. J. Geophys. Res., 99(B2): 2601-2618. |
| [13] | Dieterich J H, Kilgore B. 1996. Implications of fault constitutive properties for earthquake prediction. Proceedings of the National Academy of Sciences of the United States of America, 93(9): 3787-3794. |
| [14] | Feng G C, Hetland E A, Ding X L, et al. 2010. Coseismic fault slip of the 2008 Mw7.9 Wenchuan earthquake estimated from InSAR and GPS measurements. Geophys. Res. Lett., 37(1): L01302, doi: 10.1029/2009GL041213. |
| [15] | Freed A M. 2005. Earthquake triggering by static, dynamic, and postseismic stress transfer. Annual Review of Earth and Planetary Sciences, 33(1): 335-367. |
| [16] | Hainzl S, Marsan D. 2008. Dependence of the Omori-Utsu law parameters on main shock magnitude: Observations and modeling. J. Geophys. Res., 113(B10): B10309, 10.1029/2007JB005492. |
| [17] | Harris R A, Simpson R W. 1998. Suppression of large earthquakes by stress shadows: A comparison of Coulomb and rate-and-state failure. J. Geophys. Res., 103(B10): 24439-24451. |
| [18] | Helmstetter A, Shaw B E. 2006. Relation between stress heterogeneity and aftershock rate in the rate-and-state model. J. Geophys. Res., 111(B7): B07304, doi:10.1029/2005JB004077. |
| [19] | Helmstetter A. Shaw B E. 2009. Afterslip and aftershocks in the rate-and-state friction law. J. Geophys. Res., 114(B1): B01308, doi: 10.1029/2007JB005077. |
| [20] | Hill D P, Prejean S G. 2007. Dynamic triggering. // Schubert G. Treatise on Geophysics, Vol. 4. Oxford: Elsevier: 257-292. |
| [21] | Huang Y, Wu J P, Zhang T Z, et al. 2008. Relocation of the M8.0 Wenchuan earthquake and its aftershock sequence. Science China (Earth Sciences), 51: 1703-1711. |
| [22] | Ide S, Takeo M. 1997. Determination of constitutive relations of fault slip based on seismic wave analysis. J. Geophys. Res., 102(B12): 27379-27391. |
| [23] | Kanamori H, Brodsky E E. 2004. The physics of earthquakes. Rep. Prog. Phys., 67(8): 1429-1496. |
| [24] | King G C P, Stein R S, Lin J. 1994. Static stress changes and the triggering of earthquakes. Bull. Seismol. Soc. Am., 84(3): 935-953. |
| [25] | Lay T, Wallace T C. 1995. Modern Global Seismology. New York: Academic Press. |
| [26] | Liu B Y, Shi B P, Lei J S. 2013. Effect of Wenchuan earthquake on probabilities of earthquake occurrence of Lushan and surrounding faults. Acta Seismologica Sinica (in Chinese), 35(5): 642-651. |
| [27] | Mai P M, Beroza G C. 2002. A spatial random field model to characterize complexity in earthquake slip. J. Geophys. Res., 107(B11): ESE10-1-ESE10-21. |
| [28] | Okada Y. 1985. Surface deformation due to shear and tensile faults in a half-space. Bull. Seismol. Soc. Am., 75(4): 1135-1154. |
| [29] | Okada Y. 1992. Internal deformation due to shear and tensile faults in a half-space. Bull. Seismol. Soc. Am., 82(2): 1018-1040. |
| [30] | Parsons T. 2002. Global Omori law decay of triggered earthquakes: Large aftershocks outside the classical aftershock zone. J. Geophys. Res., 107(B9): ESE9-1-ESE9-20. |
| [31] | Parsons T, Velasco A A. 2009. On near-source earthquake triggering. J. Geophys. Res., 114(4): B10307, doi: 10.1029/2008JB006277. |
| [32] | Perfettini H, Avouac J P. 2004. Postseismic relaxation driven by brittle creep: A possible mechanism to reconcile geodetic measurements and the decay rate of aftershocks, application to the Chi-Chi earthquake, Taiwan. J. Geophys. Res., 109(B2): B02304, doi: 10.1029/2003JB002488. |
| [33] | Perfettini H, Avouac J P. 2007. Modeling afterslip and aftershocks following the 1992 Landers earthquake. J. Geophys. Res., 112(B7): B07409, doi: 10.1029/2006JB004399. |
| [34] | Peyrat S, Olsen K B. 2004. Nonlinear dynamic rupture inversion of the 2000 Western Tottori, Japan, earthquake. Geophys. Res. Lett., 31(5): L05604, doi: 10.1029/2003GL019058. |
| [35] | Ripperger J, Mai P M. 2004. Fast computation of static stress changes on 2D faults from final slip distributions. Geophys. Res. Lett., 31(18): L18610, doi: 10.1029/2004GL020594. |
| [36] | Schaff D P, Beroza G C, Shaw B E. 1998. Postseismic response of repeating aftershocks. Geophys. Res. Lett., 25(24): 4549-4552. |
| [37] | Scholz C H. 1998. Earthquakes and friction laws. Nature, 391(6662): 37-42. |
| [38] | Segall P. 2010. Earthquake and Volcano Deformation. Princeton: Princeton University Press. |
| [39] | Sladen A. 2008. Preliminary result 05/12/2008 (Mw7.9), east Sichuan ( http://www.tectonics.caltech.edu/slip_history/2008_e_sichuan /e_sichuan.html). |
| [40] | Starr A T. 1928. Slip in a crystal and rupture in a solid due to shear. //Green B J. Mathematical Proceedings of the Cambridge Philosophical Society. Cambridge: Cambridge University Press, 489-500. |
| [41] | Stein R S. 1999. The role of stress transfer in earthquake occurrence. Nature, 402(6762): 605-609. |
| [42] | Stein R S, Barka A A, Dieterich J H. 1997. Progressive failure on the North Anatolian fault since 1939 by earthquake stress triggering. Geophys. J. Int., 128(3): 594-604. |
| [43] | Stein S, Wysession M. 2009. An Introduction to Seismology, Earthquakes, and Earth Structure. Chichester: John Wiley & Sons. |
| [44] | Tong X P, Sandwell D T, Fialko Y. 2010. Coseismic slip model of the 2008 Wenchuan earthquake derived from joint inversion of interferometric synthetic aperture radar, GPS, and field data. J. Geophys. Res., 115(B4): B04314, doi: 10.1029/2009JB006625. |
| [45] | Wang X, Yu X, Zhang W. 2011. High-resolution 3D seismic imaging of the Longmenshan fault zone structure using double-difference seismic tomography. AGU Fall Meeting Abstracts, 7. |
| [46] | Wu J P, Huang Y, Zhang T Z, et al. 2009. Aftershock distribution of the Ms8.0 Wenchuan earthquake and three dimensional P-wave velocity structure in and around source region.Chinese Journal of Geophysics (in Chinese), 52(2): 320-328. |
| [47] | Xu X W, Wen X Z, Ye J Q. 2008. The Ms8.0 Wenchuan earthquake surface ruptures and its seismogenic structure. Seismology and Geology (in Chinese), 30(3): 597-629. |
| [48] | Zhu A L, Xu X W, Diao G L, et al. 2008. Relocation of the Ms8.0 Wenchuan earthquake sequence in part: preliminary seismotectonic analysis. Seismology and Geology (in Chinese), 30(3): 759-767. |
| [49] | Ziv A. 2012. Inference of coseismic slip via joint inversion of GPS and aftershock data: The 2004 Parkfield example. J. Geophys. Res., 117(B3): B03307, doi: 10.1029/2011JB008400. |
| [50] | 陈九辉, 刘启元, 李顺成等. 2009. 汶川Ms8.0地震余震序列重新定位及其地震构造研究. 地球物理学报, 52(2): 390-397. |
| [51] | 刘博研, 史保平, 雷建设. 2013. 汶川地震对芦山地震及周边断层发震概率的影响. 地震学报, 35(5): 642-651. |
| [52] | 吴建平, 黄媛, 张天中等. 2009. 汶川Ms8.0级地震余震分布及周边区域 P波三维速度结构研究. 地球物理学报, 52(2): 320-328. |
| [53] | 徐锡伟, 闻学泽, 叶建青. 2008. 汶川 Ms8.0地震地表破裂带及其发震构造. 地震地质, 30(3): 597-629. |
| [54] | 朱艾斓, 徐锡伟, 刁桂苓等. 2008. 汶川Ms8.0地震部分余震重新定位及地震构造初步分析. 地震地质, 30(3): 759-767. |