2. 中国地震局地壳应力研究所,北京 100085
2. Institute of Crustal Dynamics, China Earthquake Administration, Beijing 100085, China
早在20世纪60年代阿拉斯加大地震之前,就发现了与地震相关的电离层效应[1].Migulin 等利用Intercosmos-19卫星的观测资料,首次发现在大地震震中上方存在ELF/VLF 电磁脉冲信号[2].尔后,关于卫星上观测到与地震相关的电离层异常扰动现象的文章被陆续发表[3~39].与地震有关的电离层扰动通常表现为震前电场、磁场、等离子体参量以及高能粒子通量变化;异常可能出现在震前数天甚至几小时或者更短时间内,但一般不连续出现;在靠近震中上空的位置更容易观测到震前异常,范围在经度上约10°,纬度上约4°[3, 4, 8~11, 13, 14].地震产生的电磁效应主要以化学、声学、电磁途径向空中传播,进而引起电离层异常扰动[40].主要机制为声重波(AGW)或空气重力波[26, 41, 42]与垂直电场机制[43].
对于地震与电离层电场异常扰动关系的研究,主要有两种方法.第一种为单个地震震例研究.如Intercosmos-Bulgaria-1300 卫星在1982 年1 月21日地震前约15 min, 在震中上空附近观测到了3~7mV/m的准静电场垂直分量扰动[6].Aureol-3 卫星在1982年3月17日地震前大概20min, 观测到72Hz和150Hz的水平电场分量信号增强;在1982年9月8日地震前约1h20min, 观测到150Hz的电场垂直分量信号增强[5].Cosmos-1809 卫星在1989年1月17日伊朗地震前2.5min, 观测到140Hz的电场强度升高了约10μV/m[30].DEMETER 卫星在Gujarat[28]、ArunachalPradesh 地震[29]、汶川地震[16, 34, 39]、九江地震[35]、西藏改则地震[36]、新疆于田地震[37]、云南普洱地震[14, 38]、智利地震[33]前观测到ULF/ELF电场或电场平均功率谱密度发生异常扰动以及在汶川地震前观测到地面VLF 发射站发射的电磁信号的信噪比降低[22].另一种是对多个地震进行统计分析.如Henderson 等[8]利用DE-2 卫星数据研究了地震引起的ELF/VLF 辐射,发现63%的地震轨道飞过震中时,至少20个通道观测到ELF/VLF辐射增强,幅度达10μV/m.Mathews和Lebreton[31]统计分析了GEOS-2 卫星记录的三个月(1979年1月、3月6日~4月5日、7月)的ULF频段(0.3~11Hz)的电场数据,发现GEOS-2 卫星记录到的波数据扰动可能与地震无关.Larkina等[32]利用Intercosmos-19 卫星记录的数据,对1979~1981年间震级大于5.5、深度小于60km、震中磁纬小于45°的39个地震,用统计分析方法研究了震中上空的VLF辐射.发现在电离层中可观测到的低频(0.1~16kHz)电磁辐射异常的范围为地理经度±60°、地理纬度±2°;中心频率为800Hz和4650Hz的通道比140Hz、450Hz和15000Hz的通道记录到的结果更可信;地震震源深度和震中位置对于卫星观测的结果都有影响.
从前人的研究中可以获得两个方面的信息.第一,对地震前电离层中电场扰动时的频段的研究基本上集中在频率低于1000Hz的频段;第二,地震前电离层中频率低于1000Hz的电场或电场平均功率谱密度会增强.对10kHz以上的卫星观测的电离层中电场扰动与地震关系的研究鲜见报道,这正是本文的研究内容.在2008年5月12日,我国四川发生了震惊中外的Ms8.0汶川特大地震.在2004年6月29日,法国发射了一颗专门服务于地震监测的电磁卫星---DEMETER (Detection of Electro-Magnetic Emission from Earthquake Regions)卫星,直到现在还在运行.它携带的探测电离层电场的电场探测仪ICE(Instrument Capteur Electrique)包含了4 个频段:DC/ULF(0~15 Hz)、ELF(15~1kHz)、VLF(15~17.4 kHz)和HF(10 kHz~3.175 MHz).这为研究汶川地震前是否存在10kHz以上频段的电离层电场异常扰动提供了绝佳机会,因此本文将研究DEMETER 卫星观测到的10~18kHz电场在汶川地震前是否存在明显的扰动,以深化认识.
2 研究频段、区域、时间段和数据特征在本文,研究频段选定为10~18kHz, 将之定义为LF 频段.研究区域是大致以汶川地震震中(103.4°E,31.0°N,据中国地震信息网www.csi.ac.cn)为中心的矩形区域,21°N~41°N,93°E~113°E.时间段为2006、2007、2008、2009年的3月22日~6月25日,即汶川地震发生前后约1个半月.
分析DEMETER 卫星电场数据可知,对于本文的研究频段,只能获得其平均功率谱密度数据.每段谱持续时间为4.096s, 由两个子段组成,每一个子段持续时间为2.048s, 每一个子段由40 个频谱平均而成,每个谱采用加矩形窗的2048 点FFT 变换而得,频率分辨率为19.53125Hz.
考虑到电离层一般会受到地磁活动的影响,如在磁暴期间电离层会有非常复杂的变化,几乎所有的电离层参数都会受到影响[17, 44].因此有必要考虑观测期间的地磁指数Kp和Dst.Kp指数是单个地磁台用来描述每日每3小时内的地磁扰动强度的指数,称为三小时指数或磁情指数,为0~9之间的值,每天8 个.ΣKp指数表示每天的8 个Kp指数之和,如果ΣKp>30,则认为当天的地磁活动强烈[18].Dst是描述磁暴时变化的指数,主要表征了全球环电流感应场的强度,一般认为当Dst指数低于-50nT 并持续2h 以上时,表示磁暴可能发生[45].分析从京都世界地磁数据中心(World Data Center for Geomagnetism, Kyoto)下载的2006~2009年的Kp和Dst指数,发现在3月22日~6月25日期间,2006 年有4 天(4 月5 日,32- ;4 月9日,38+ ;4 月14 日,43- ;4 月15 日,34-)、2007 年有4天(4月1日,33- ;4月28日,32+ ;5月23日,34;5月24日,32)、2008年有3天(3月27日,34+ ;3月28日,30+ ;4月23日,31+)、2009年无ΣKp>30;2006年有4天(4月5日,15h;4月9日,5h;4月14日,19h;4月15日,2h)、2007年有3天(3月24日,8h;4月1日,2h;5月23日,2h)、2008年和2009年无Dst指数低于-50nT 并持续2h以上的天数.在数据处理过程中,剔除了ΣKp>30 或Dst指数低于-50nT 并持续2h以上的天数.
3 结果及分析研究所用的一级科学数据可以从DEMETER数据服务网站(http://demeter.cnrs-orleans.fr/)下载,但不能直接用于研究.首先需根据经纬度和时间范围筛选出通过研究区域的卫星轨道;其次从数据集中选择出所需要的轨道,进行解压,并归类;第三,将选择的穿过研究区域内的卫星轨道数据的二进制格式批量转换成ASCII格式;第四,筛选出范围在(21°N~41°N,93°E~113°E)中的数据;最后,筛选出不同频率的空间分布数据并成图.
考虑到DEMETER 卫星的重访周期约为16天,因此研究中以16天为周期,获得了LF 频段(频率间隔约为2kHz)的平均功率谱密度空间分布图.从某种意义上说,它们是单一频率的平均功率谱密度的准时空变化图像.
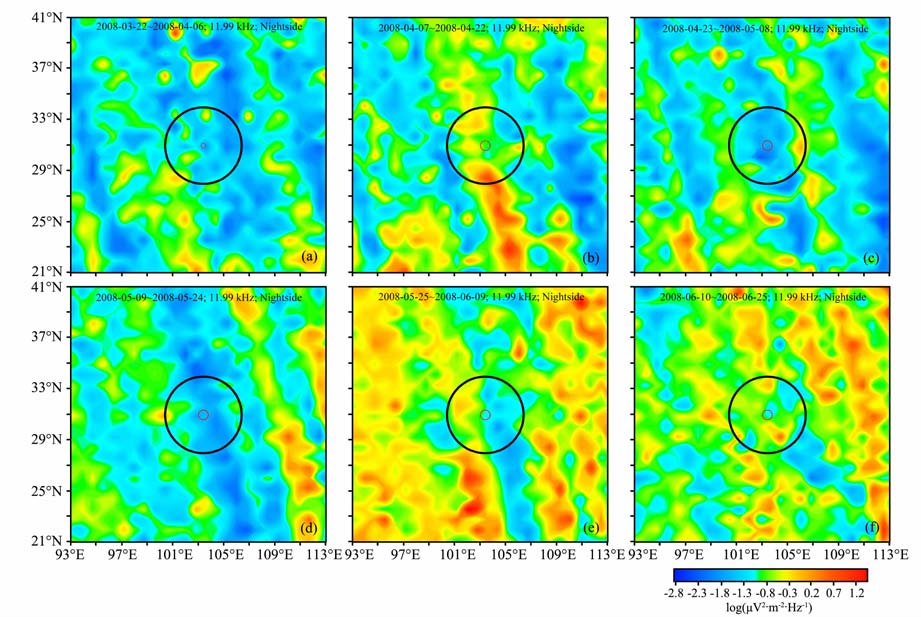
3.1 夜侧平均功率谱密度图 1 揭示出,在汶川地震震中周围约300km范围内,震前约一个半月到约一个月,夜侧平均功率谱密度幅度明显增大(图 1a,1b),到震前约半个月开始减小(图 1c),在发震时段基本达到最小(图 1d),震后恢复并明显增大(图 1e,1f).频率为10kHz、13.98kHz、15.98kHz和17.96kHz的夜侧平均功率密度分布图(因篇幅所限,在此未给出图像.)也呈现出了相同的特征.
|
图 1 2008年11.99kHz不同时段的夜侧平均功率谱密度分布图中红色圆圈表示汶川地震震中位置,黑色圆圈表示以震中为中心,约300 km为半径的区域.下图同. Fig. 1 The distribution of nightside average power spectrum density of 11.99 kHz in different periods in 2008 The red circle represents the focus of Wenchuan earthquake, and the black circle represents the focus-centered region with radius 300 m.The same below. |
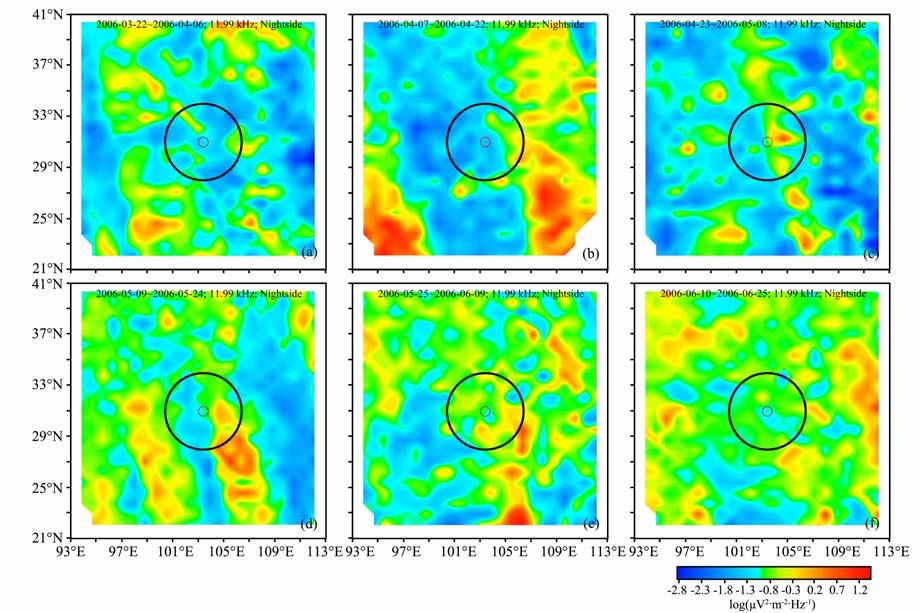
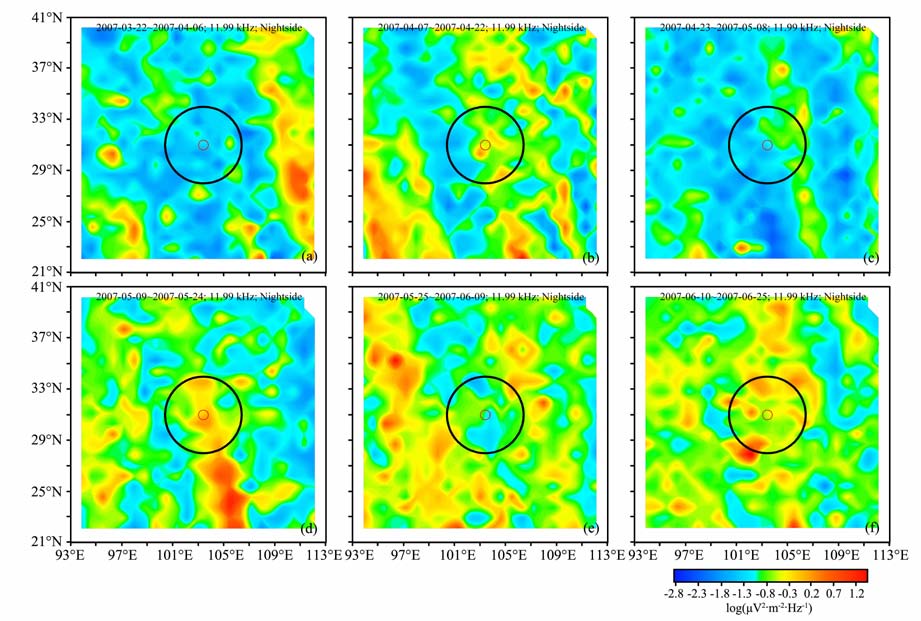
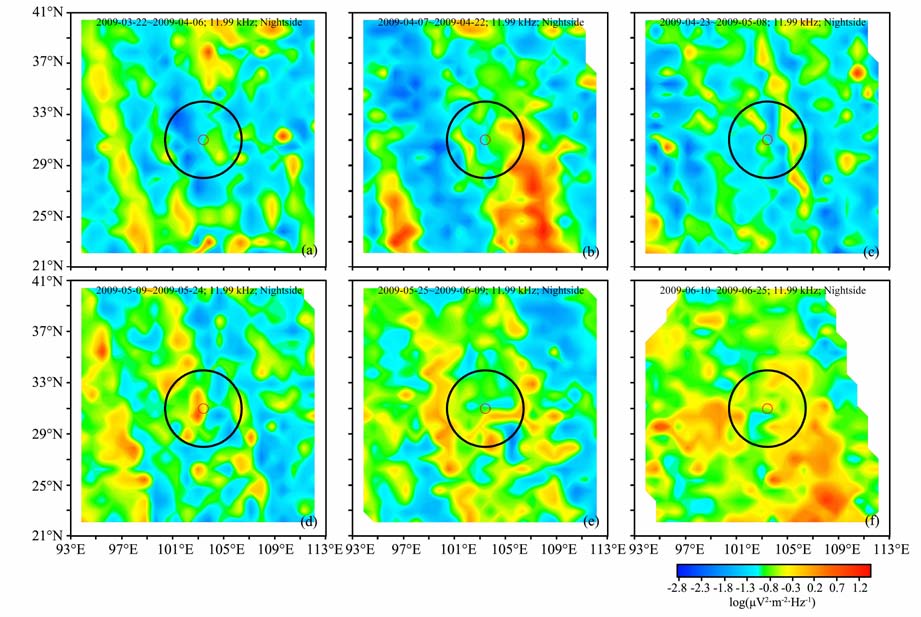
作者同时获得了2006、2007 年和2009 年相同时段和频率的电场平均功率谱密度分布图(图 2、3和图 4).分析图 2~图 4后发现,它们在对应时段的图像特征基本相似:在5月9日~5月24日前一个半月到一个月,汶川地震震中周围300km 范围内的电场平均功率谱密度逐渐增大(图 2a,2b 或图 3a,3b或图 4a,4b),但增大的幅度没有2008年的那么显著(对比图 1b和图 2b或图 3b 或图 4b).随后平均功率谱密度的幅度减小(图 2c 或图 3c 或图 4c),到了时段5月9日~5月24日,没有像2008年的平均功率谱密度的幅度继续减小,基本达到最小幅度(图 1d)那样,反而增大(图 2d 或图 3d 或图 4d),尤其是2007年(图 3d)和2009 年(图 4d)的比较显著,随后则无明显变化.由于在数据处理中,剔除了地磁活动强烈和磁暴可能发生的时间的数据,因此2008年与2006、2007年和2009年同时段的电场平均功率谱密度分布的显著差异应当不是地磁活动或者磁暴引起的,表明可能是因为汶川地震的孕育和发生引起了电离层中电场的显著扰动.
|
图 2 2006年11.99kHz不同时段的夜侧平均功率谱密度分布 Fig. 2 The distribution of nightside average power spectrum density of 11.99 kHz in different periods in 2006 |
|
图 3 2007年11.99kHz不同时段的夜侧平均功率谱密度分布 Fig. 3 The distribution of nightside average power spectrum density of 11.99 kHz in different periods in 2007 |
|
图 4 2009年11.99kHz不同时段的夜侧平均功率谱密度分布 Fig. 4 The distribution of nightside average power spectrum density of 11.99 kHz in different periods in 2009 |
一般情况下,由于昼侧太阳活动强,对电离层电场的影响较大,而夜侧活动弱,对电离层电场的影响较小,且磁环境相对比较干净,因此在用电场数据来分析与地震的关联性时,一般采用夜侧的观测数据[22].不过,本文同时研究了昼侧的平均功率谱密度与汶川地震的相关性.
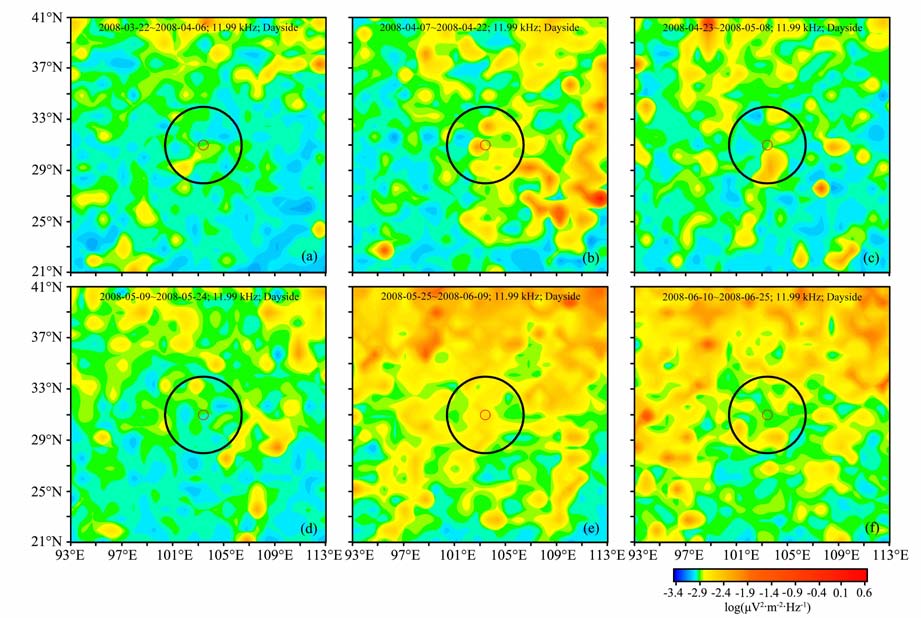
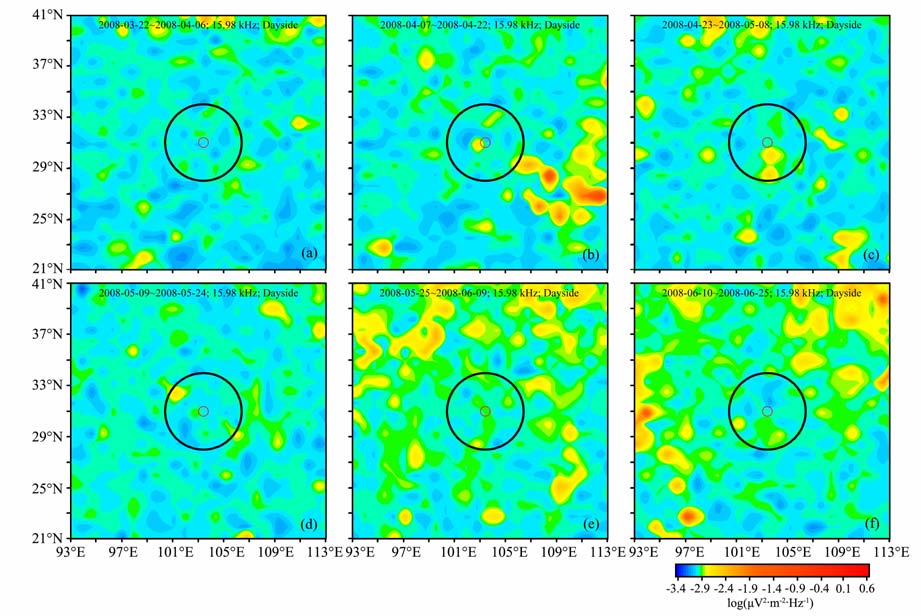
图 5揭示出了与图 1相同的电离层中电场平均功率谱密度的变化规律:汶川地震前约一个半月(图 5a)到约一个月(图 5b),平均功率谱密度的幅度明显增加,到震前约半个月(图 5c),幅度开始减小,到地震发生时继续减小(图 5d),震后则明显增大.这种特征在13.98kHz的平均功率谱密度分布图上仍然存在,但已经不显著.当频率达到15.98kHz时,这种特征基本消失(图 6),并且震中300km 范围内的平均功率谱密度没有显著变化.表明如果图 5中的电场平均功率谱密度变化特征是由汶川地震所导致,那么汶川地震所能引起的昼侧电场平均功率谱密度扰动的频段可能不会大于16kHz.换句话说,难以在DEMETER 卫星观测的16kHz以上的昼侧电场数据中提取出与汶川地震有关的信息.
|
图 5 2008年11.99kHz不同时段的昼侧平均功率谱密度分布 Fig. 5 The distribution of dayside average power spectrum density of 11.99 kHz in different periods in 2008 |
|
图 6 2008年15.98kHz不同时段的昼侧平均功率谱密度分布 Fig. 6 The distribution of dayside average power spectrum density of 15.98 kHz in diferent periods m 2008 |
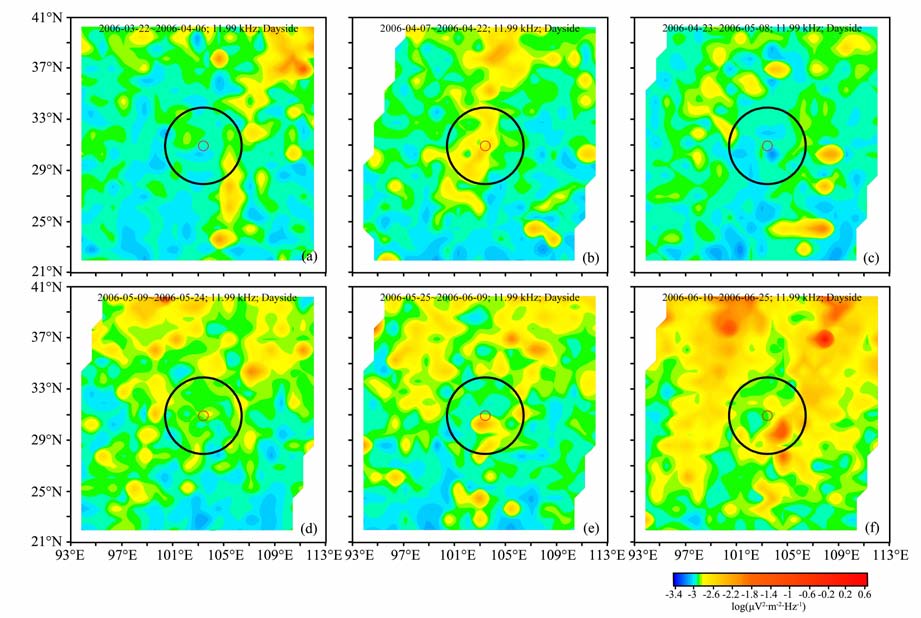
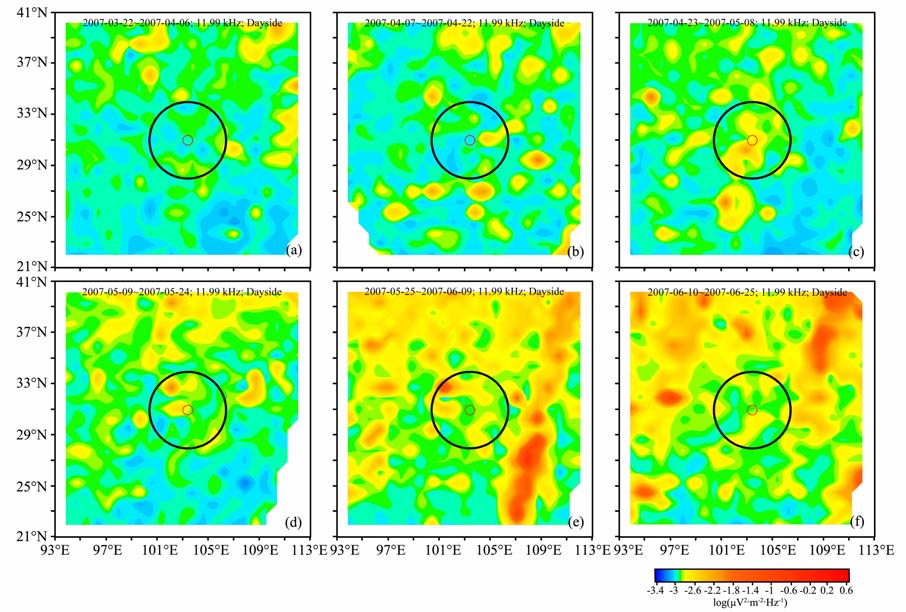
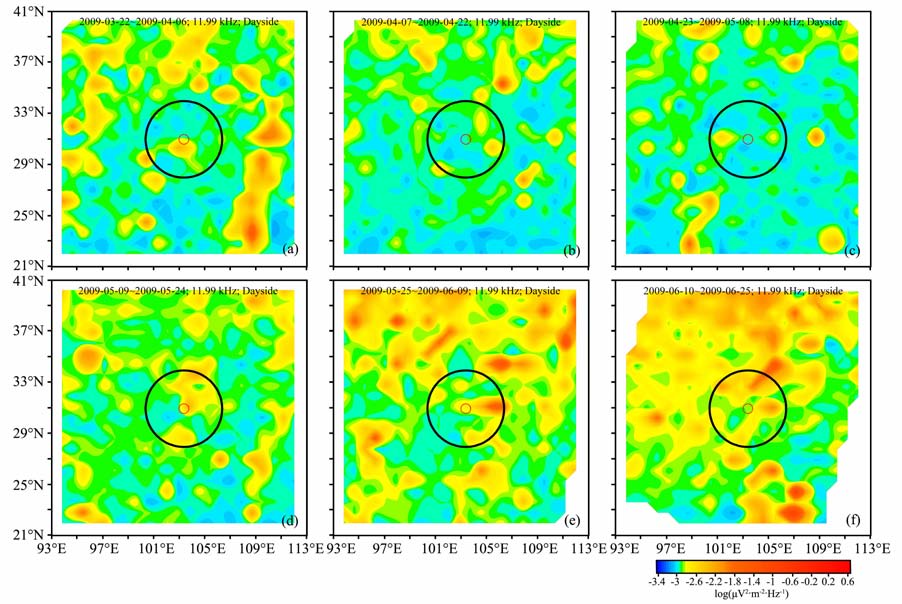
同样,文中分别给出了2006、2007年和2009年频率为11.99kHz的昼侧平均功率谱密度分布图(图 7,8和图 9).发现震中300km 范围内,从2006年5月9日~5月24 日时段前约一个半月(图 7a)到约一个月(图 7b),平均功率谱密度的幅度明显增大,到约半个月(图 7c),又明显减小,然后到5 月9日~5月24日时段(图 7d)则又明显增大,尔后继续增大(图 7e,7f).从2007年5月9日~5月24日时段前约一个半月(图 8a)到约一个月(图 8b),平均功率谱密度的幅度变化不明显,到约半个月(图 8c),则显著增大,然后到5 月9 日~5 月24 日时段(图 8d)没有明显变化,尔后略微增大(图 8e,8f).从2009年5月9日~5 月24 日时段前约一个半月到约半个月(图 9a,9b,9c),平均功率谱密度的幅度变化不大,到5月9日~5月24日时段(图 9d)明显增大,尔后略微增大(图 9e,9f).这表明在没有地震发生的情况下,5月9日~5 月24 日时段昼侧的平均功率谱密度的幅度表现为高值,这与2008年汶川地震发生时段(图 5d)电场平均功率谱密度的幅度减小(表现为低值)的特征截然不同,因此,汶川地震可能是导致2008年5月9日~5月24日时段14kHz以下昼侧电场平均功率谱密度的幅度减小的原因.
|
图 7 2006年11.99kHz不同时段的昼侧平均功率谱密度分布 Fig. 7 The distribution of dayside average power spectrum density of 11.99 kHz in different periods in 2006 |
|
图 8 2007年11.99 kHz不同时段的昼侧平均功率谱密度分布 Fig. 8 The distribution of dayside average power spectrum density of 11.99 kHz in diferent periods m 2007 |
|
图 9 2009年11.99kHz不同时段的昼侧平均功率谱密度分布 Fig. 9 The distribution of dayside average power spectrum density of 11.99 kHz in different periods in 2009 |
研究表明,在汶川地震发生前,电离层参数如电子总含量TEC、电离层F2 层最大电子密度NmF2、电子浓度、电子温度、氧离子浓度、ELF 电场等出现了明显的扰动[16, 19~21, 34, 39].不过,这些研究没有涉及到卫星观测的10kHz以上频段的电场.本文正是针对此,研究了DEMETER 卫星观测到的10~18kHz的电场平均功率谱密度变化与汶川地震的关系,以深化认识地震对电离层电场扰动的影响.
本文的研究结果表明,昼侧频段为10~14kHz、夜侧频段为10~18kHz的电场平均功率谱密度,在汶川地震前后发生了明显的幅度变化:震前先明显增大,随后减小,到发震时段达到最低,震后恢复并略微增大.这个结果跟何宇飞等[22]利用地面VLF发射站发射的信号在DEMETER 卫星上观测到的电磁信号信噪比在汶川地震前明显降低基本一致.不过,何宇飞等[22]认为白天太阳活动对电离层影响剧烈,基本淹没了各发射台发射的特定频率的VLF信号,因此没有给出白天的研究结果.曾中超等[16]发现汶川地震前电离层中ELF 电场平均功率谱密度增强,这跟文中的研究结果有差异.作者认为,导致这种差异的主要原因可能是因为研究的频段不同.这可以得到佐证:2004年12月26~31日期间,在Andaman & Nicobar 地区发生大地震时,DEMETER 卫星记录到的ULF/ELF 电场平均功率谱密度增强,但VLF(10~18kHz)的却减小1).
一般情况下,除地震之外,闪电雷暴放电引起的电磁辐射以及人类活动产生的电磁噪声等也可能引起电离层异常电磁信号,而且后者的排除相当困难.因此,在研究中虽然没有考虑地磁活动强烈和磁暴可能发生时段的电场数据,并同时对比分析了2006、2007年和2009年对应时段和频段的电场平均功率谱密度,但还是无法确定汶川地震前后电场平均功率谱密度的明显变化就是由地震所引起,这需要更多震例研究的积累.
致谢感谢中国地震局地震预测研究所张学民、欧阳新艳以及中国地震局地球物理研究所刘晓灿提供了本文研究的DEMETER 卫星数据和数据格式转换软件XPRO.非常感谢审稿专家提出的建设性修改意见和建议.Kp和Dst指数从京都世界地磁数据中心(http://wdc.kugi.kyoto-u.ac.jp/index.html)下载.该研究内容是国家科技支撑计划(2008BAC35B01)的一部分.
| [1] | Davis K, Barker D. Ionospheric effects observed around the time of the Alaska Earthquake of March, 1964. J. Geophys. Res. , 1965, 70: 2551-2553. |
| [2] | Migulin V V, Larkina V I, Molchanov M B, et al. Detection of earthquake influence the ELF/VLF emissions at the upper ionosphere. Preprint of IZMIRAN , 1982, 25: 22. |
| [3] | Larkina V I, Migulin V V, Mogilevskii M M, et al. Earthquake effects in the ionosphere according to INTERCOSMOS-19 and AUREOL-3 satellite data. In: CNES eds. Results of the Arcad 3 Project and of the Recent Programmes in Magnetospheric and Ionospheric Physics, Toulose: CEPADUES Editions, 1985. 685~699 |
| [4] | Parrot M, Lefeuvre F. Correlation between GEOS VLF emissions and earthquakes. Ann. Geophys. , 1985, 3: 737-748. |
| [5] | Parrot M, Mogilevsky M. VLF emission associated with earthquakes and observed in the ionosphere and magnetosphere. Phys. Earth Planet. Inter. , 1989, 57: 86-99. DOI:10.1016/0031-9201(89)90218-5 |
| [6] | Chmyrev V M, Isaev N V, Bilichenko S V, et al. Observation by space-borne detectors of electric fields and hydromagnetic waves in the ionosphere over an earthquake center. Phys. Earth Planet. Inter. , 1989, 57: 110-114. DOI:10.1016/0031-9201(89)90220-3 |
| [7] | Serebryakova O N, Bilichenko V M, Chmyrev V M, et al. Electromagnetic ELF radiation from earthquake region as observed by low-altitude satellites. Geophys. Res. Lett. , 1992, 19: 91-94. DOI:10.1029/91GL02775 |
| [8] | Henderson T R, Sonwalker V S, Helliwell R A, et al. A search for ELF/VLF emissions induced by earthquake as observed in the ionosphere by the DE-2 satellite. J. Geophys. Res. , 1993, 98: 9503-9514. DOI:10.1029/92JA01533 |
| [9] | Molchanov O A, Mazhaeva O A, Goliavin A N, et al. Observation by the INTERCOSMOS-24 satellite of ELF/VLF emissions associated with earthquakes. Ann. Geophys. , 1993, 11: 431-440. |
| [10] | Parrot M. Statistical study of ELF/VLF emissions recorded by a low altitude satellite during seismic events. J. Geophys. Res. , 1995, 99: 23339-23347. |
| [11] | Rodger C J, Dowden R L, Thomson N R. A search for ELF/VLF activity associated with earthquakes using ISIS satellite data. J. Geophys. Res. , 1996, 101: 13369-13378. DOI:10.1029/96JA00078 |
| [12] | Hayakawa M, Molchanov O A, Ondoh T, et al. Precursory signature of the Kobe Earthquake on VLF subionospheric signal. J. Atmos. Electr. , 1996, 16(3): 247-257. |
| [13] | Molchanov O A, Hayakawa M, Afonin V V, et al. Possible influence of seismicity by gravity waves on ionospheric equatorial anomaly from data of IK-24 satellite 2. Equatorial anomaly and small-scale ionospheric turbulence. In: Hayakawa M, Molchanov O A eds. Seismo Electromagnetics: Lithosphere-Atmosphere-Ionosphere Coupling. Tokyo: Terr. Sc. Pub., 2002. 287~296 |
| [14] | 朱 荣. 从卫星观测数据提取地震电离层前兆信息的初探. 北京:中国地震局地球物理研究所, 2007. Zhu R. Preliminary study of extract earthquake-related information in ionospheric from satellite data (in Chinese). Beijing: Institute of Geophysics, China Earthquake Administration, 2007 |
| [15] | 欧阳新艳. 利用DEMETER卫星数据提取地震异常的方法初探——以普洱地震为例. 北京:中国地震局地震预测研究所,2008. Ou Yang X Y. Study on methods for extracting earthquake-related anomalies using observations of DEMETER satellite illustrated by the case of Pu'er (in Chinese). Beijing: Institute of Earthquake Prediction, China Earthquake Administration, 2008 |
| [16] | 曾中超, 张蓓, 方广有, 等. 利用DEMETER卫星数据分析汶川地震前的电离层异常. 地球物理学报 , 2009, 52(1): 11–19. Zeng Z C, Zhang B, Fang G Y, et al. The analysis of ionospheric variations before Wenchuan earthquake with DEMETER data. Chinese J. Geophys. (in Chinese) , 2009, 52(1): 11-19. |
| [17] | Pulinets S A, Boyarehuk K A. Ionospheric Precursors of Earthquakes. New York: Springer, 2004 . |
| [18] | Hattori K, Akinaga Y, Hayakawa M, et a1. UI F magnetic anomaly preceding the 1997 Kagoshima earthquakes. In: Hayakawa M, Molchanov O A eds. Seismo electromagnetics: Lithosphere-Atmosphere-Ionosphere Coupling. Tokyo: Terr. Sc. Pub., 2002. 19~28 |
| [19] | 熊晶, 吴云, 祝芙英, 等. 汶川地震前电离层NmF2异常扰动. 大地测量与地球动力学 , 2008, 28(6): 22–26. Xiong J, Wu Y, Zhu F Y, et al. Anomalous disturbance of ionospheric NmF2 during Wenchuan earthquake. Journal of Geodesy and Geodynamics (in Chinese) , 2008, 28(6): 22-26. |
| [20] | 祝芙英, 吴云, 林剑, 等. 汶川地震前电离层VTEC的异常响应. 地震学报 , 2009, 31(2): 180–187. Zhu F Y, Wu Y, Lin J, et al. Anomalous response of ionospheric VTEC before the Wenchuan earthquake. Acta Seismologica Sinica (in Chinese) , 2009, 31(2): 180-187. |
| [21] | 林剑, 吴云, 祝芙英, 等. 基于GPS探测汶川地震电离层TEC的异常. 地球物理学报 , 2009, 52(1): 297–300. Lin J, Wu Y, Zhu F Y, et al. Wenchuan earthquake ionosphere TEC anomaly detected by GPS. Chinese J. Geophys. (in Chinese) , 2009, 52(1): 297-300. |
| [22] | 何宇飞, 杨冬梅, 陈化然, 等. DEMETER卫星探测到可能与汶川地震有关的地面VLF发射站信号的信噪比变化. 中国科学(D辑) , 2009, 39(4): 403–412. He Y F, Yang D M, Chen H R, et al. SNR changes of VLF radio signals detected onboard the DEMETER satellite and their possible relationship to the Wenchuan earthquake. Science in China (Series D) (in Chinese) , 2009, 39(4): 403-412. |
| [23] | Pulinets S A, Legen'ka A D. Spatial-temporal characteristics of the large scale disturbances of electron concentration observed in the F-region of the ionosphere before strong earthquakes. Cosm. Res. , 2003, 41: 221-229. DOI:10.1023/A:1024046814173 |
| [24] | Pulinets S A, Boyarchuk K A, Lomonosov A M, et al. Ionospheric precursors to earthquakes: a preliminary analysis of the foF2 critical frequencies at Chungli ground-based station vertical sounding of the ionosphere (Taiwan island). Geomagnetism and Aeronomy , 2002, 42: 508-513. |
| [25] | Pulinets S A, Gaivoronska T B, Contreras A L. Correlation analysis technique revealing ionospheric precursors of earthquakes. Natural Hazards and Earth System Sciences , 2004, 4: 697-702. DOI:10.5194/nhess-4-697-2004 |
| [26] | Calais E, Minister J B. GPS detection of ionospheric perturbations following the January 17, 1994, Northridge earthquake. Geophys. Res. Lett. , 1995, 22: 1945. DOI:10.1029/95GL02008 |
| [27] | Liu J Y, Chuo Y J, Shan S J, et al. Pre-earthquake ionospheric anomalies monitored by GPS TEC measurements. Ann. Geophys. , 2004, 22(5): 1585-1593. DOI:10.5194/angeo-22-1585-2004 |
| [28] | Bhattacharya S, Sarkar S, Gwal A K, et al. Satellite and ground-based ULF/ELF emissions observed before Gujarat earthquake in March 2006. Current Science , 2007, 93(1): 41-46. |
| [29] | Bhattacharya S, Sarkar S, Gwal A K, et al. Observations of ULF/ELF anomalies detected by DEMETER satellite prior to earthquake. Indian Journal of Radio & Space Physics , 2007, 36: 103-113. |
| [30] | Isaev N V, Serebryakova O N. Electromagnetic and plasma effects of seismic activity in the earth ionosphere. Chem.Phys.Reports , 2001, 19(6): 1177-1188. |
| [31] | Mathews J P, Lebreton J P. A search for seismic related wave activity in the micropulsation and ULF frequency ranges using GOES-2 data. Ann. Geophys. , 1985, 3(6): 749-754. |
| [32] | Larkina V I, Migulin V V, Molchanov O A, et al. Some statistical results on very low frequency radiowave emissions in the upper ionosphere over earthquake zones. Phys. Earth Planet. Inter. , 1989, 57: 100-109. DOI:10.1016/0031-9201(89)90219-7 |
| [33] | 张学民, 钱家栋, 欧阳新艳, 等. DEMETER卫星观测到的智利7.9级地震前的电离层电磁扰动. 地球物理学进展 , 2009, 24(4): 1196–1203. Zhang X M, Qian J D, Ou Yang X Y, et al. Ionospheric electromagnetic disturbances observed on DEMETER satellite before an earthquake of M7.9 in Chili. Progress in Geophysics (in Chinese) , 2009, 24(4): 1196-1203. |
| [34] | 董健, 颜蕊, 张景发, 等. 基于DEMETER卫星观测数据的电离层地震前兆分析——以汶川地震、东海地震为例. 地震 , 2009, 29(Suppl.): 67–75. Dong J, Yan R, Zhang J F, et al. Analysis of earthquake-related information in ionosphere based on DEMETER satellite data-Applicated to Wenchuan and Donghai Earthquakes. Earthquake (in Chinese) , 2009, 29(Suppl.): 67-75. |
| [35] | 刘静, 张学民, 申旭辉, 等. 九江地震前DEMETER卫星观测到的电离层异常. 地震 , 2009, 29(Suppl.): 60–66. Liu J, Zhang X M, Shen X H, et al. Ionospheric anomalies before the Jiujiang earthquake observed by the DEMETER satellite. Earthquake (in Chinese) , 2009, 29(Suppl.): 60-66. |
| [36] | 张学民, 刘静, 钱家栋, 等. 西藏改则6.9级地震前的电离层电磁扰动. 地震 , 2008, 28(3): 14–22. Zhang X M, Liu J, Qian J D, et al. Ionospheric electromagnetic disturbance before Gaize earthquake with Ms6.9, Tibet. Earthquake (in Chinese) , 2008, 28(3): 14-22. |
| [37] | 张学民, 钱家栋, 欧阳新艳, 等. 新疆于田7.2级地震前的电离层电磁扰动. 空间科学学报 , 2009, 29(2): 213–221. Zhang X M, Qian J D, Ou Yang X Y, et al. Ionospheric electro-magnetic disturbances prior to Yutian 7.2 earthquake in Xinjiang. Chinese Journal of Space Science (in Chinese) , 2009, 29(2): 213-221. |
| [38] | 朱荣, 杨冬梅, 荆风, 等. DEMETER卫星观测到的云南普洱地震前的电离层扰动. 地震学报 , 2008, 30(1): 76–81. Zhu R, Yang D M, Jing F, et al. Ionospheric perturbations before Pu'er earthquake observed by the satellite DEMETER. Acta Seismologica Sinica (in Chinese) , 2008, 30(1): 76-81. |
| [39] | 张学民, 申旭辉, 欧阳新艳, 等. 汶川8级地震前空间电离层VLF电场异常现象. 电波科学学报 , 2009, 24(6): 1025–1032. Zhang X M, Shen X H, Ou Yang X Y, et al. Ionosphere VLF electric field anomalies before Wenchuan M8 earthquake. Chinese Journal of Radio Science (in Chinese) , 2009, 24(6): 1025-1032. |
| [40] | 丁鉴海, 申旭辉, 潘威炎, 等. 地震电磁前兆研究进展. 电波科学学报 , 2006, 21(5): 791–801. Ding J H, Shen X H, Pan W Y, et al. Seismo-electromagnetism precursor research progress. Chinese Journal of Radio Science (in Chinese) , 2006, 21(5): 791-801. |
| [41] | Davies J B, Archambeau C B. Modeling of atmospheric and ionospheric disturbances from shallow seismic sources. Phys. Earth Planet. Inter. , 1998, 105: 183-199. DOI:10.1016/S0031-9201(97)00090-3 |
| [42] | Ducic V, Artru J, Murakami M, et al. Ionospheric remote sensing of the Denali Earthquake Rayleigh surface waves. Geophys. Res. Lett. , 2003, 30: 1951. |
| [43] | Pulinets S A, Boyarchuk K A, Khegai V V, et al. Quasielectrostatic model of atmosphere-thermosphere-ionosphere coupling. Adv. Space Res. , 2000, 26(8): 1209-1218. DOI:10.1016/S0273-1177(99)01223-5 |
| [44] | Danilov A D, Lastovika J. Effects of geomagnetic storms on the ionosphere and atmosphere. Int. J. Geomagn. Aeron. , 2001, 2(3): 209-224. |
| [45] | Gonzalez W D, Joselyn J A, Kamide Y, et al. What is a geomagnetic storm. J. Geophys. Res. , 1994, 99: 5771-5792. DOI:10.1029/93JA02867 |
 2011, Vol. 54


